


Are equities in the inflation sweet spot?
Are equities in the inflation sweet spot?
Based on our definition of 'low' inflation, equities must wait for another couple of months before they hit the inflation sweet spot.

In a recent note, we showed that equities tend to do well when (headline) inflation peaks. But with peak inflation reached more than nine months ago, when the June CPI numbers were released, and the S&P 500 Index up 9% since, peak inflation likely has run its course. The question is whether equities will hit the inflation ‘sweet spot’ soon.
Even though equities offer a theoretical hedge against inflation, as most companies exhibit at least some pricing power, the relationship between the two is mostly negative. Equities realize their best returns when inflation is (very) low.
Defining Low and High Inflation
To substantiate this, we look at the 3- and 6-month future returns on the S&P 500 Index when inflation is ‘Low’ or ‘High.’ Since headline inflation trended higher between 1950 and 1980 before reversing in the next four decades, ranking historical inflation data and calculating subsequent returns adds up to comparing inflation regimes instead of pursuing an investable strategy based on CPI data.
Therefore, we will focus on the current level of inflation relative to a medium-term average of five years. This allows for a fairer comparison of the relationship between inflation and equity returns over the decades.
In our analysis, inflation is ‘High’ when the current level is one or two standard deviations above the 5-year moving average. ‘Low’ inflation is when the current level is one or two standard deviations below the 5-year moving average. In addition, we look at return data starting in 1950 and 1990.
Inflation and Returns – The results
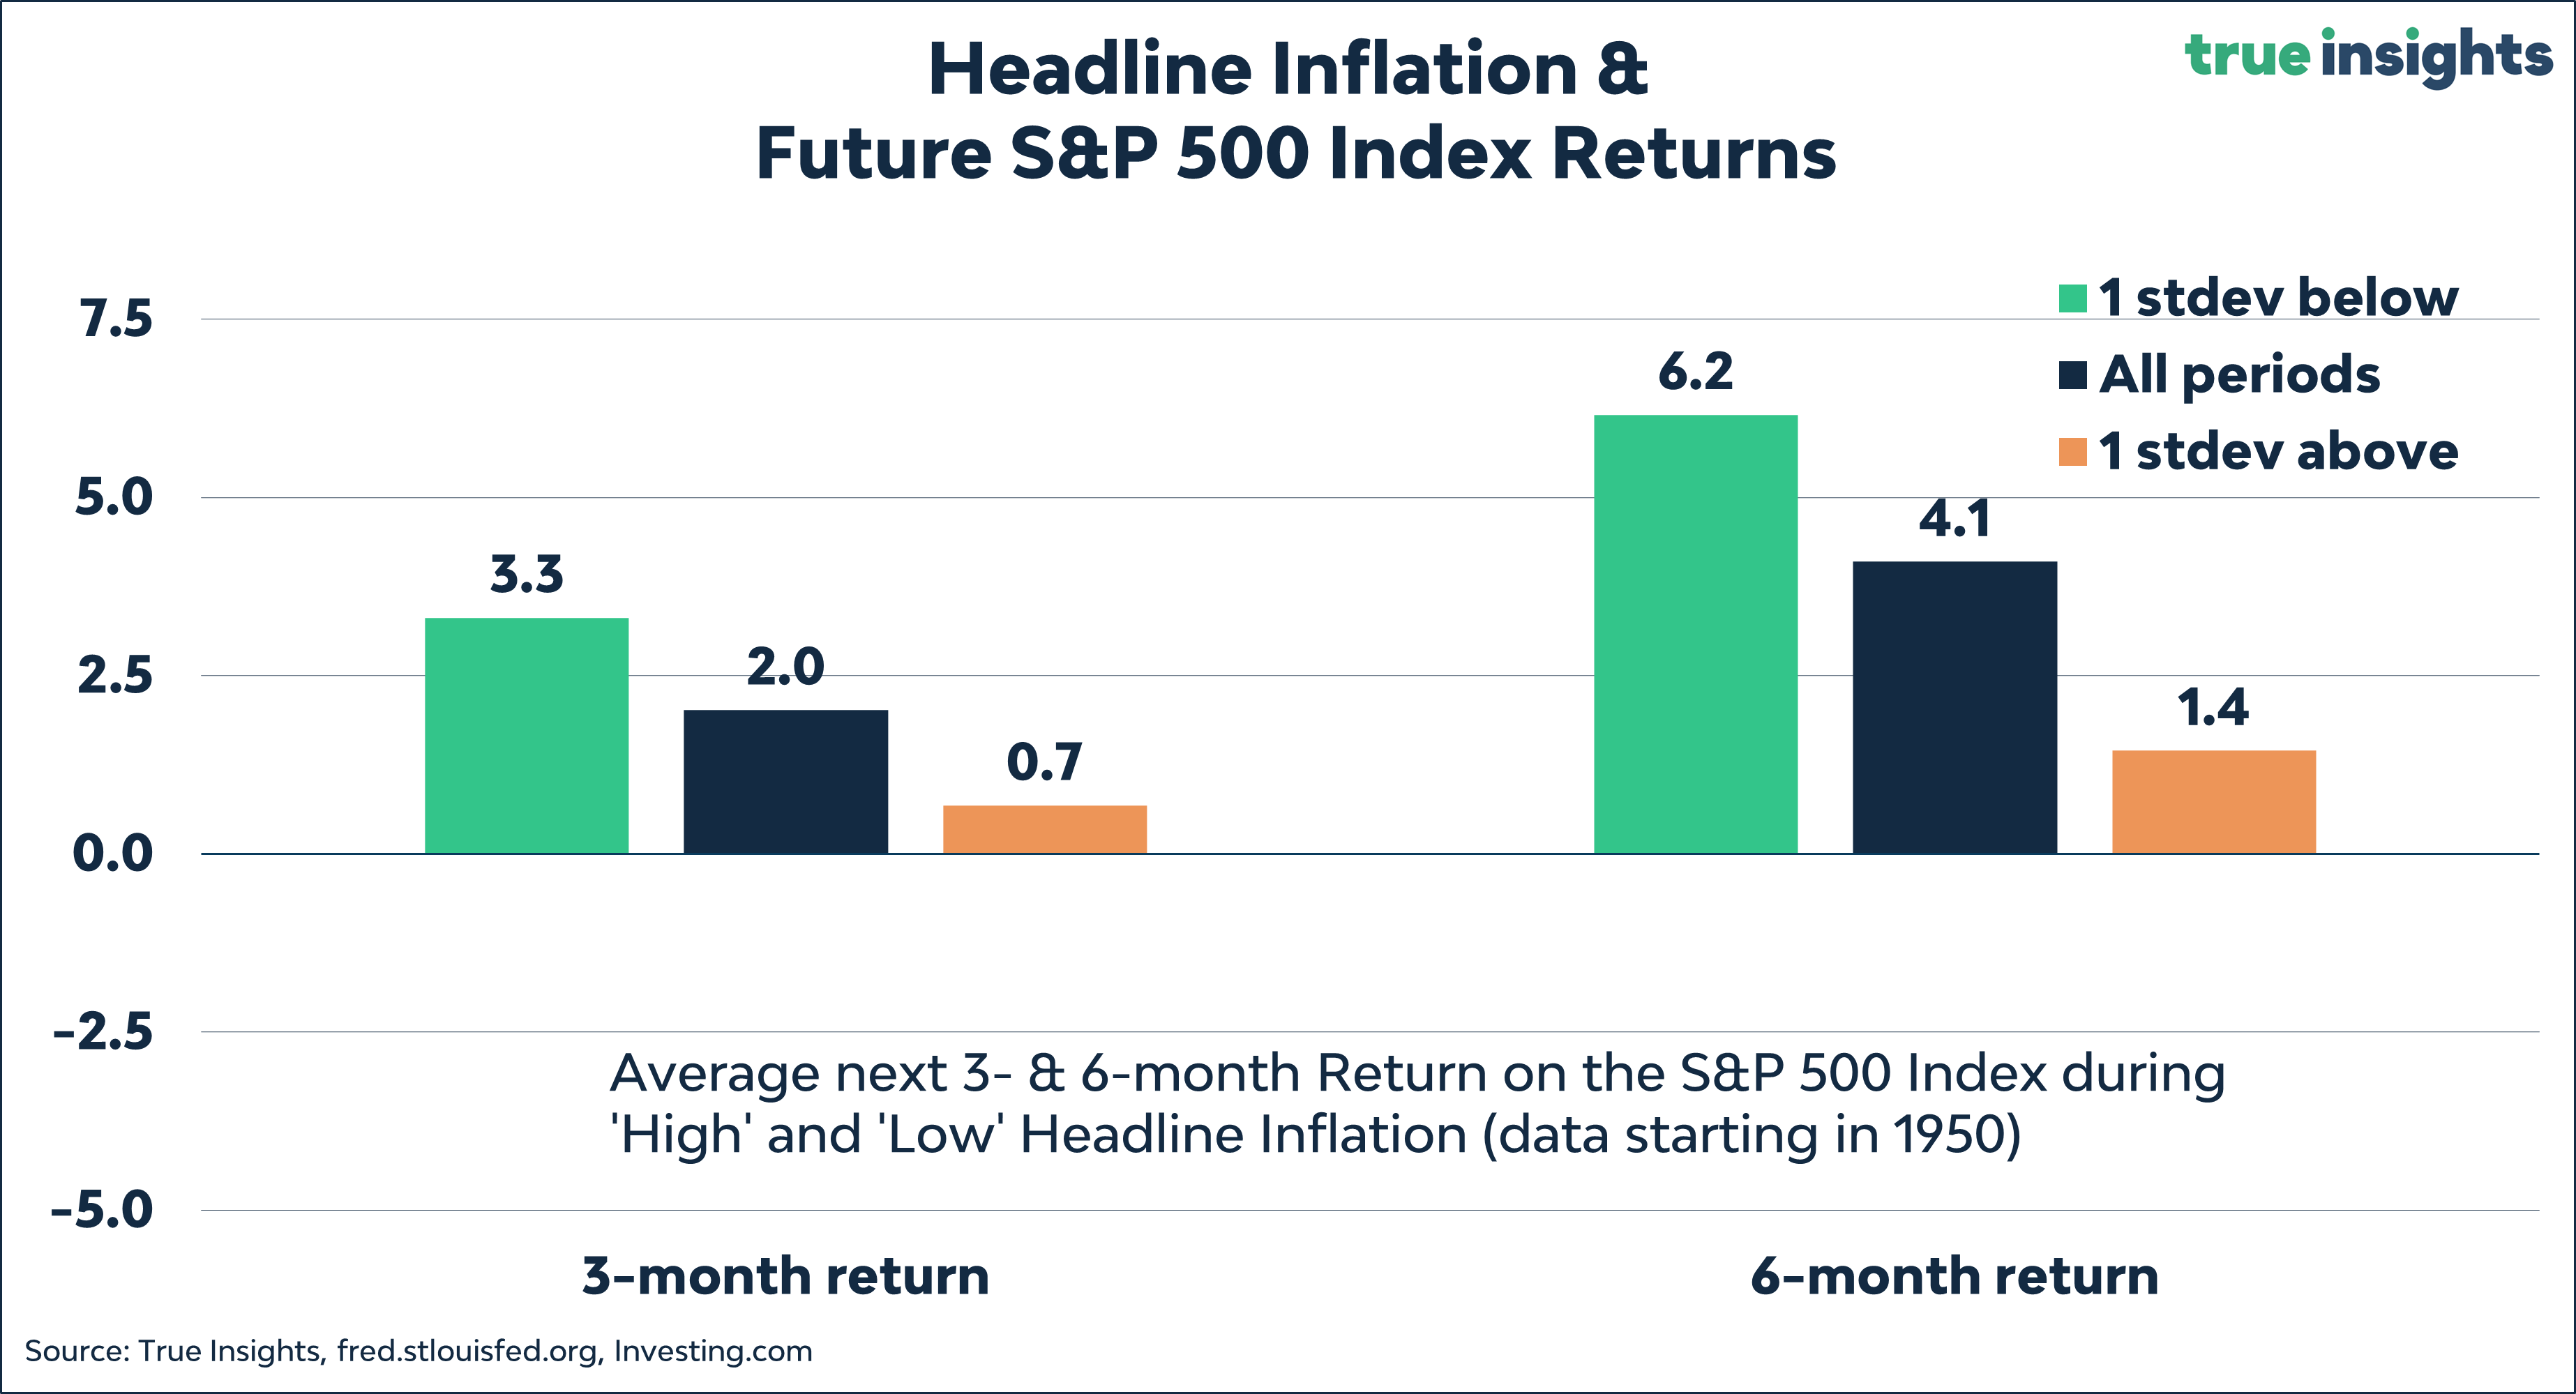
The chart below shows the 3- and 6-month S&P 500 Index returns when inflation is one standard deviation above/below its 5-year moving average classification since 1950. When inflation is low, future US equity returns (green bars) tend to be above the average of all 3-month periods (blue bars), whereas they are below average (purple bars) when inflation is high.
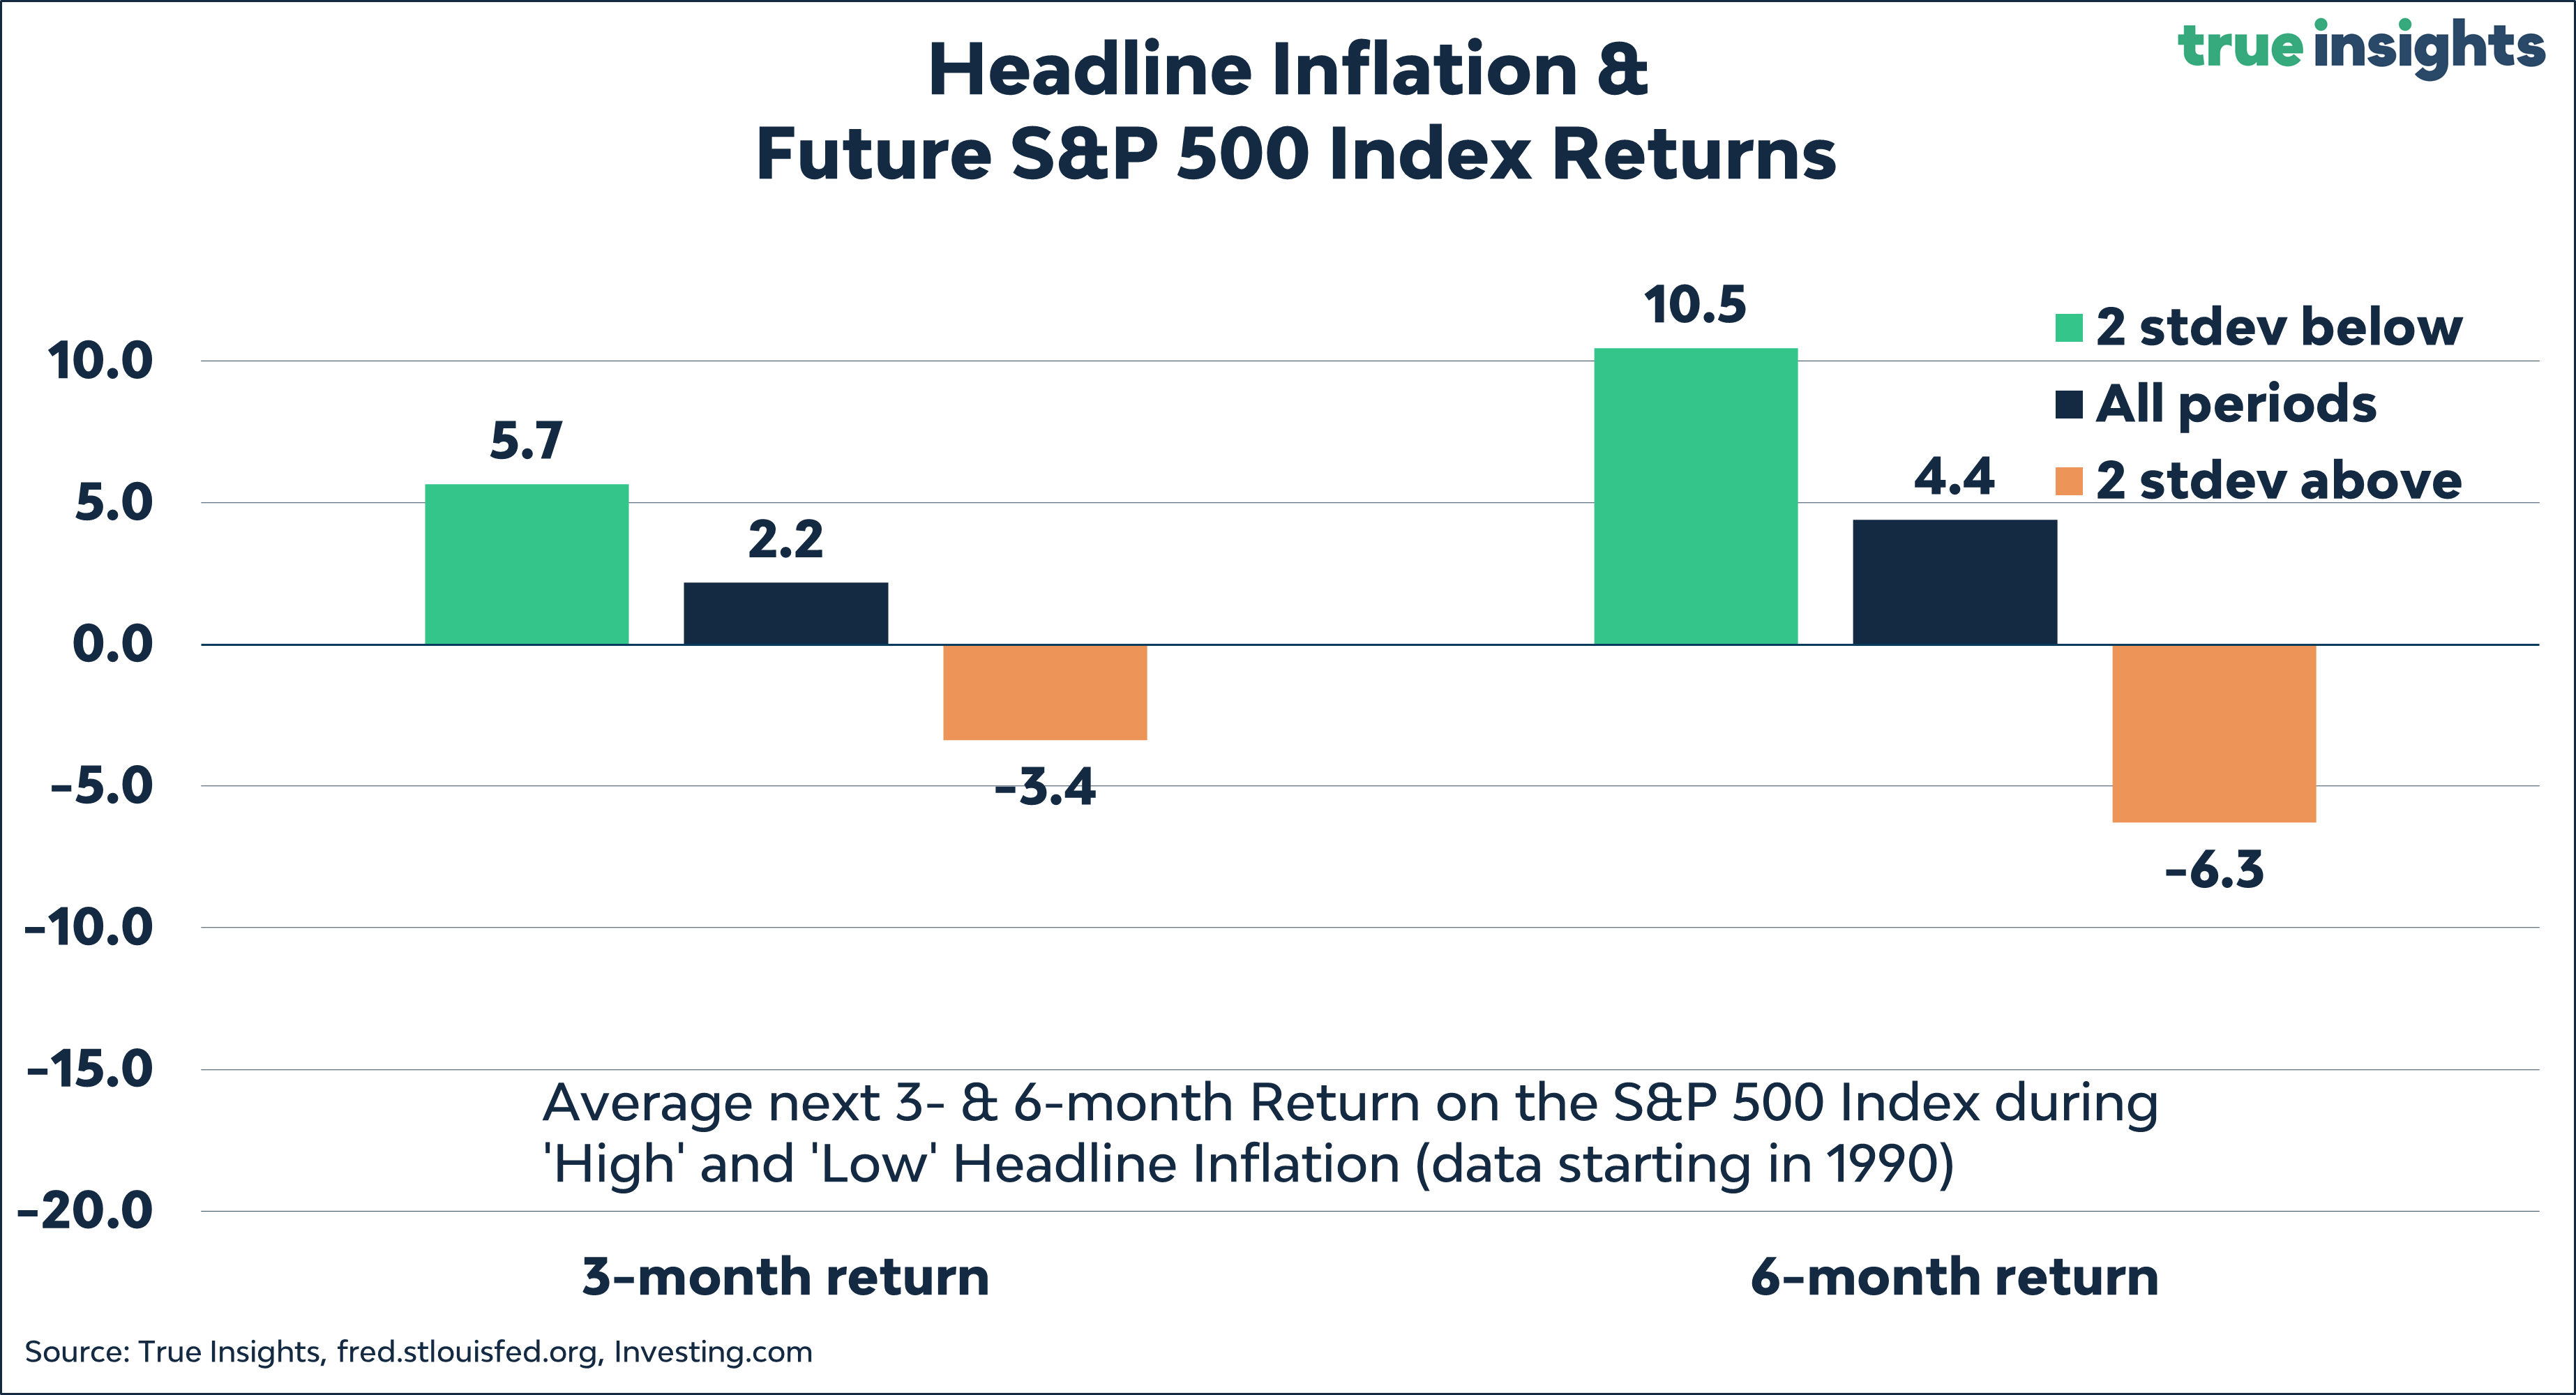
The next chart provides the return data when ‘High’ and ‘Low’ inflation are defined as headline inflation levels two standard deviations above/below the 5-year moving average. The divergence between the two inflation environments widens sharply, with the S&P 500 Index realizing an average return of 10.4% in the six months after inflation is ‘Low’ and -0.7% when inflation is ‘High.’

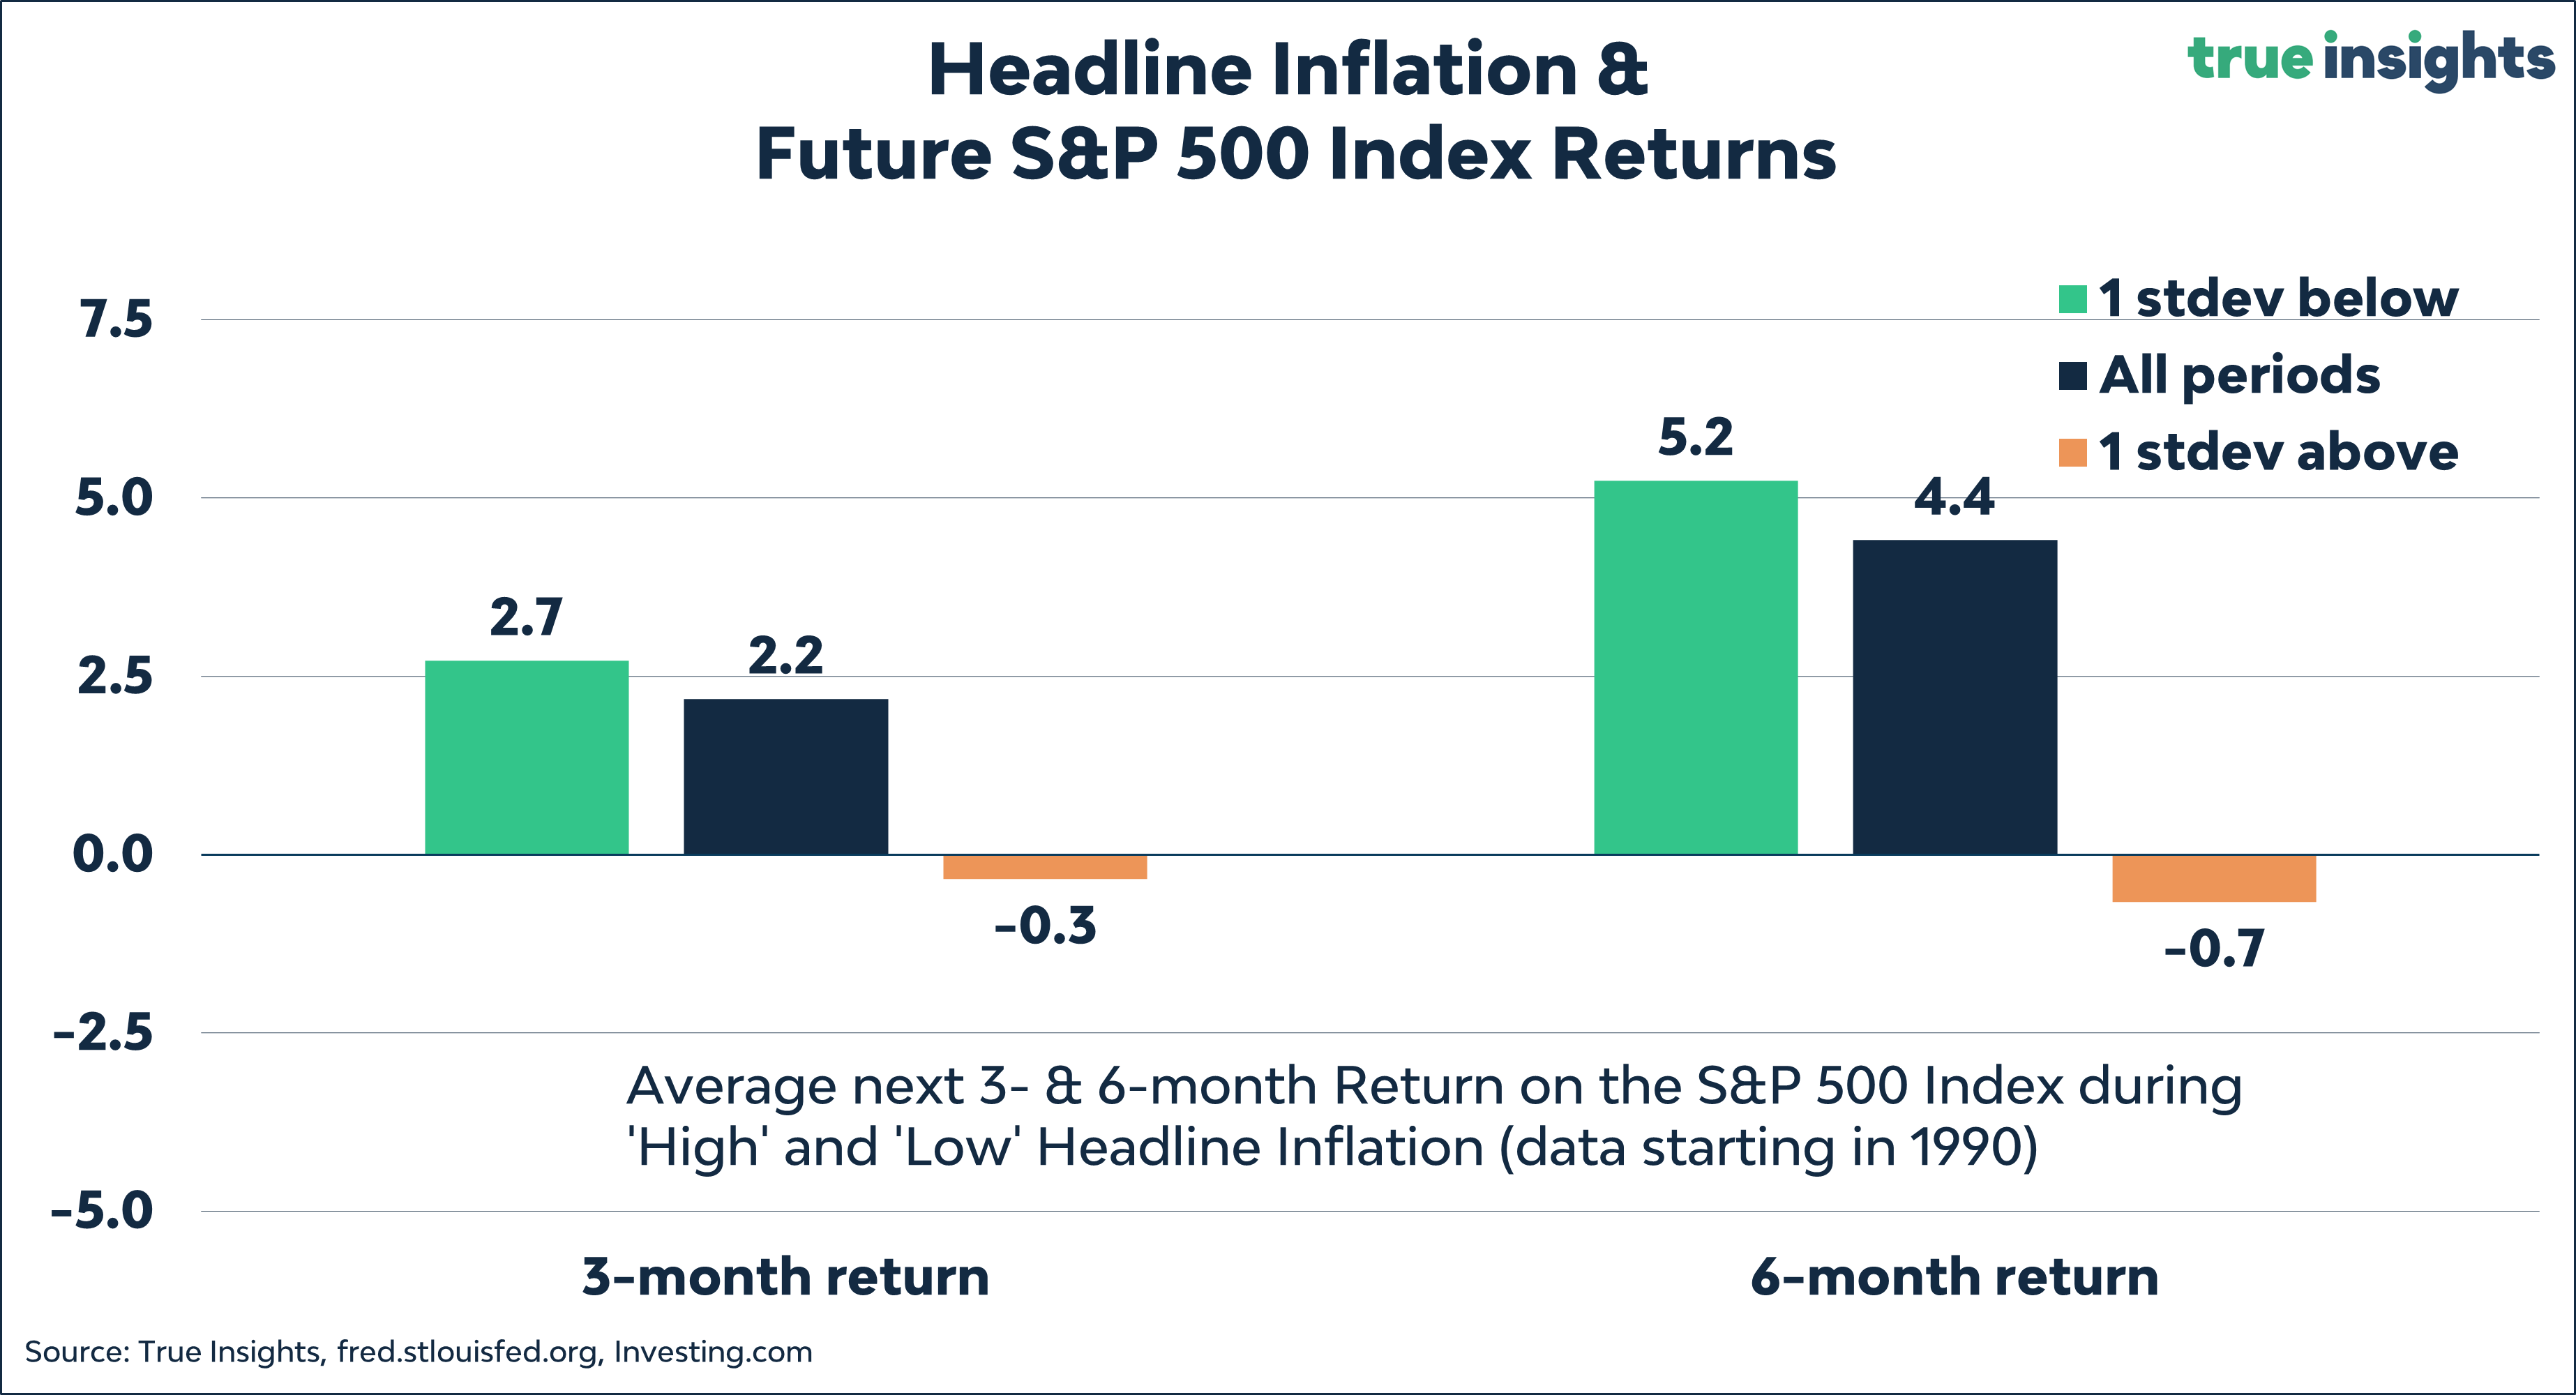
Focusing on the period since 1990, the return differentials become even more pronounced. During this period, future returns on the S&P 500 Index were also negative when inflation was one standard deviation above the 5-year moving average.
Using the two-standard deviation approach to define ‘High’ and ‘Low’ inflation historically resulted in a return gap of nearly 17% (10.5% – -6.3%). US equities have had a strong preference for lowflation environments.
Are we there yet?
The question arises of how far equities are from the inflation sweet spot, where headline CPI has dropped to at least one standard deviation below the 5-year moving average. Given that that threshold lies at 2.7% and March headline CPI came in at 5%, it seems quite a bit. But massive base effects and slower economic growth may imply that prices won’t rise at all in the coming months. Assuming that prices will remain steady, headline inflation will qualify as ‘Low’ when the June numbers are reported in July. But without catalysts to push equity markets higher and the odds of a recession increasing, there will likely be a challenging few months to bridge.