


Expect the ISM Manufacturing to rise to 48, signaling 14% downside for Equities
The regional US Manufacturing PMIs point to an increase of the ISM Manufacturing Index to 48.1 from 46. Yet, this is insufficient to erase the downside attached to the ISM.

Based on the six regional Manufacturing PMIs published before the ISM Manufacturing Index, the latter should have risen from 46 to 48.1 in July. However, the regional PMIs also indicated a level of 48.1 in the previous month, while the ISM Manufacturing Index continued to decline to 46.0.

Furthermore, there is significant dispersion in the regional PMIs, with some indices (Dallas, Kansas) pointing to an even lower ISM Manufacturing, while the volatile Empire State Manufacturing Survey suggests an ISM above 50.

Leading Macro Indicators
Based on a number of leading macro indicators, the scope for an increase in the ISM Manufacturing Index appears limited.
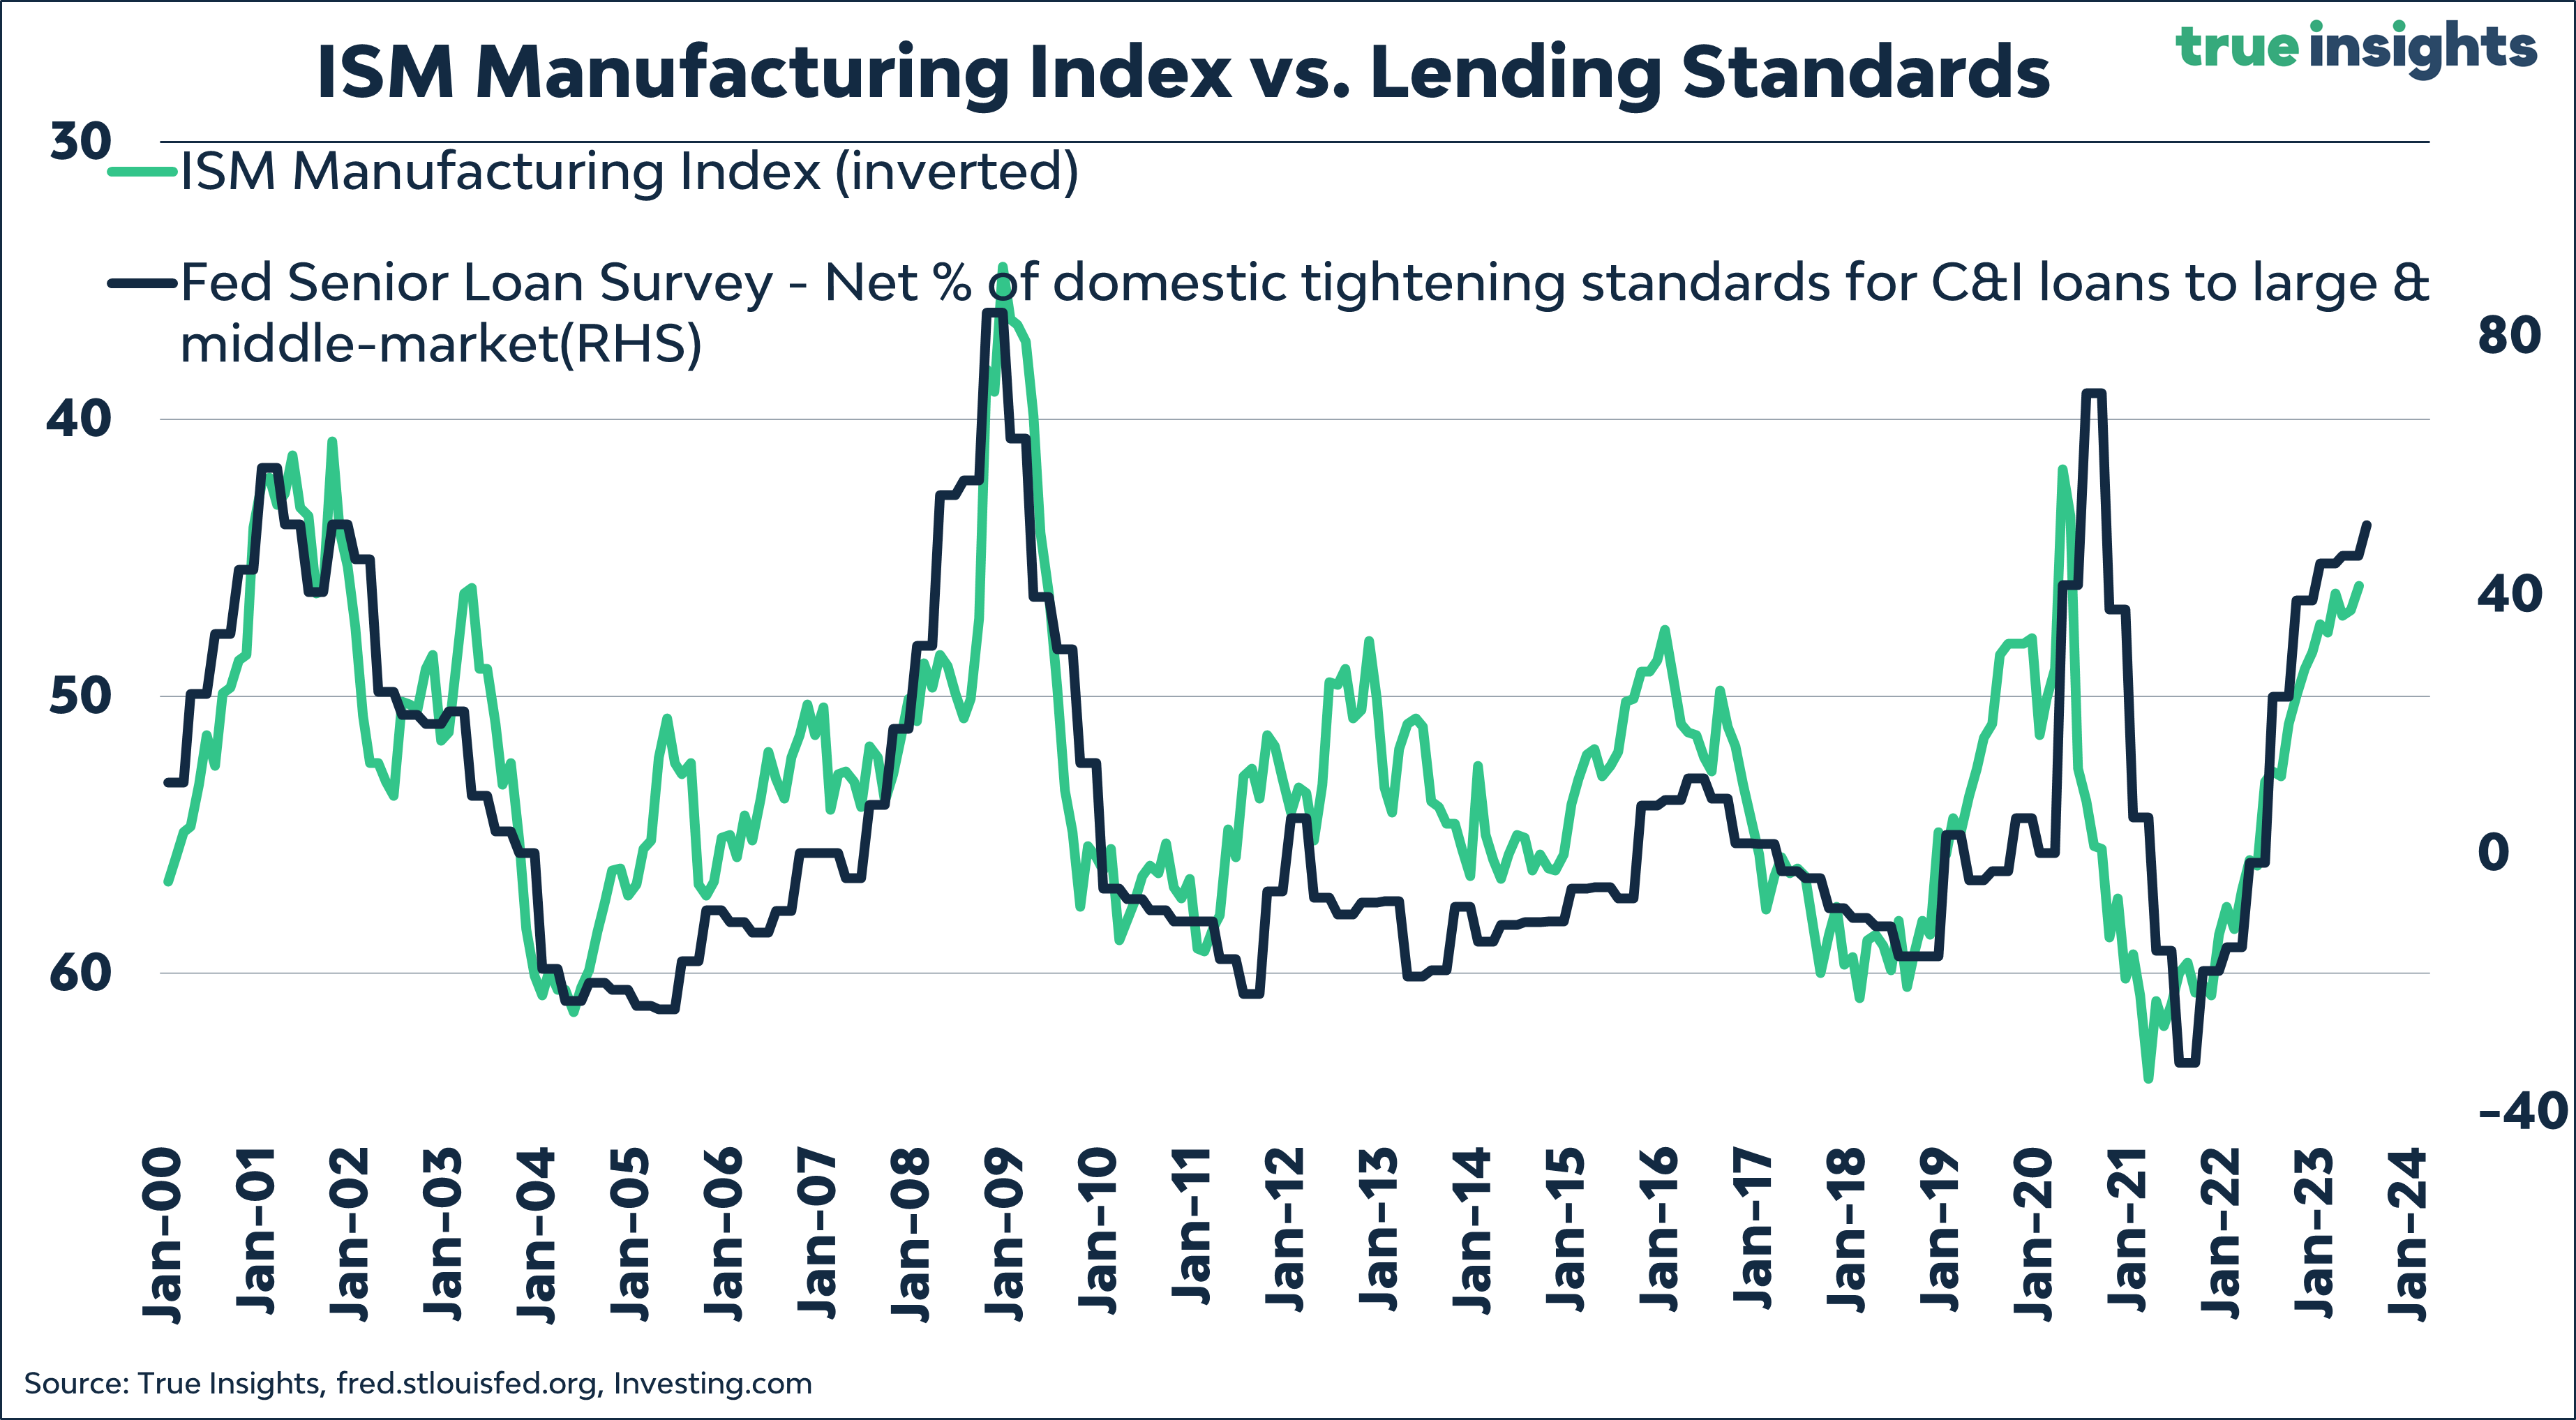
The latest update of the Federal Reserve Senior Loan Officer Opinion Survey (SLOOS) reveals that loan standards have tightened again. As the chart below shows, there is a particularly strong relationship between loan standards and the ISM, and the latest figures indicate a further decline in the latter. More on the SLOOS in our next Insight.
Also, the growth of the money supply indicates that the ISM Manufacturing Index should further decrease. However, it should be noted that this relationship is less strong than with the SLOOS, and it can be assumed that the extreme monetary stimulus post-COVID has amplified the fluctuations in the money supply growth.

Interestingly, the yield curve, which has been negative for a considerable time now, actually suggests an improvement in the ISM Manufacturing from this point onward.

Asset Class Implications
The key conclusion, however, should be that even if the ISM Manufacturing does indeed rise to 48.1 – and continues to rise in the following months – the downside risk for (American) equities remains significant.
The scatter plot below shows the relationship between the ISM Manufacturing and the year-on-year change of the S&P 500 Index. Stocks are up more than 16% compared to a year ago, with a meager ISM reading of 46. This is a striking outlier.

Our fair value estimate for the S&P 500 Index based on the historical relationship with the ISM Manufacturing Index stands at 3,922, which is more than 14% lower than the latest closing price.
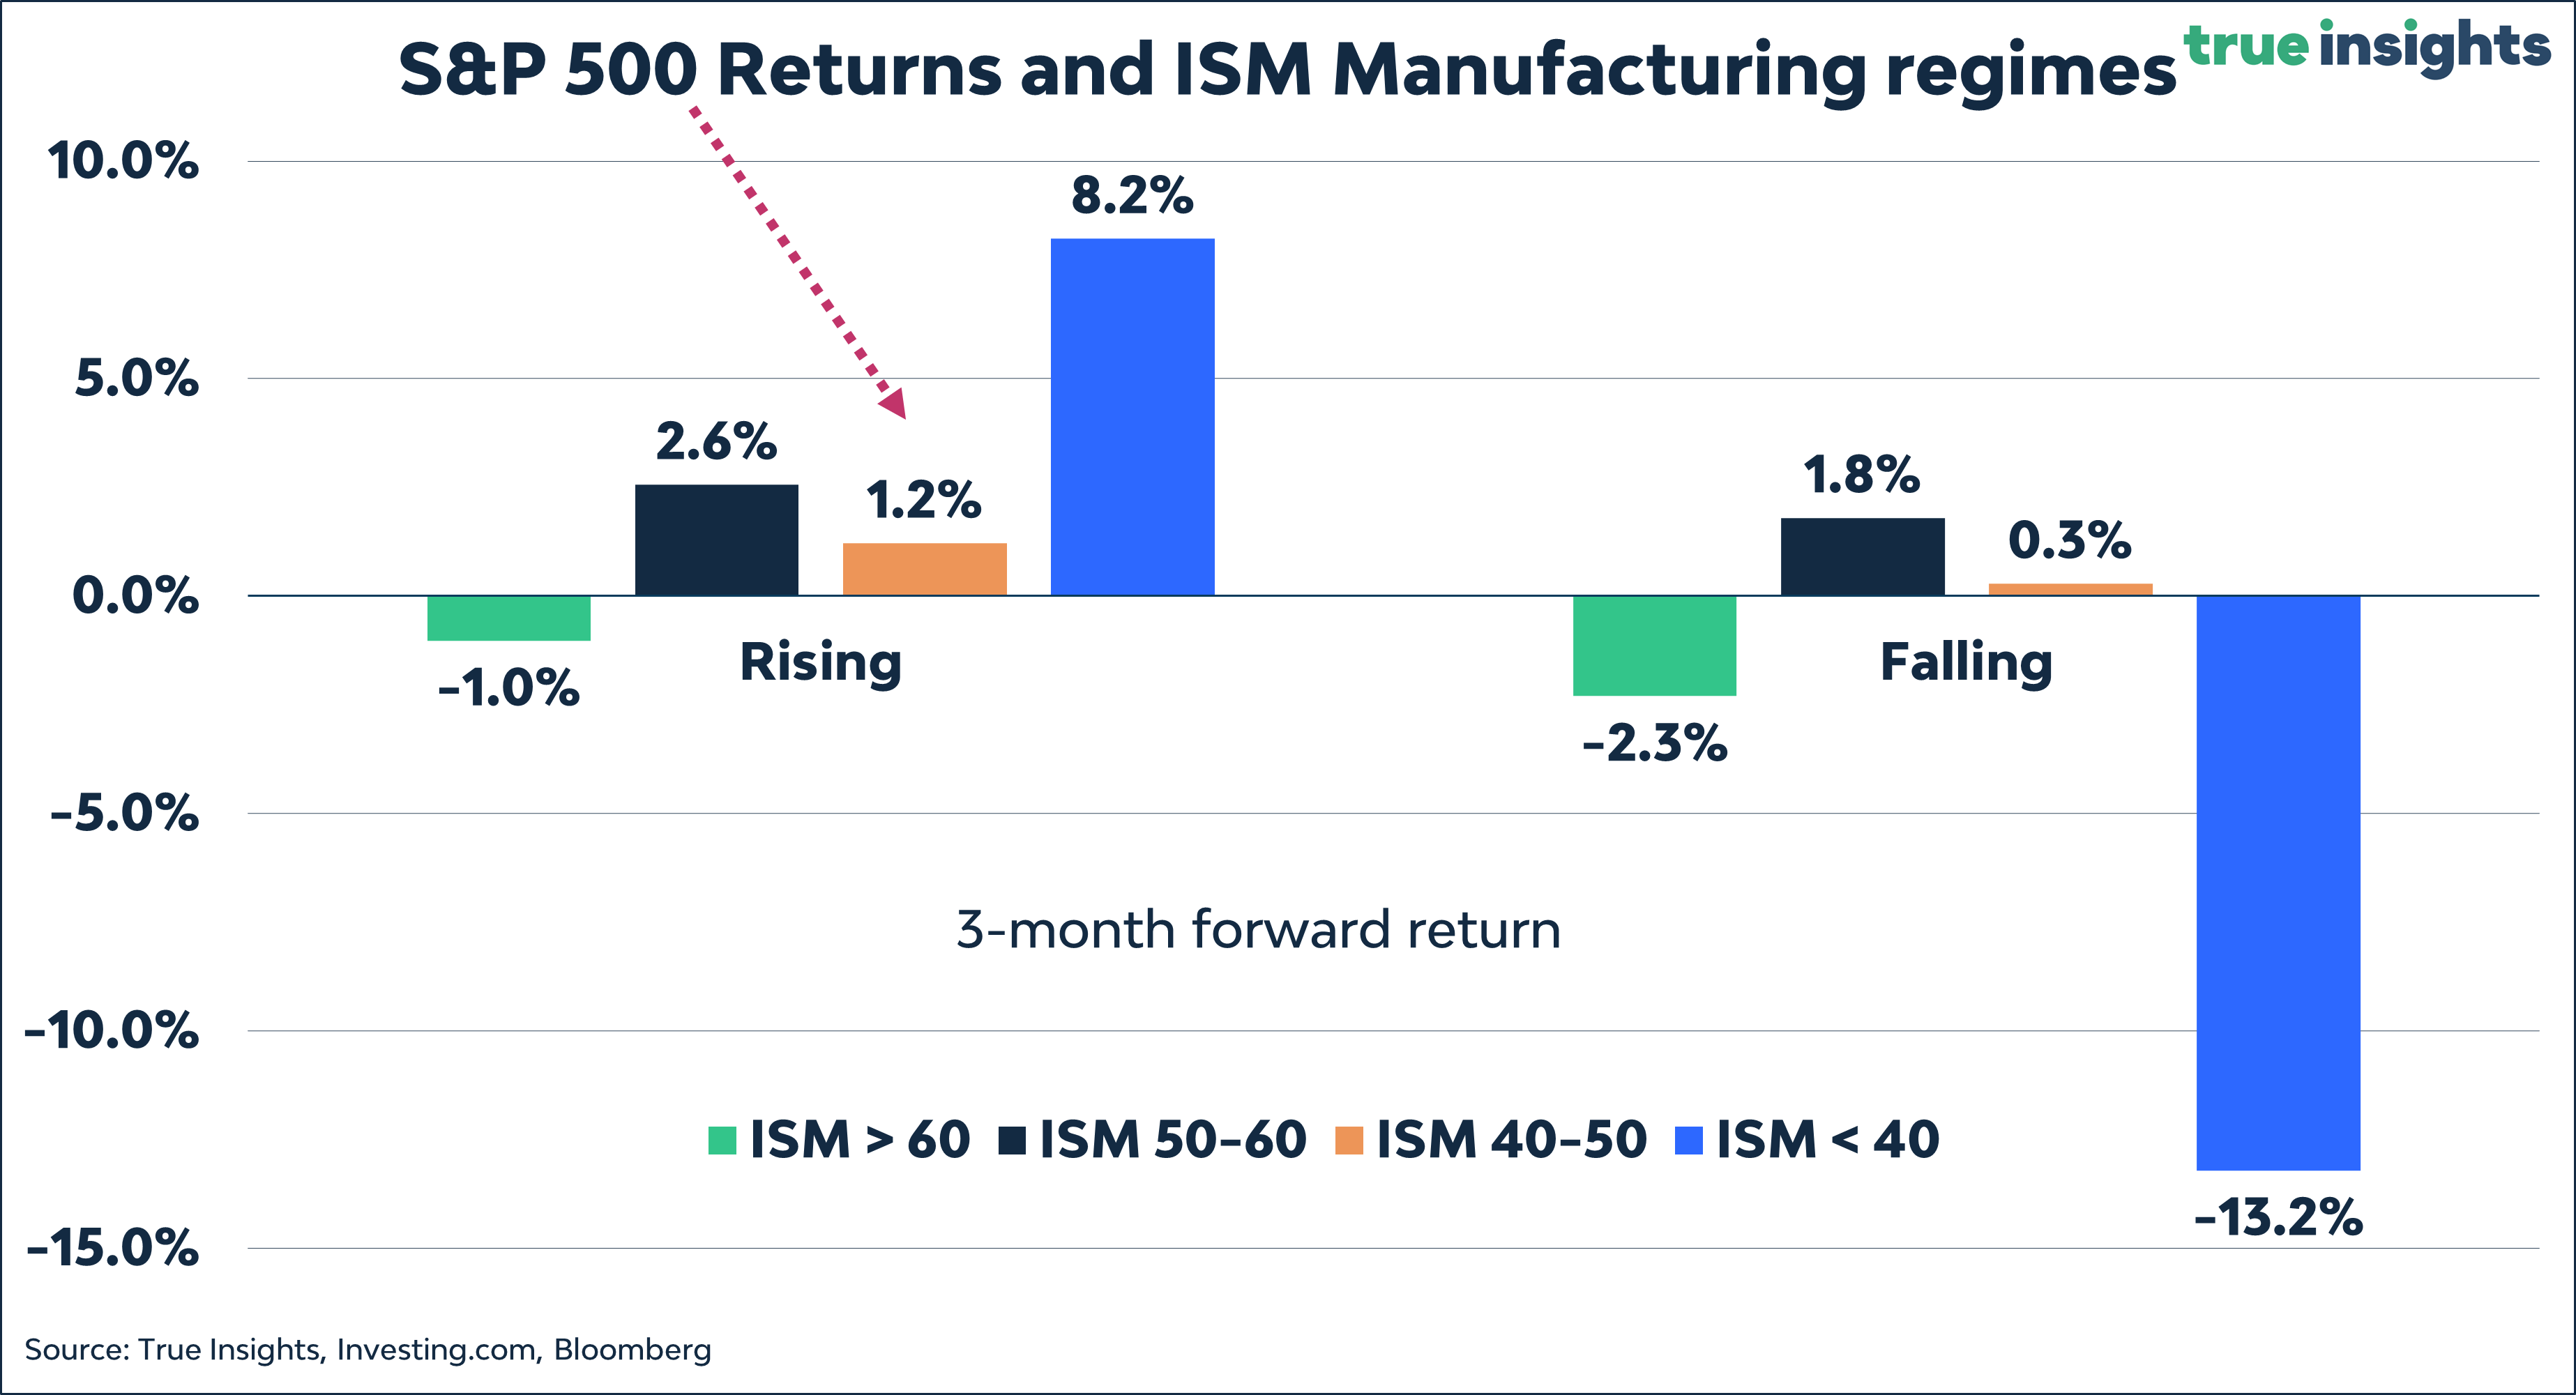
In addition to fair value estimates, we also examine the performance of the S&P 500 Index in various ISM scenarios. Assuming the ISM rises to 48, we are in the scenario of an ISM between 40 and 50 and rising. Historically, the S&P 500 Index achieved a return of 1.2% in the three months that followed, which is below the average.
The ISM Manufacturing Index also provides a clear signal for US Treasuries. To fill the gap in the chart below, interest rates would need to decline significantly. Of course, the tighter policy of the Fed plays a crucial role, but from this perspective, the room for further interest rate increases is limited. This supports our preference for Treasuries now that the Federal Reserve has likely reached the end of its tightening cycle.
