

Is That Recession Coming or Not?
History of the time gap between yield curve inversion and a recession suggests it's too early to write off another economic downturn entirely

First Things First – True Insights Will Come to an End
As I announced earlier this week, True Insights will be coming to an end. While I still derive satisfaction from helping investors interpret the markets and make investment decisions, I must make a choice. With the Blokland Smart Multi-Asset Fund, I believe I have created a unique investment solution that bridges two vastly different worlds: the traditional investment realm with its outdated 60-40 thinking and the alternative investments angle, which attracts investors bracing for the end of the world. Reality lies somewhere in between, and I expect this fund to significantly contribute to future-proof portfolios.
Don’t worry—I’m not going away. In fact, expect more useful content that will be available to everyone. You can find more about my decision and the process going forward here.
Time Factor
Of course, there are always some macro indicators – out of infinitely many – that can support the recession narrative. But I have a much simpler argument that shows we should not outright dismiss the probability of a recession: time. Below is a table showing the number of months between the first inversion of the U.S. yield curve and the recession being confirmed retrospectively by the National Bureau of Economic Research (NBER). To sidestep the (endless) debate over which yield curve is the best indicator, I look at both the 10-year vs. 2-year and the 10-year vs. 3-month yield curves.
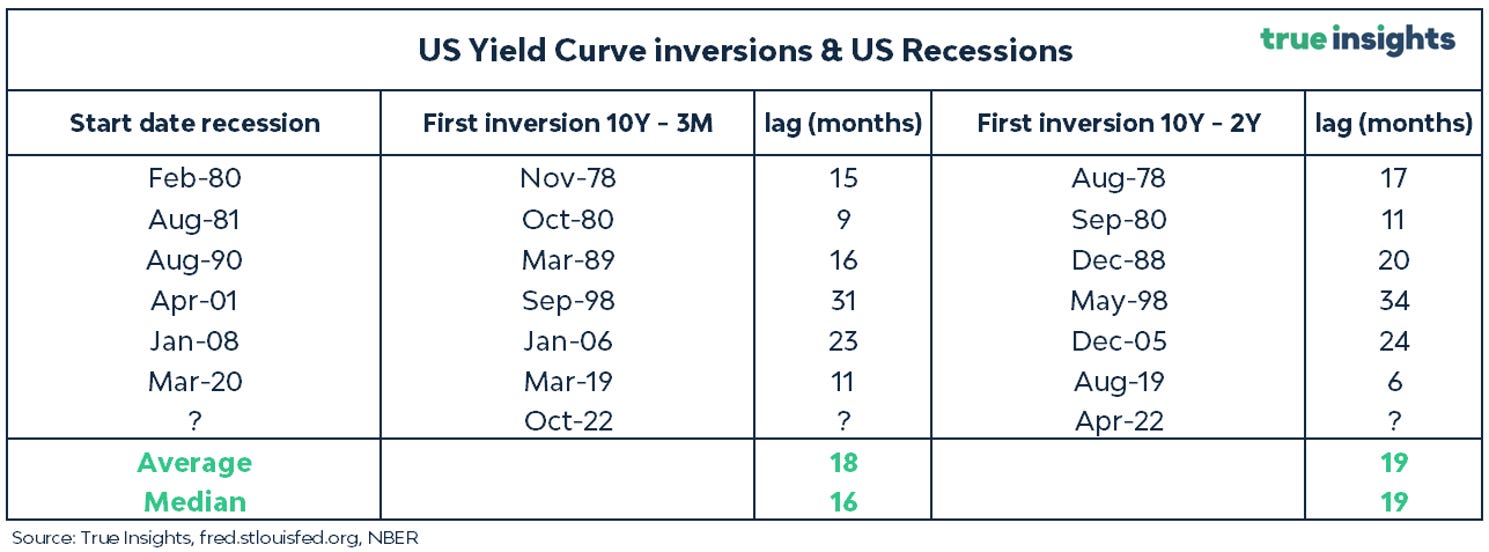
The table reveals that, on average, it took 18 and 19 months, respectively, after the yield curve inversion before a recession occurred. The median times are 16 and 19 months, respectively. Additionally, there are two instances where the recession took significantly longer to materialize.
Still Possible
Translating this to today, we’re about 20 and 26 months past the first inversion for the 10-year vs. 3-month and 10-year vs. 2-year yield curves, respectively. Thus, we are still quite close to the time frames when recessions historically occurred for the 10-year vs. 3-month curve. We are seven months past for the 10-year vs. 2-year curve, but that is not considered extreme.
What Might Trigger the Recession?
In my view, there are two potential triggers for a recession. The first is a significant weakening of the labor market, leading to a decline in consumer spending. Here again, time is a crucial factor. Historically, it takes an average of two years after the start of a tightening cycle by the Federal Reserve. It’s been just over two years, and unemployment is gradually rising.
The second reason could be a ‘credit event.’ It wouldn’t be the first time rapidly rising interest rates broke something. Currently, American regional banks appear to have been this episode’s example, but there could still be a skeleton in the closet from the commercial real estate sector.
Performance
Finally, here are some more important numbers. As discussed above, we may be in the period between yield curve inversion and a new recession. What does this mean for returns on different asset classes?
Refer to the table below. Notably, both the average and median returns across all asset classes and US GDP are positive. However, the variation in gold and commodities is so great that it’s hard to draw solid conclusions.
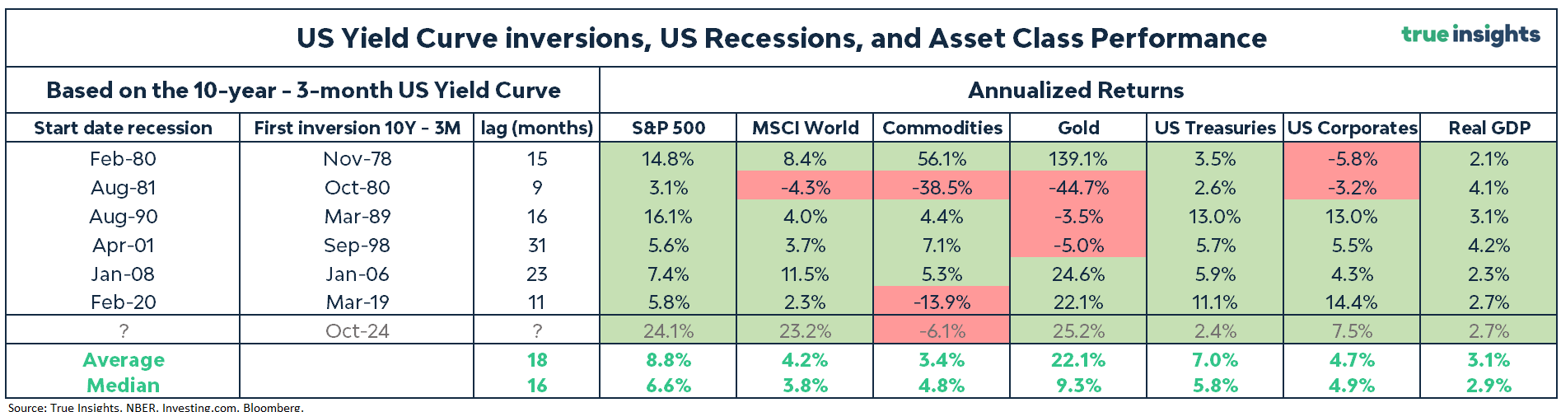
For completeness, I have also added the annualized returns since the 10-year vs. 3-month yield curve inversion in 2022. Stocks have risen much more sharply than in the past, while US Treasuries have underperformed, even though returns since October 2022 are positive. This might indicate that the markets have already anticipated that a recession will NOT occur.