


ISM down, Rates up, Valuation ballooning; What could go wrong?
The AI Boom remains real, but so is deteriorating Macro, extreme SKEW, the MOVE-VIX divergence, and lofty Big Tech valuation.

Welcome to the weekly Market Monitor, keeping you updated on the week’s most important charts and developments in financial markets. This week we will talk about the ISM Manufacturing and its impact on asset class returns, US labor market strength, five incoming macro data points signaling a sharp decline in inflation, the China chart nobody is watching, our Fear & Frenzy Sentiment Index and the extreme level of the SKEW index, how to determine market bubbles, the divergence in the MOVE and VIX indices, Big Tech and AI valuation, and more.
Stories
MACRO
Signaling trouble?
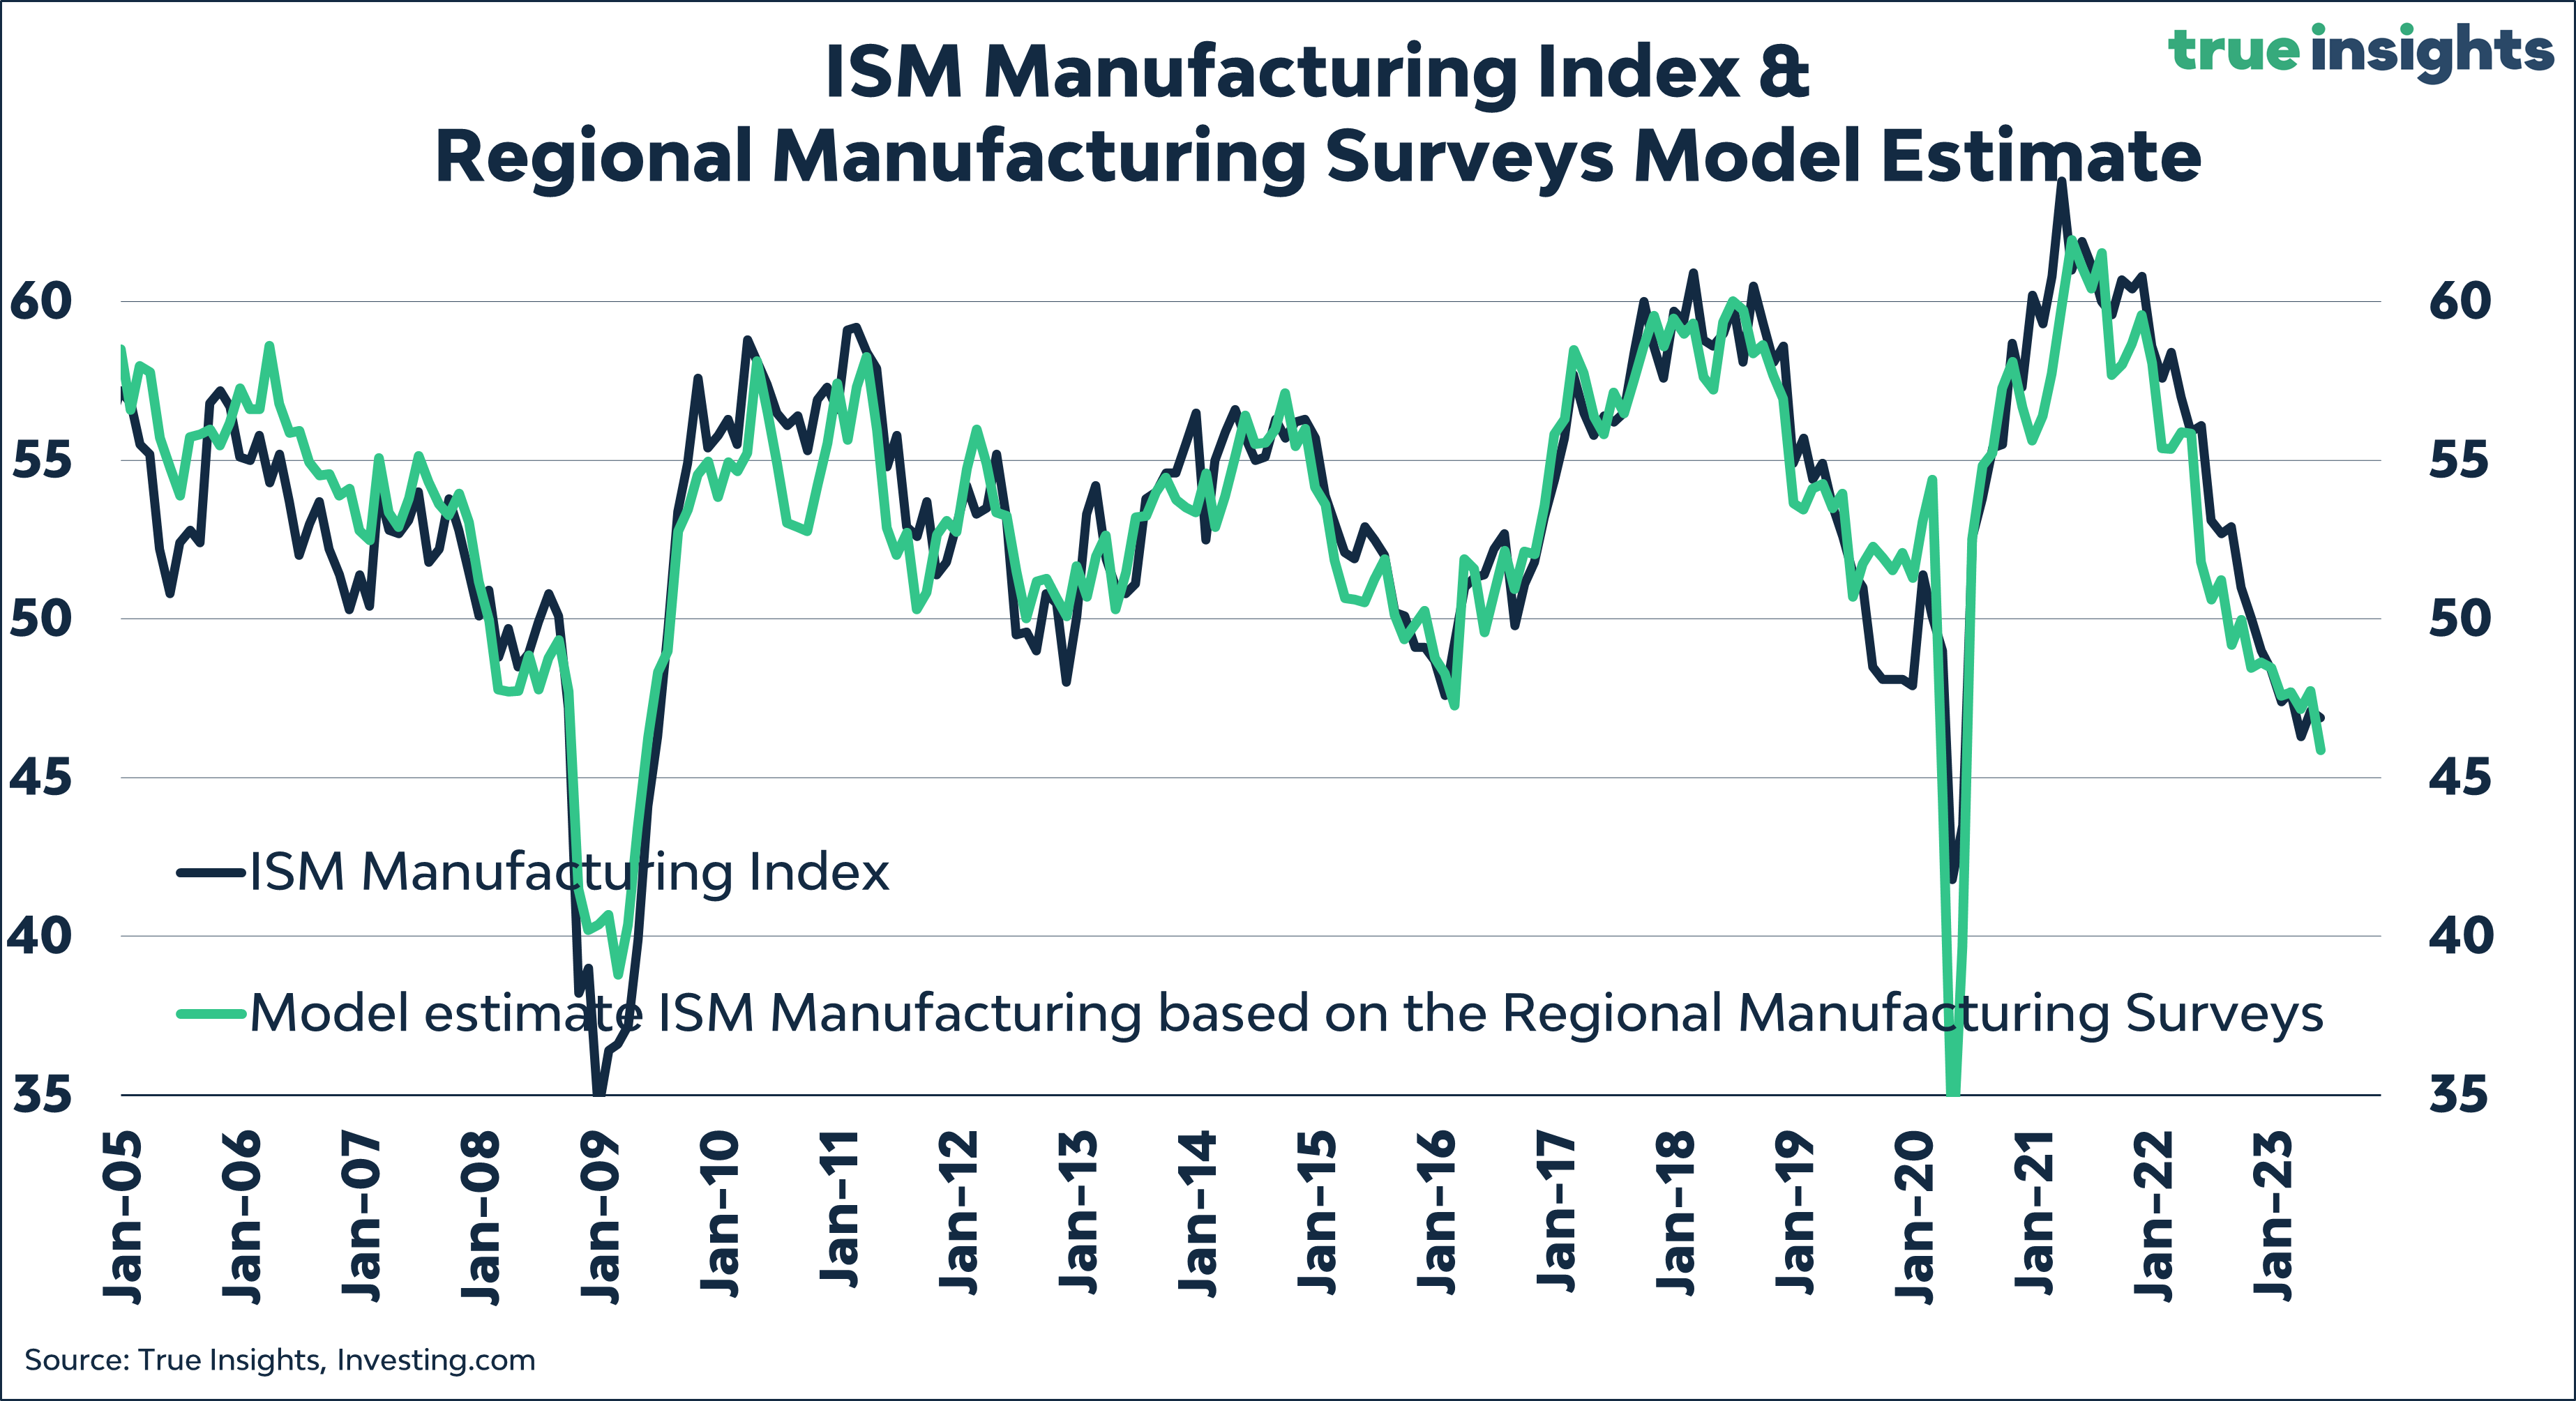
The ISM Manufacturing Index, a crucial measure within our Macro, Sentiment, and Valuation investment framework, dipped to 46.9 in May, modestly underperforming expectations. Our prediction, formulated from the six regional Manufacturing PMIs, stood at 45.9.
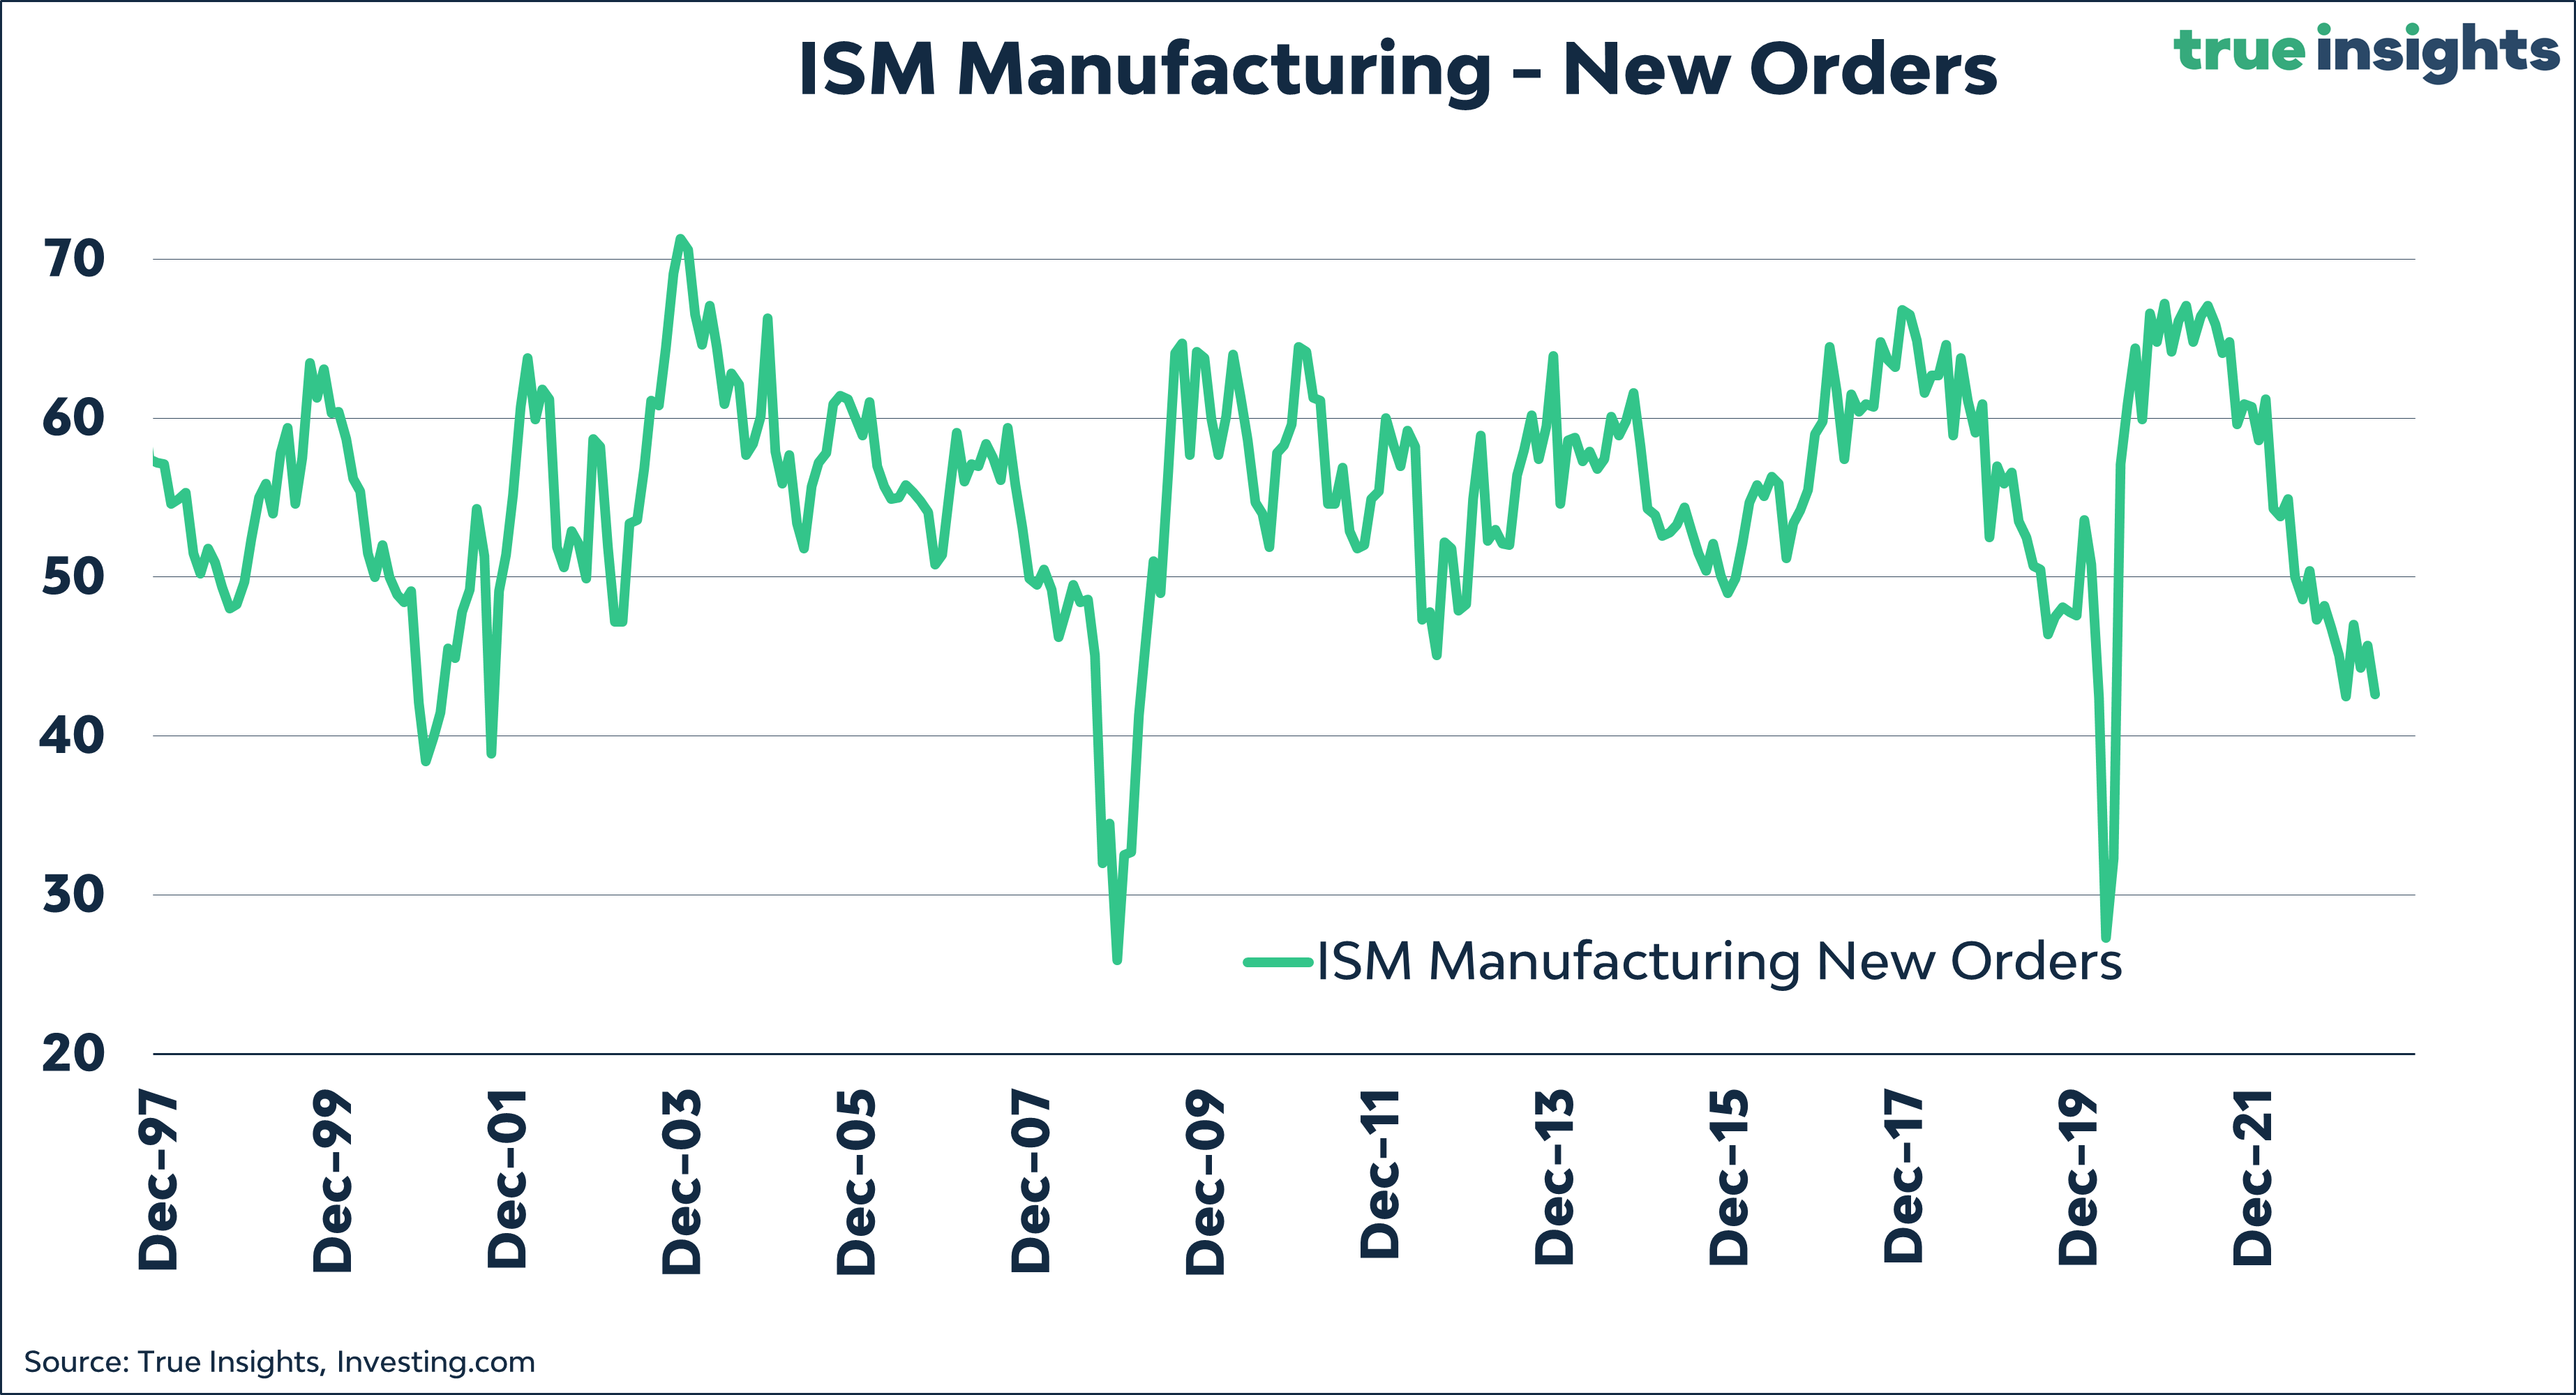
The underlying ISM data revealed a noticeable deterioration. The New Orders Index plunged to 42.6, precariously nearing full-scale recessionary levels, although we haven’t quite arrived there yet.
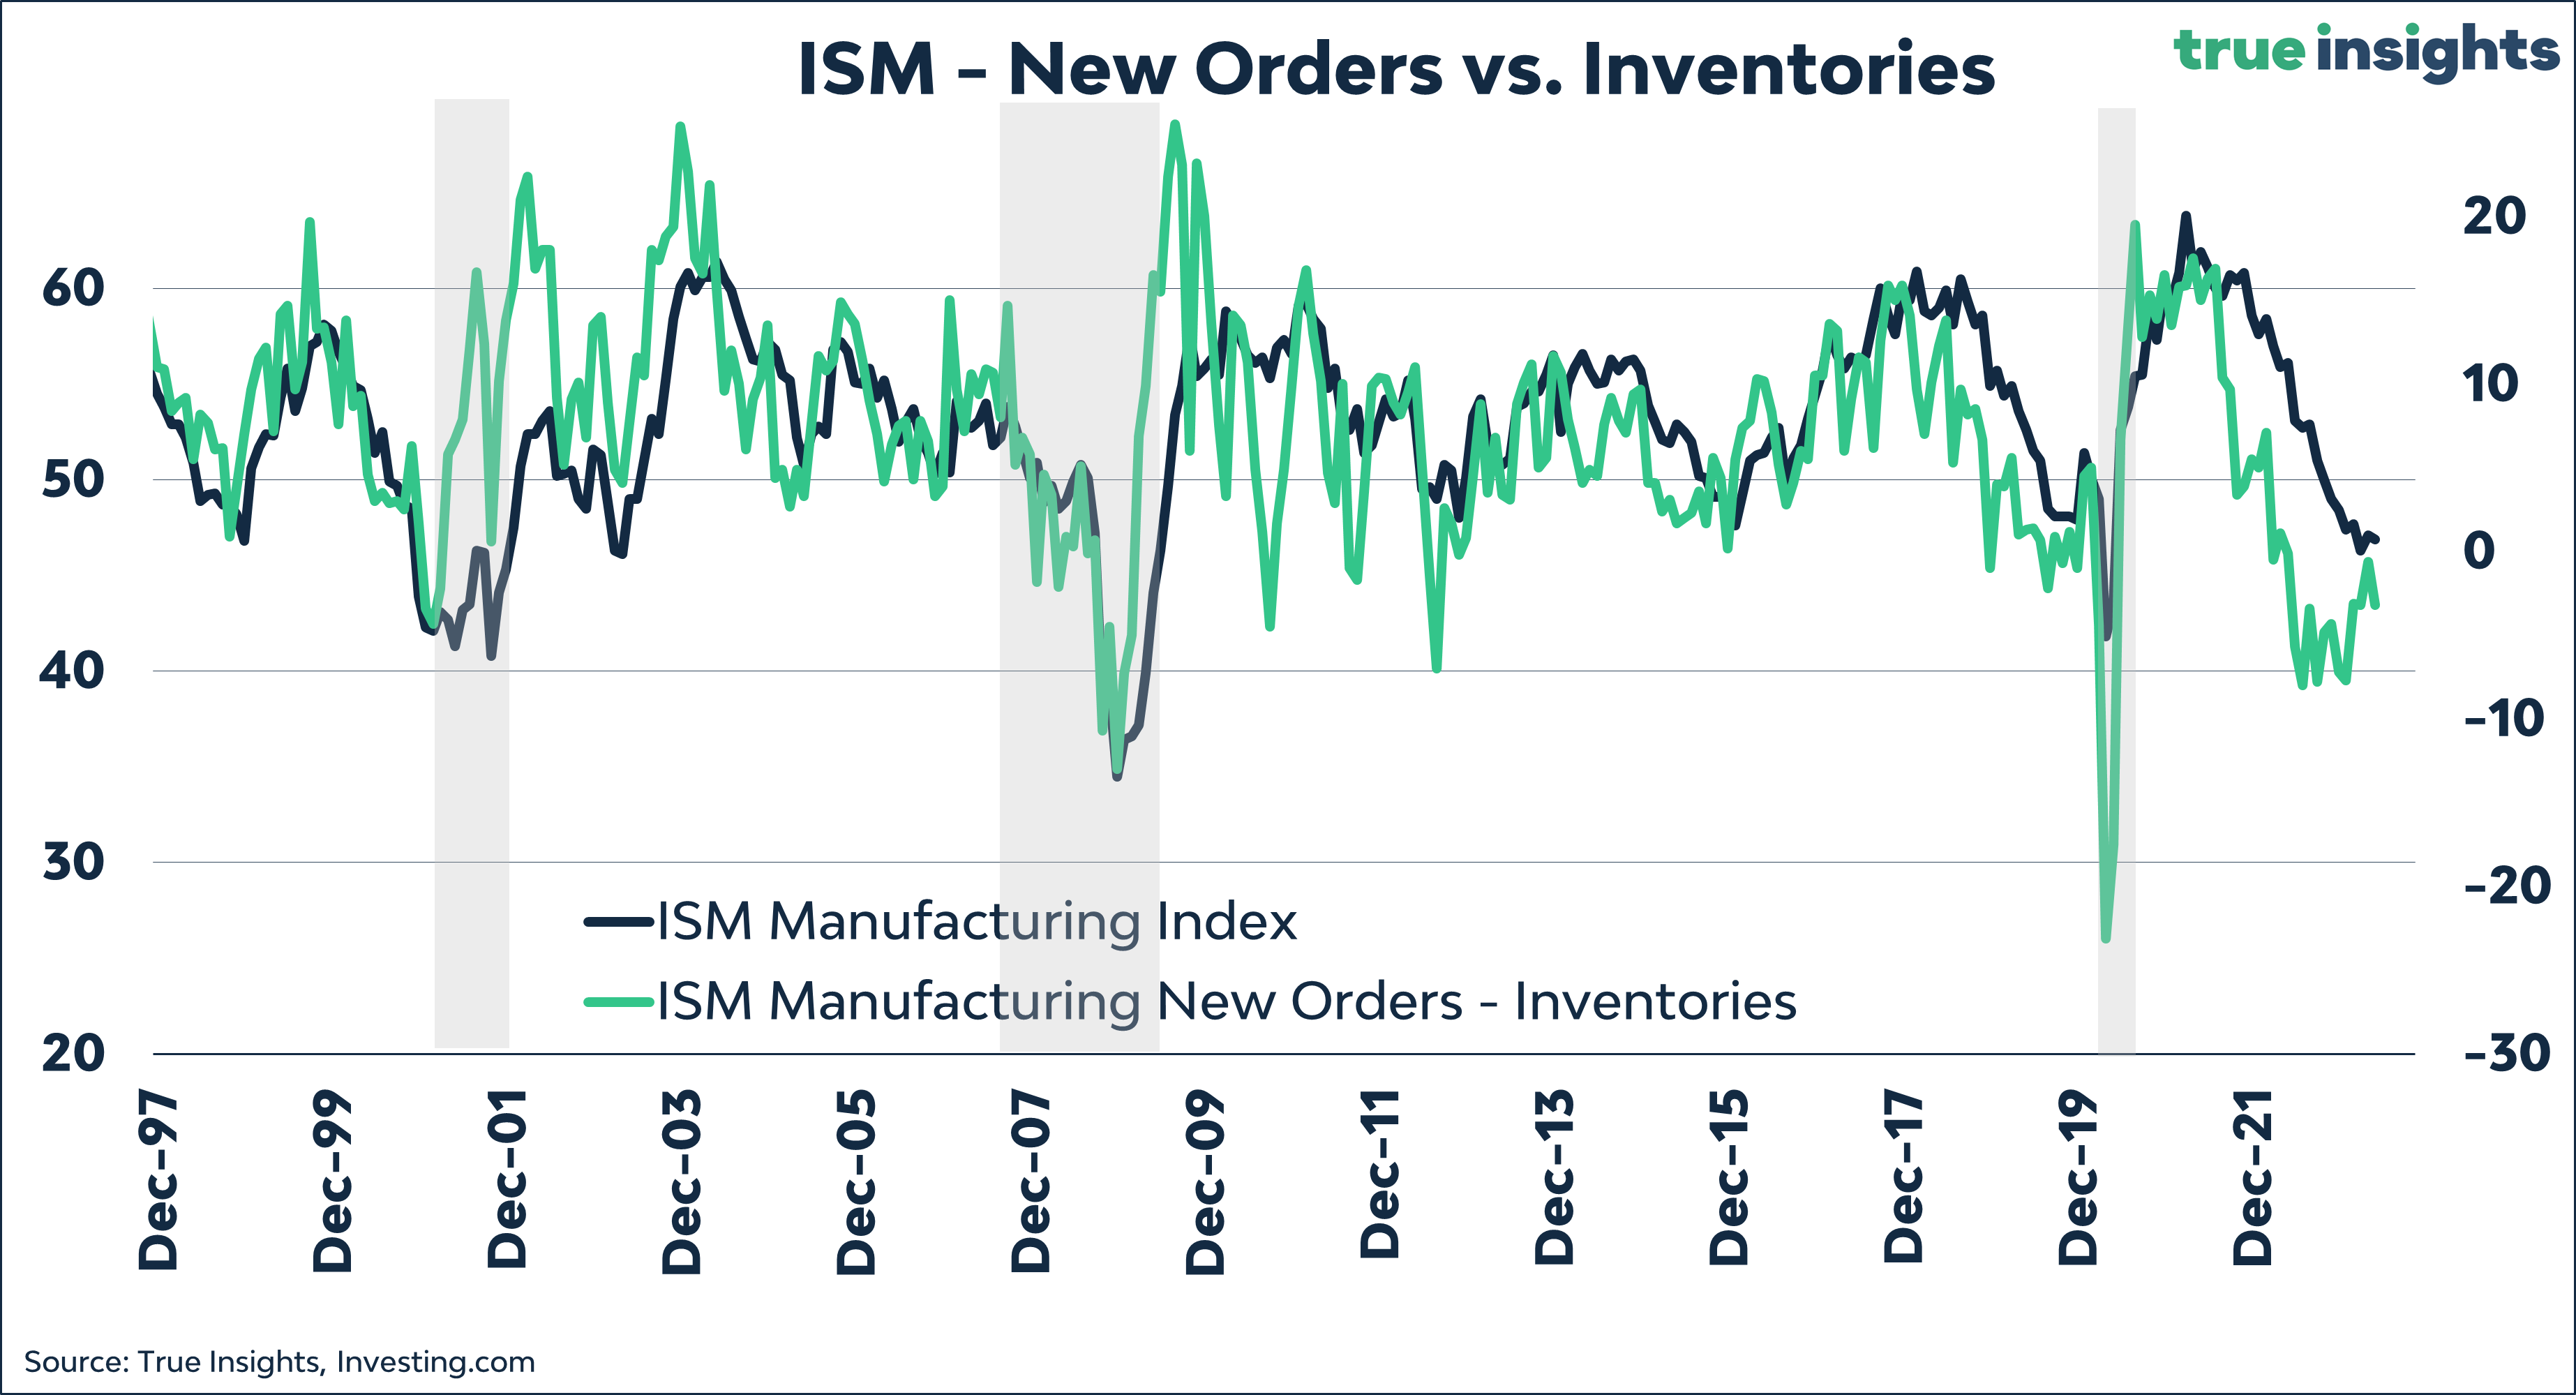
The gap between the ISM New Orders Index, where an increase implies faster GDP growth, and the ISM Inventories Index, where an increase means reduced GDP growth, widened compared to April.
Additional data underscore the challenging balancing act confronting the Federal Reserve ahead of the forthcoming FOMC meeting on June 14. The ISM Prices Paid Index plunged to 44.2, hinting at a rapid dissipation of inflationary pressures.
By contrast, the ISM Employment Index climbed to 51.4, indicative of sustained strength in the US labor market, which will be discussed below.
Connecting the Dots – Asset Class Returns
After the latest ISM Manufacturing number, the downside risk for US, Developed Market, and Emerging Market Equities persists. This is especially the case for USD-denominated indices. If the ISM remains at its present level for the next two months, a decline of 9% looms over the S&P 500 Index, should the historical relationship between the two variables hold. While the recent underperformance of Chinese stocks has slightly improved the return outlook for Emerging Market Equities, a recovery of the ISM Manufacturing Index to 50 or higher is required to generate more broad-based upside.
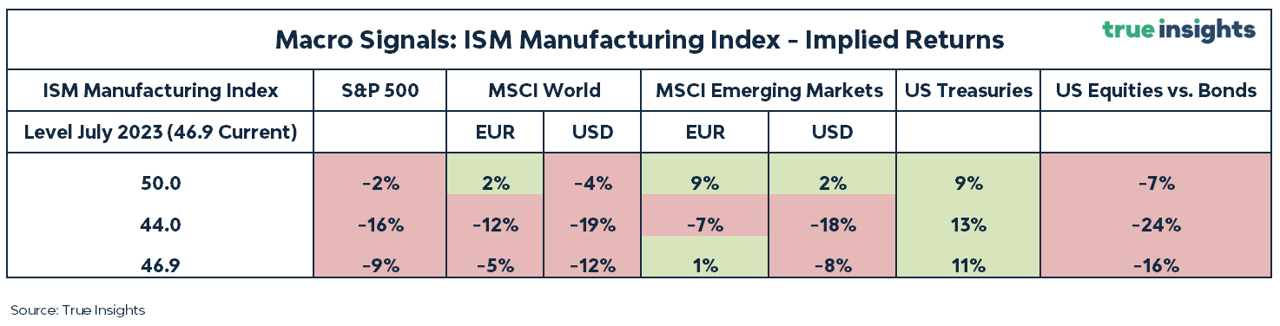
As the table above reveals, our ISM Manufacturing model continues to favor US Treasuries over US Equities.
Too hot to skip?
Regarding the US labor market, Fed Chairman Powell just can’t catch a break. All three reported labor market indicators this week exceeded expectations.
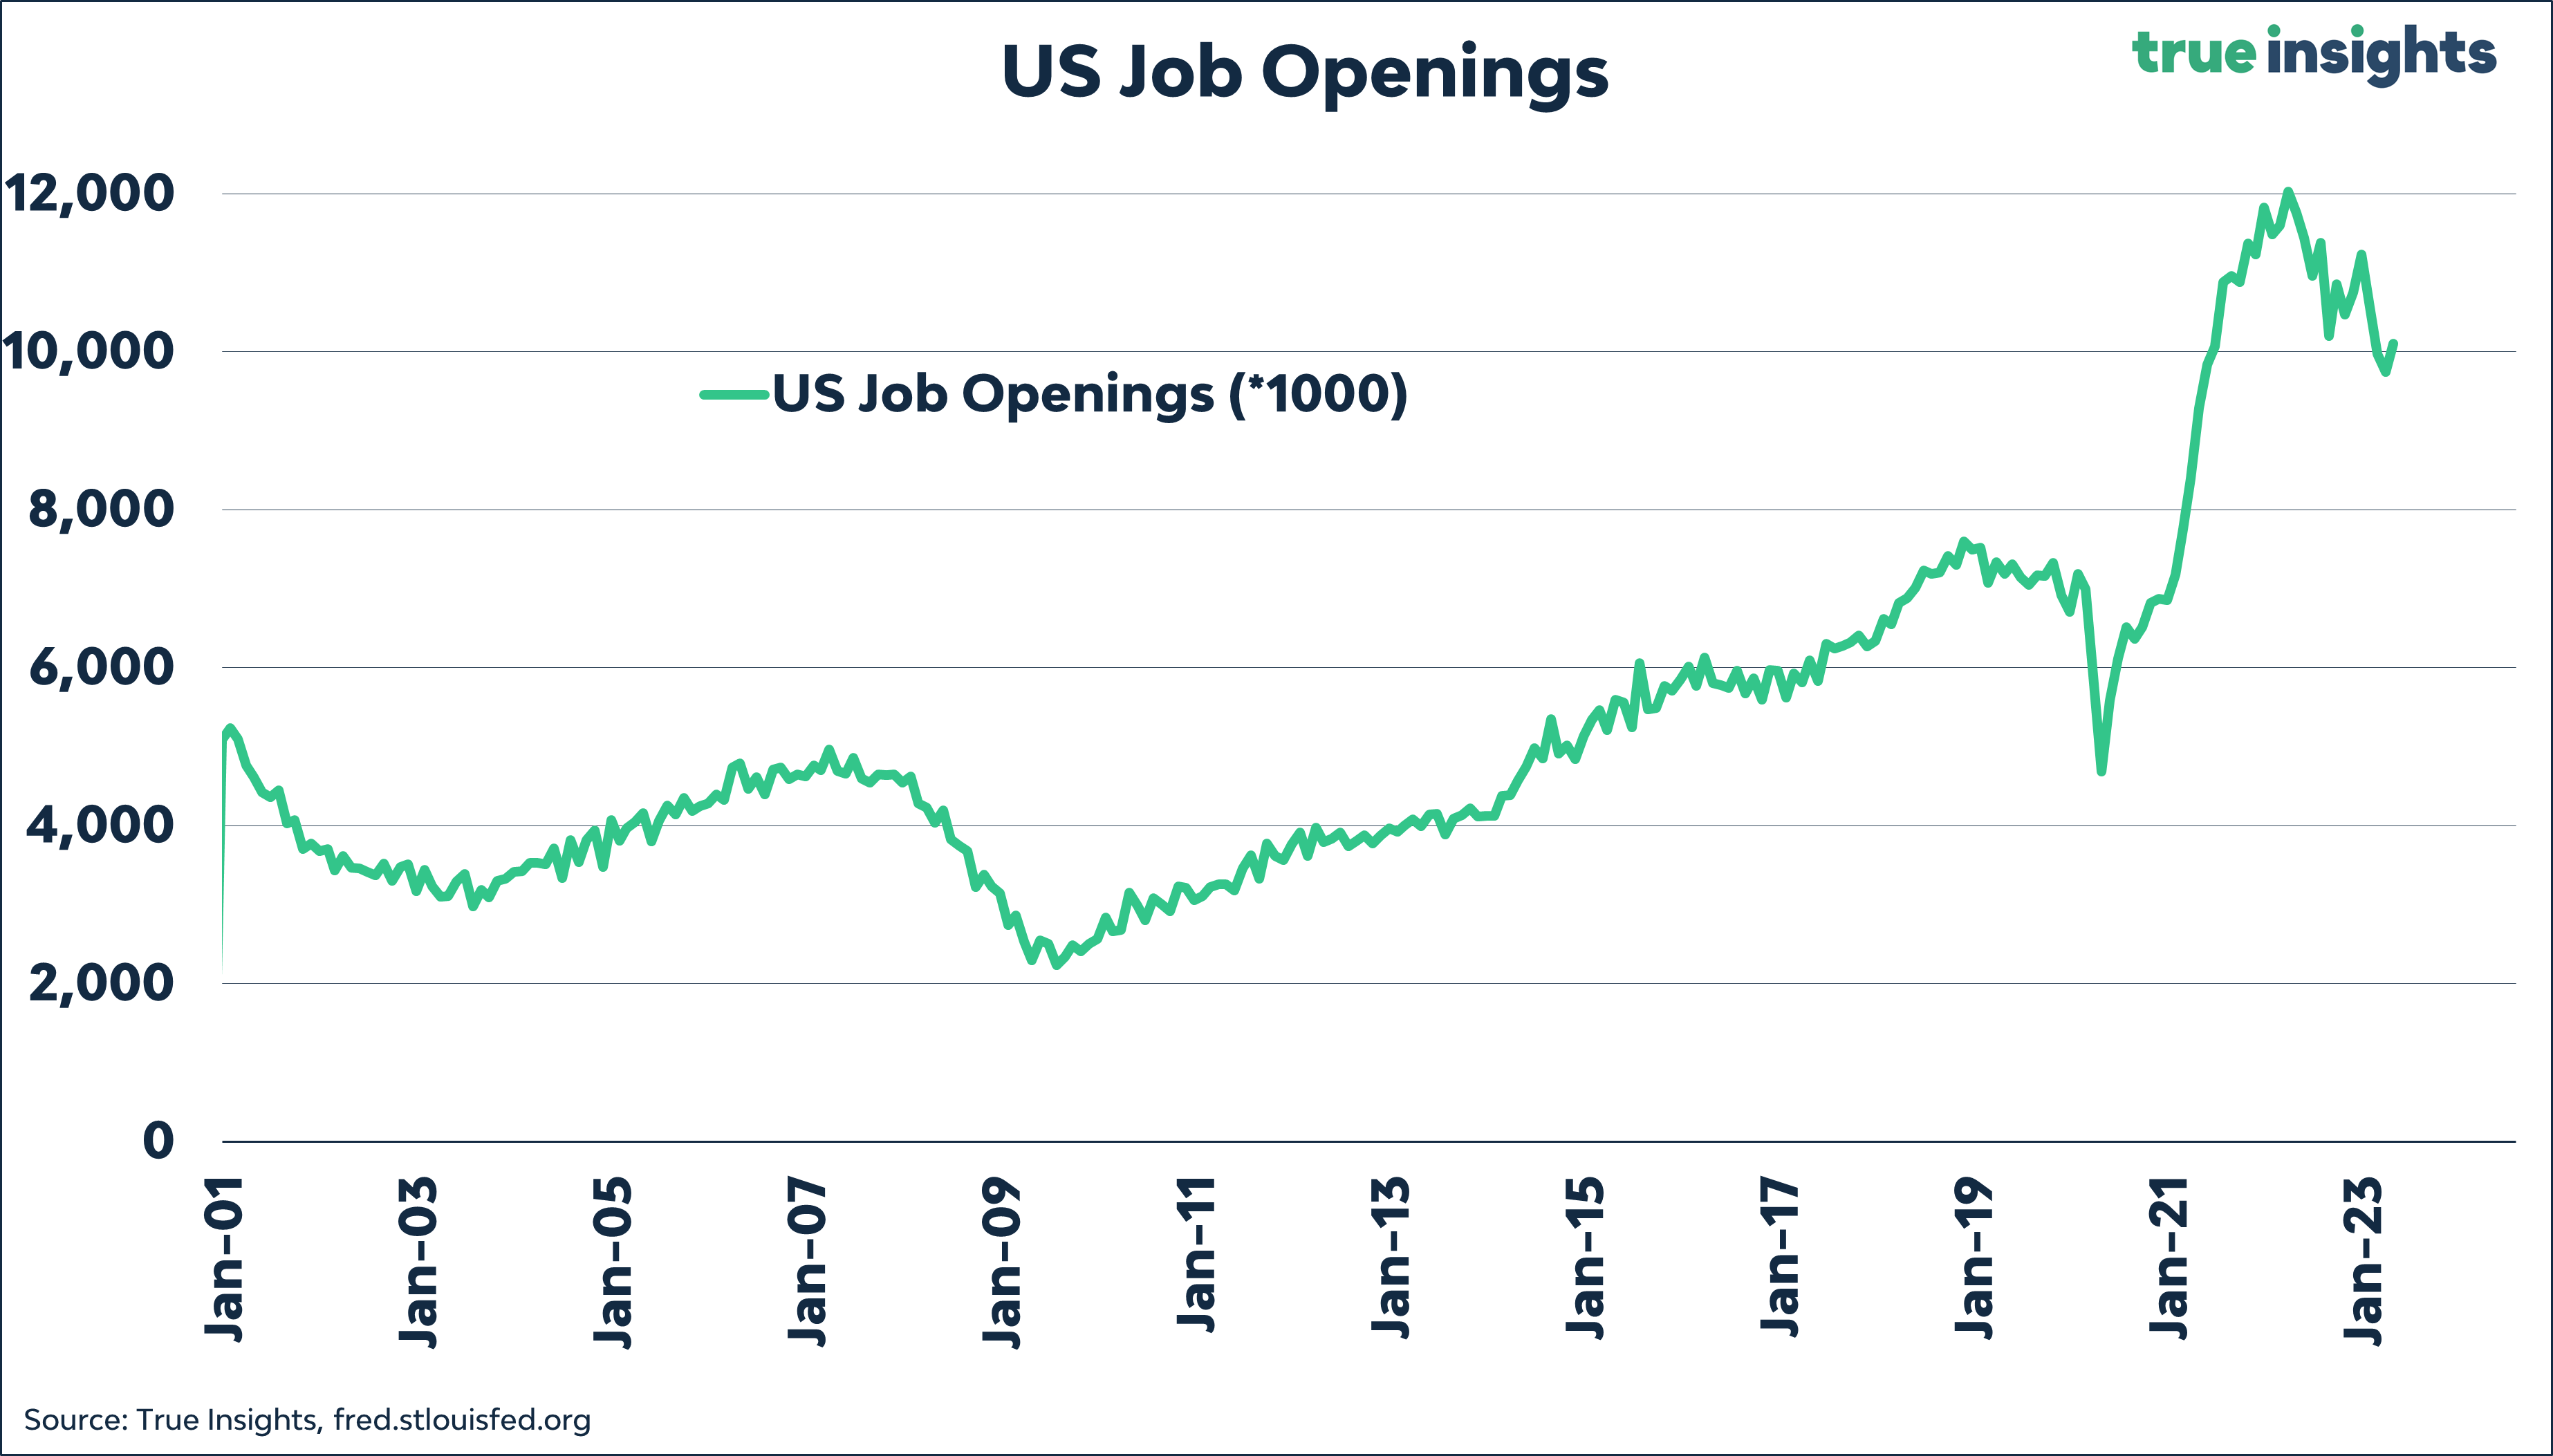
After a significant decline in recent months, the number of job openings spiked to above ten million again.
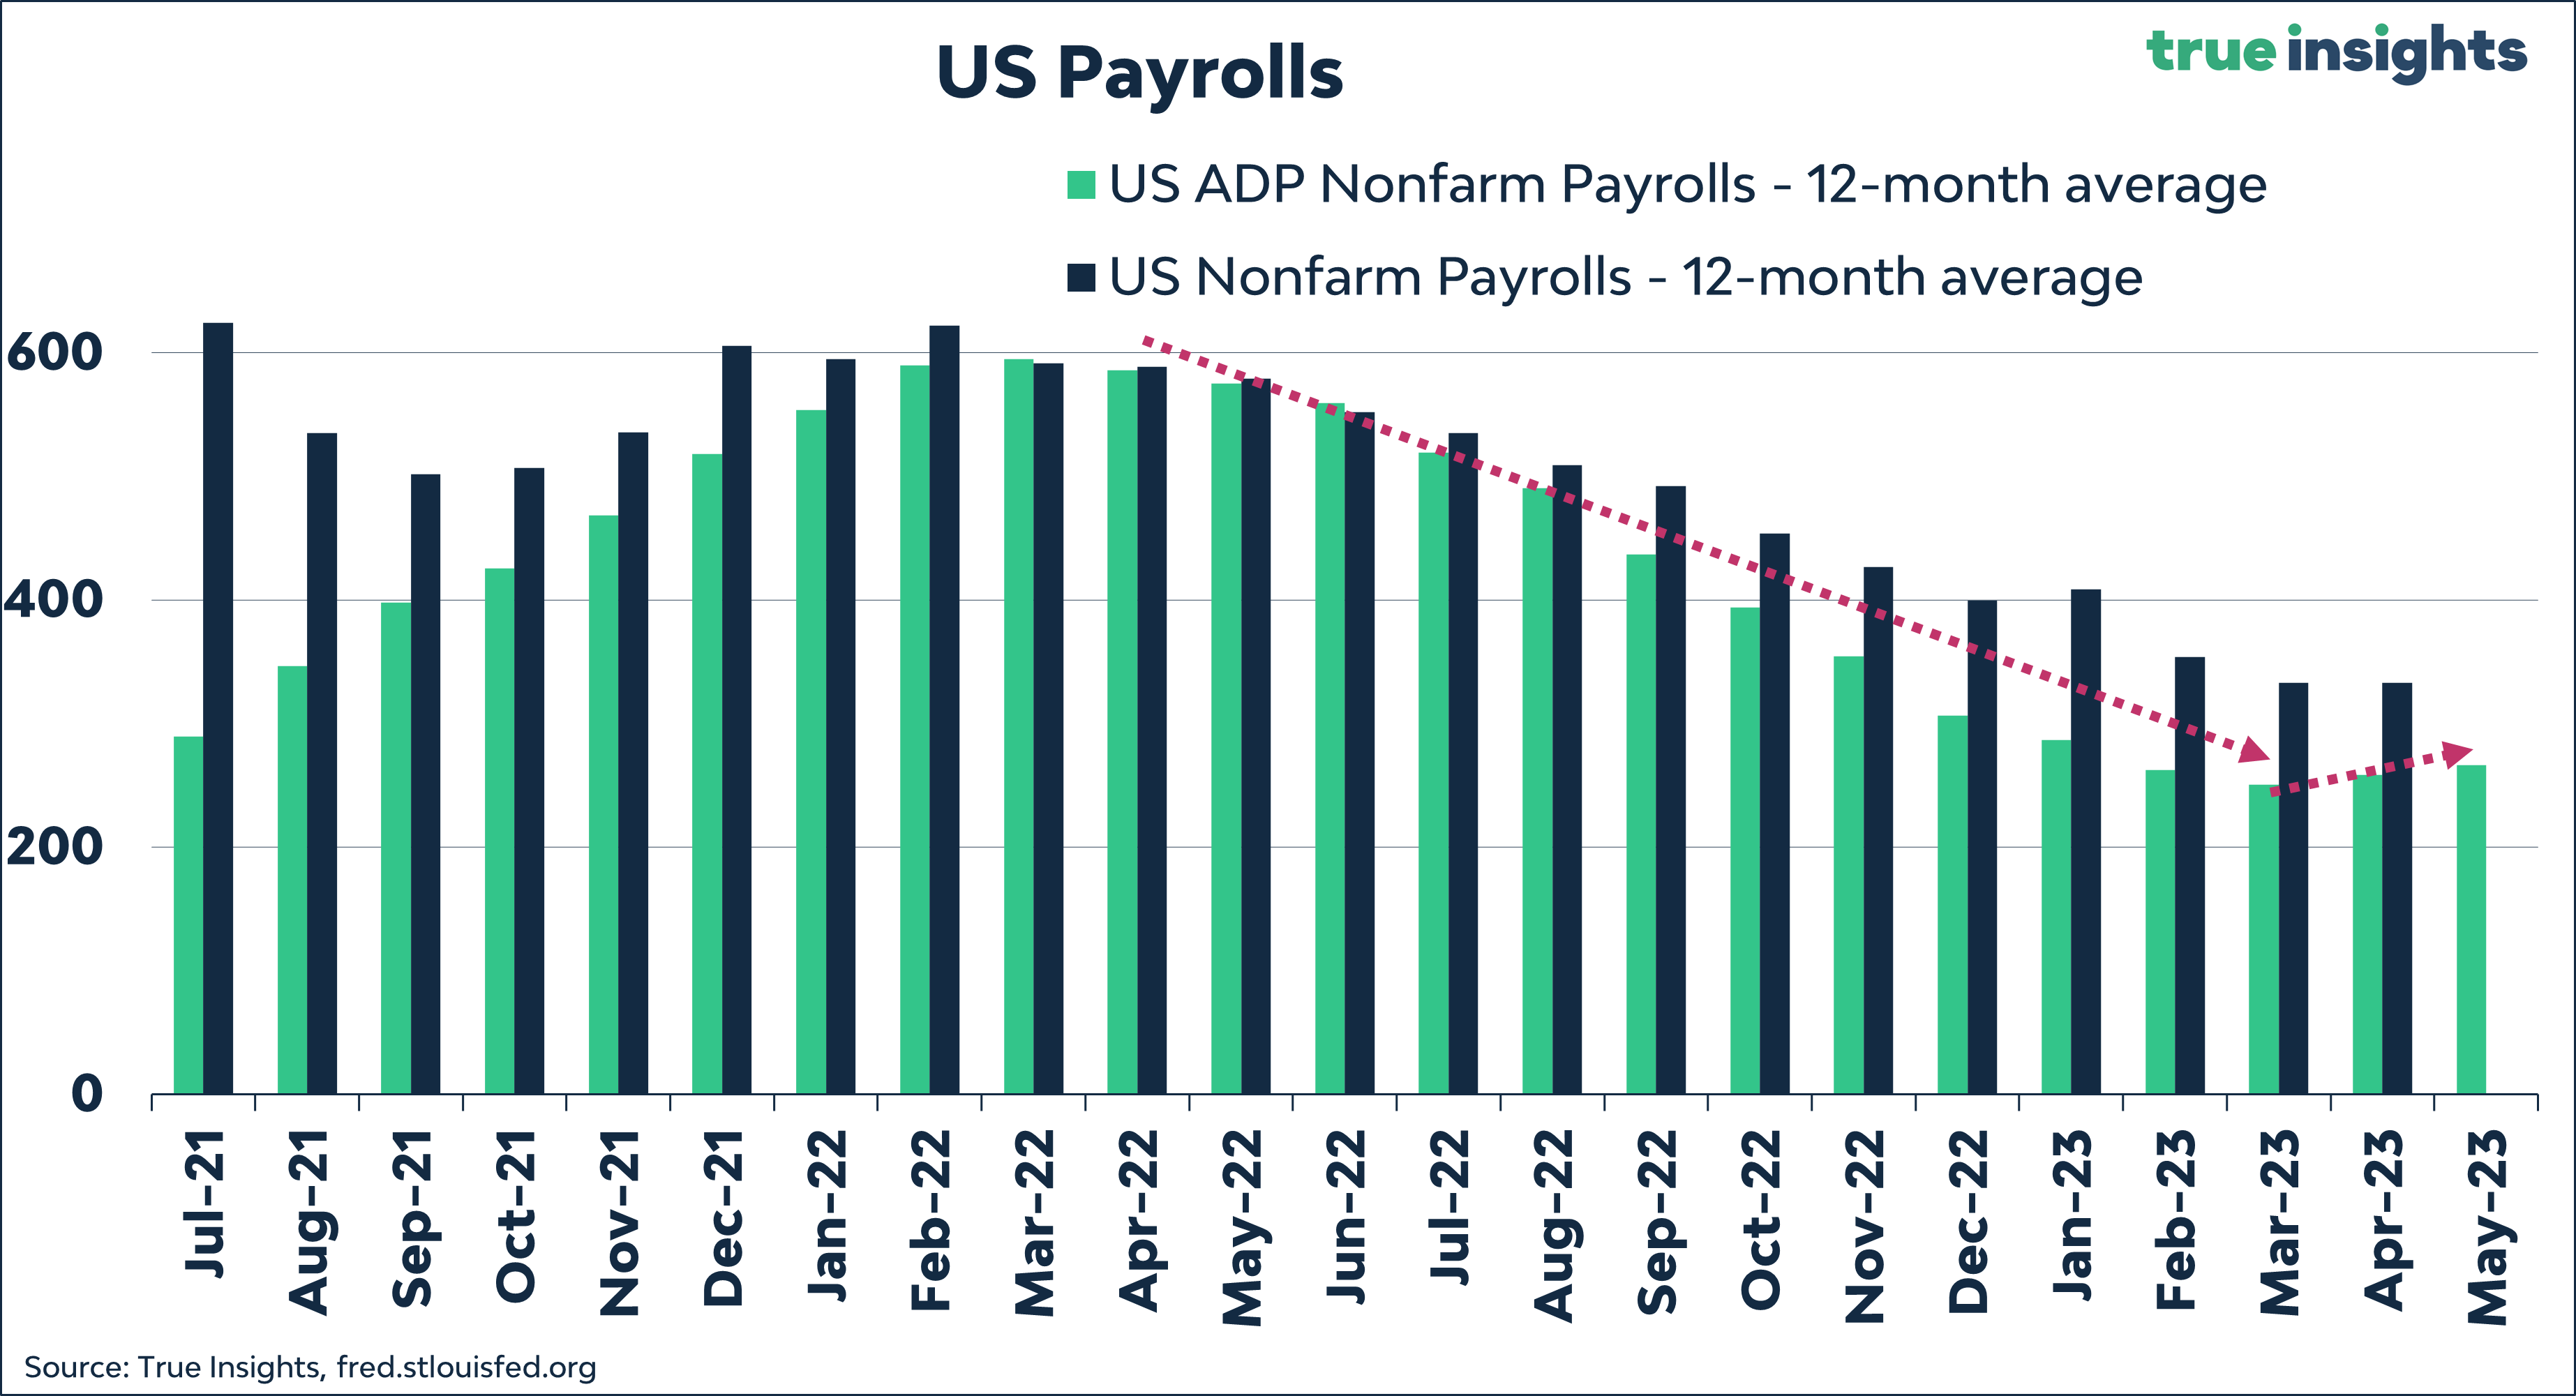
The ADP employment change report for May revealed the addition of 278K jobs last month, surpassing expectations by 108K. As a result, it marks the second consecutive month of accelerated job creation in the 12-month rolling average. This is definitely not the outcome Powell desires.
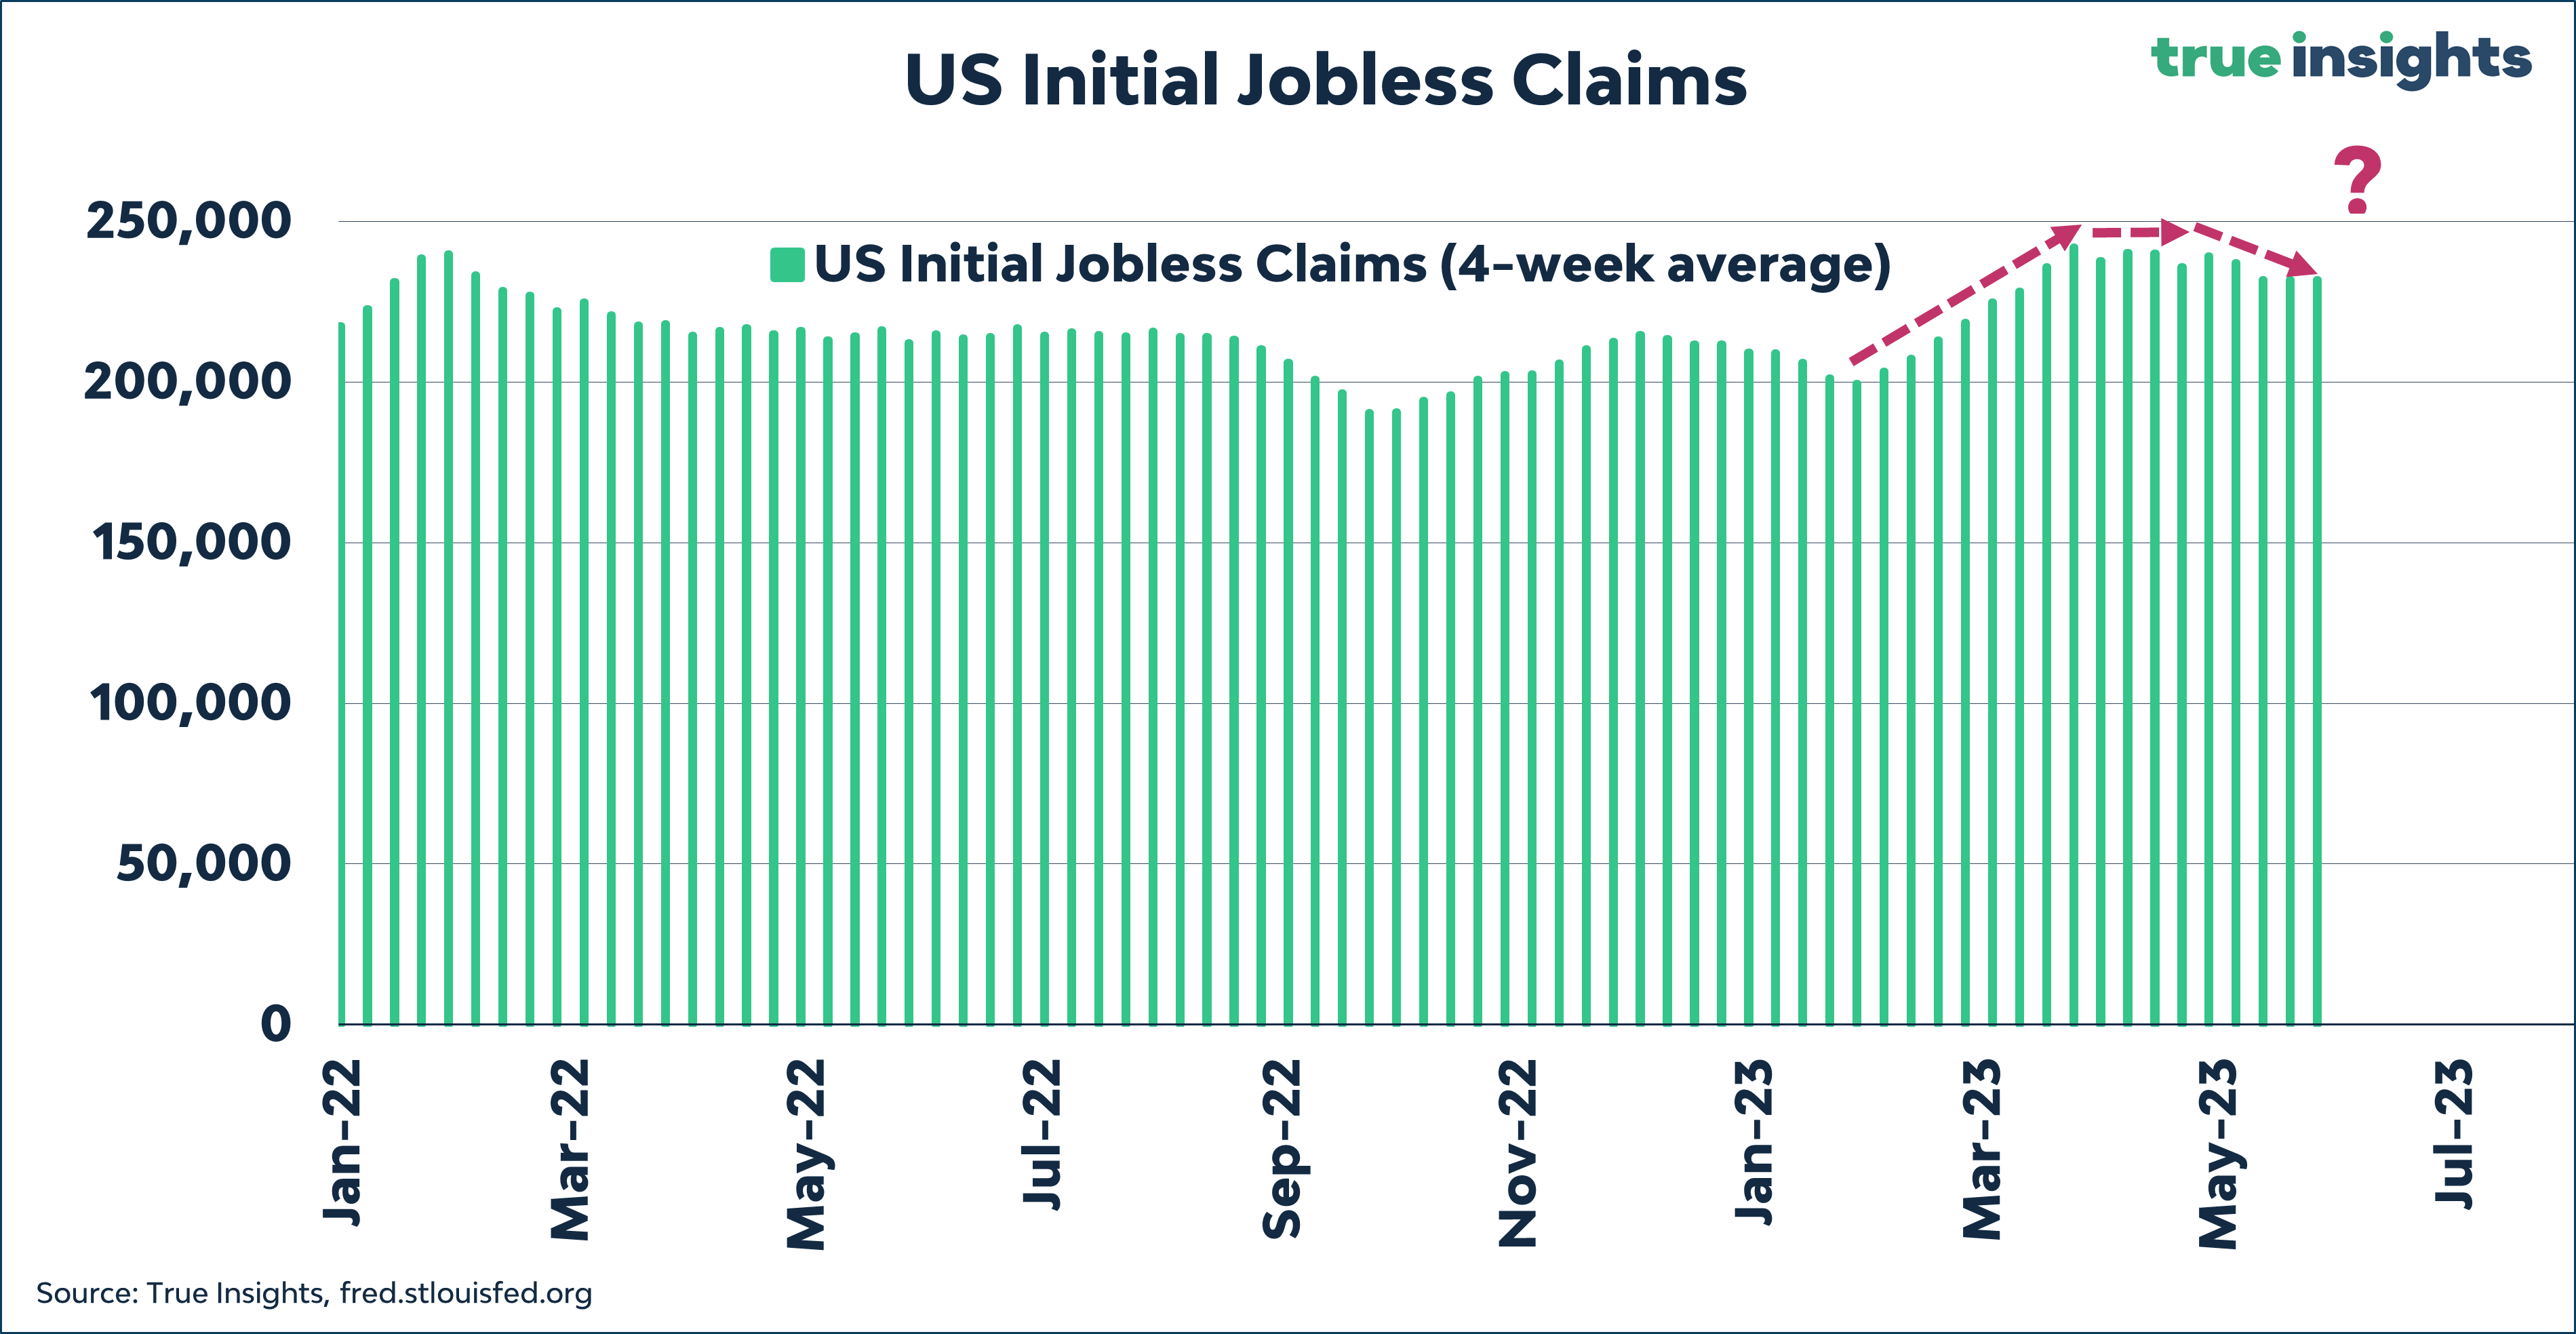
Finally, initial jobless claims once again came in lower than expected. Although the 4-week average claims briefly increased, they subsequently reversed in the last two weeks. As a result, the US labor market remains uncannily tight, leaving little room to skip the next rate hike from a labor market perspective.
Currently, markets reflect a % chance of another rate hike in two weeks. Our base case remains that the Fed will stay put, but it will be tight.
Inflation to the rescue?
Headline inflation is undergoing a swift downturn, indicated by a wave of subdued inflation figures this week.
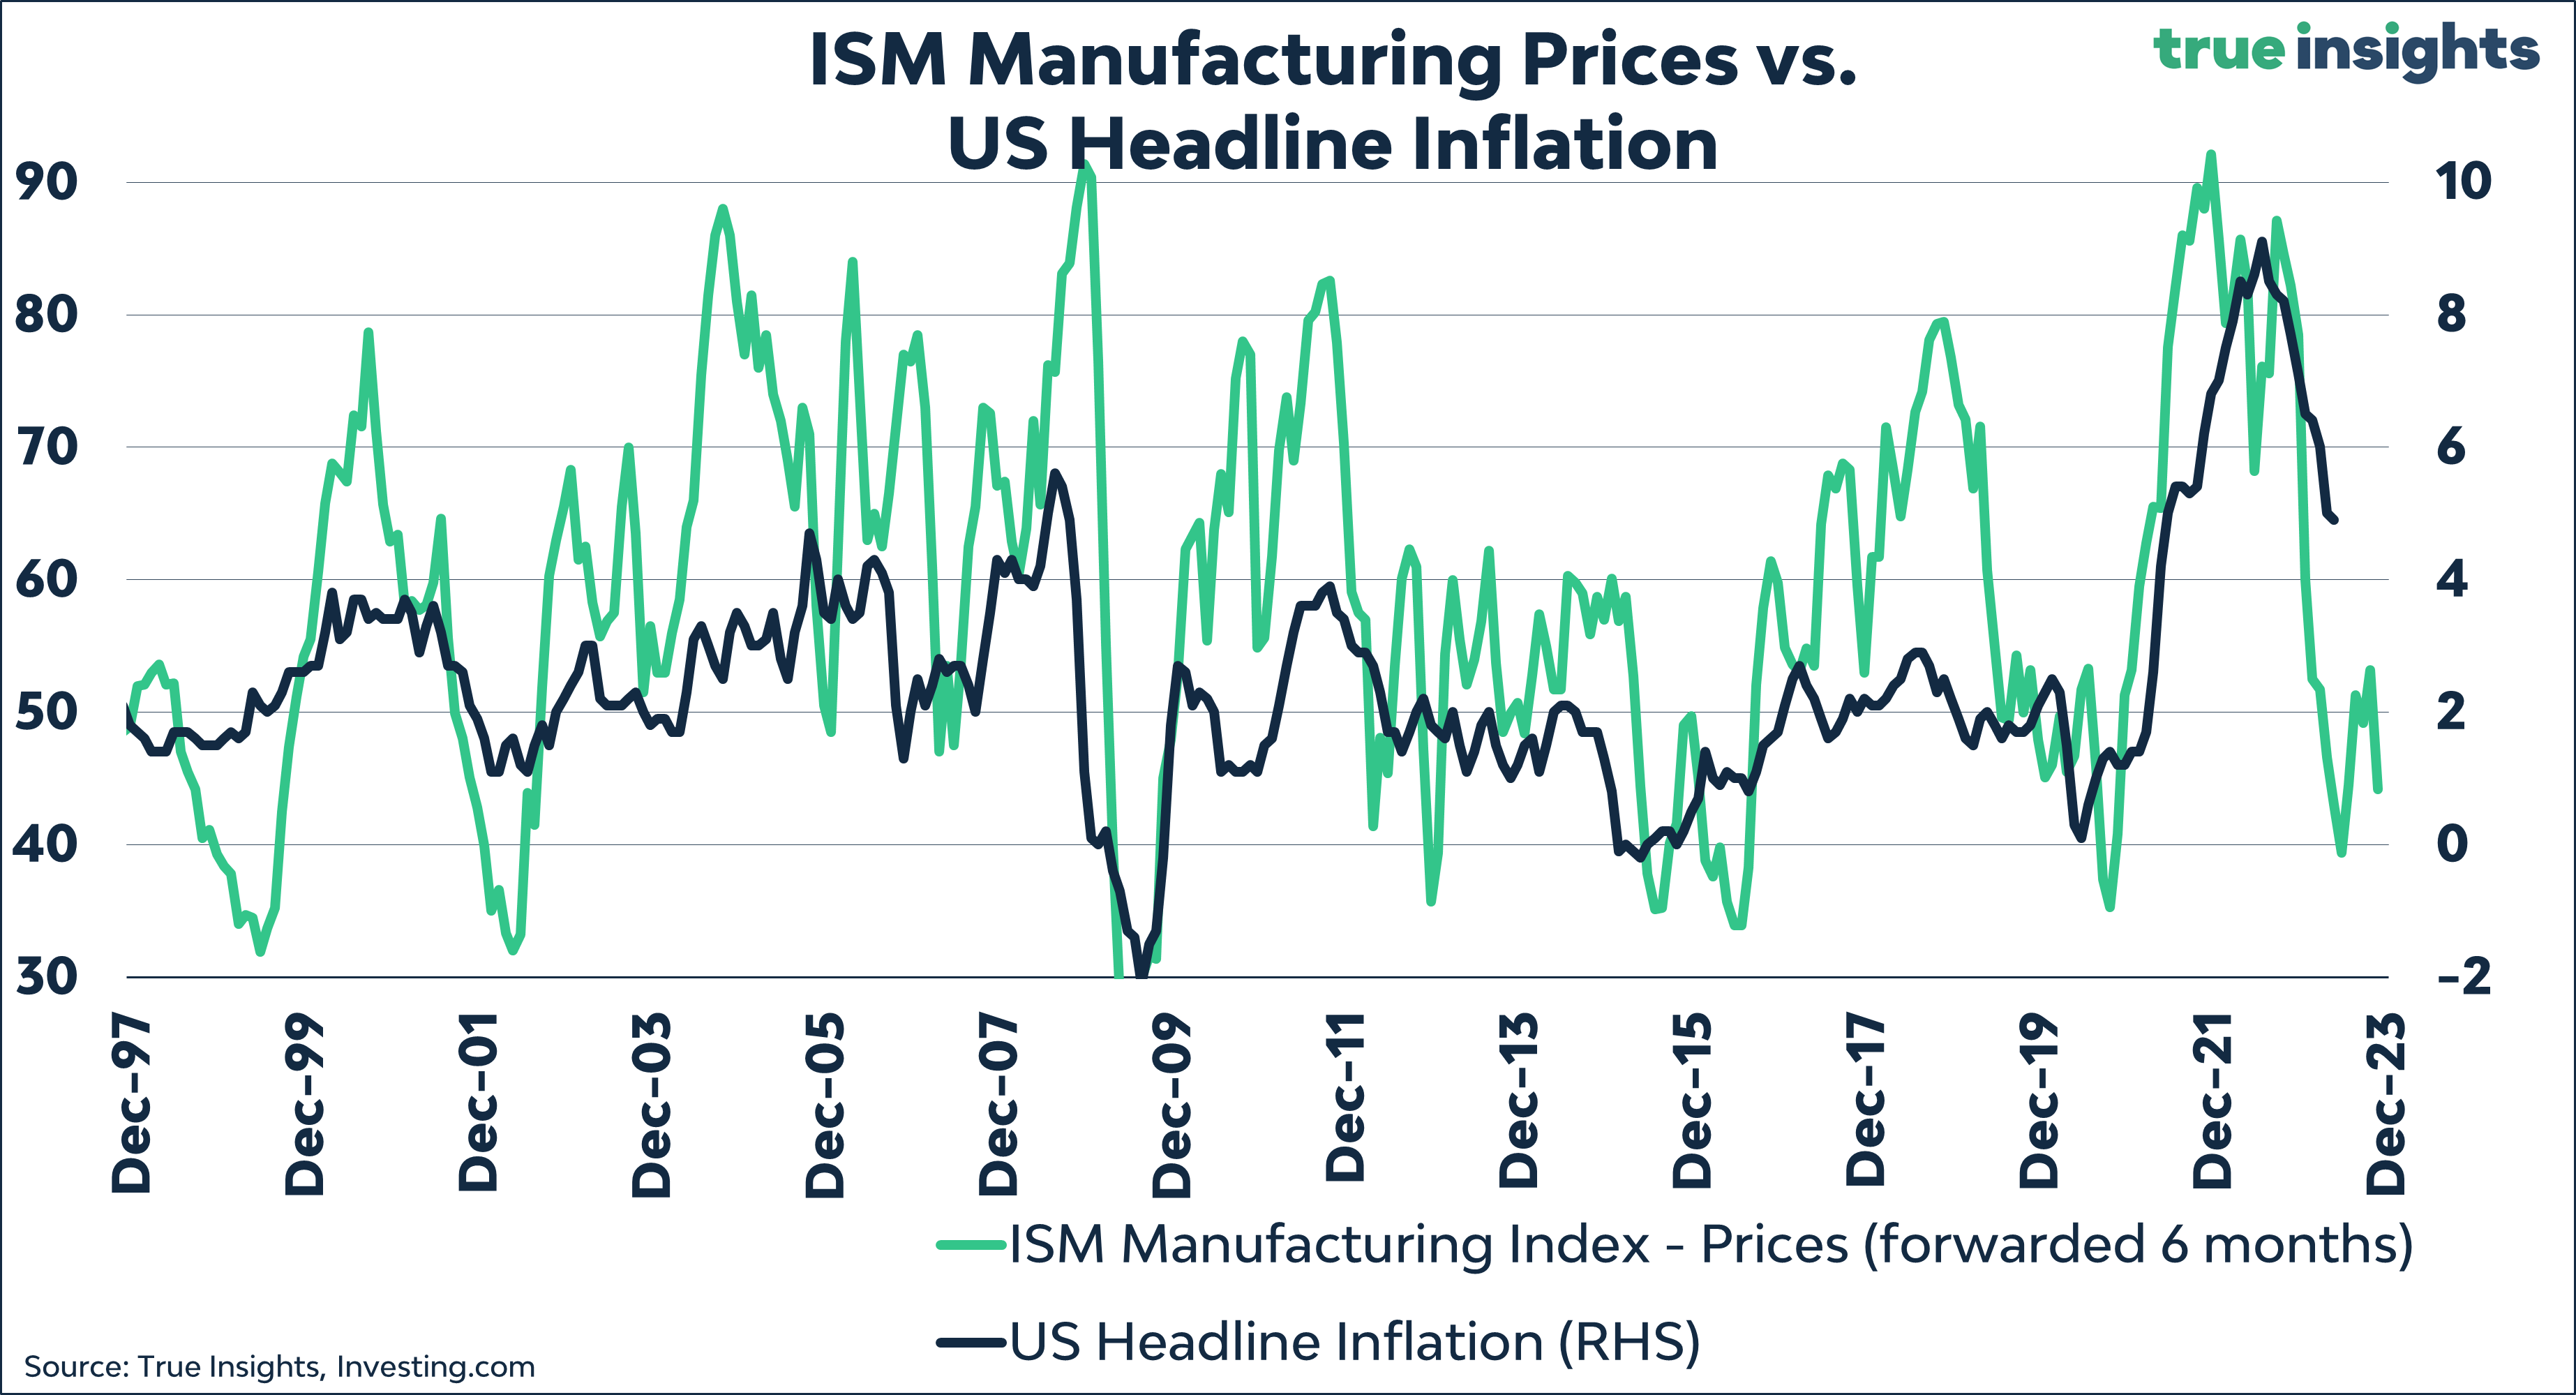
The ISM Manufacturing Prices Paid Index suggests US headline inflation well under 2%.
US inflation surprises have shifted into the negative, meaning inflation data largely come in below expectations.
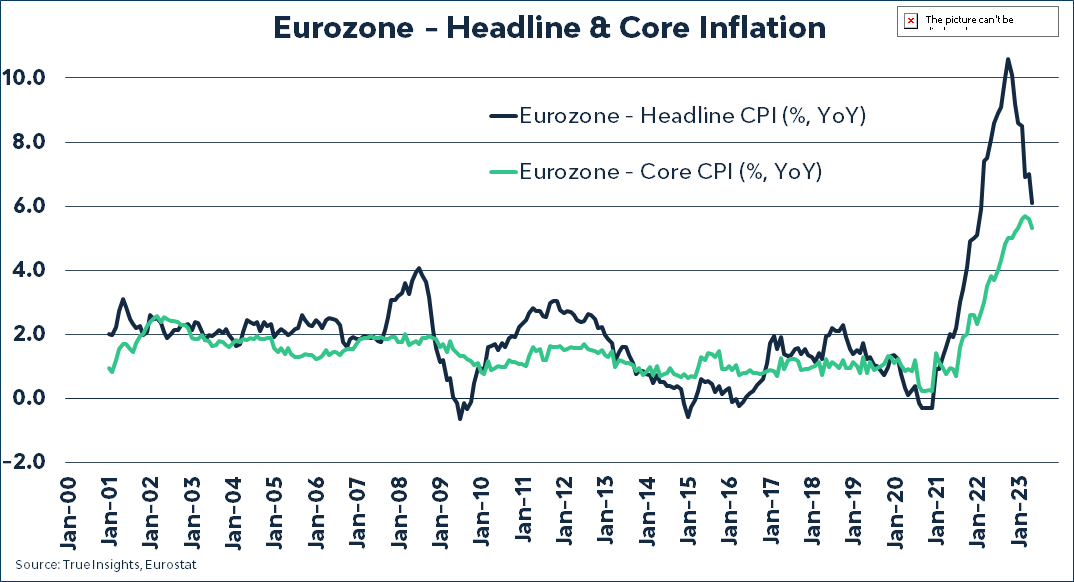
In the Eurozone, though inflation surprises remained positive in May, the visible downward trend suggests headline inflation of roughly 2%.
Spanish monthly consumer prices fell in May, the first time since January, when prices usually drop due to post-holiday season sales. Consequently, Spain’s headline inflation, which typically leads Eurozone inflation by a month or two, dropped to 3.2%.
The Eurozone’s preliminary inflation estimate for May revealed headline inflation falling to 6.1% from 7.0%. Moreover, core inflation also declined beyond expectations, reaching 5.3%.
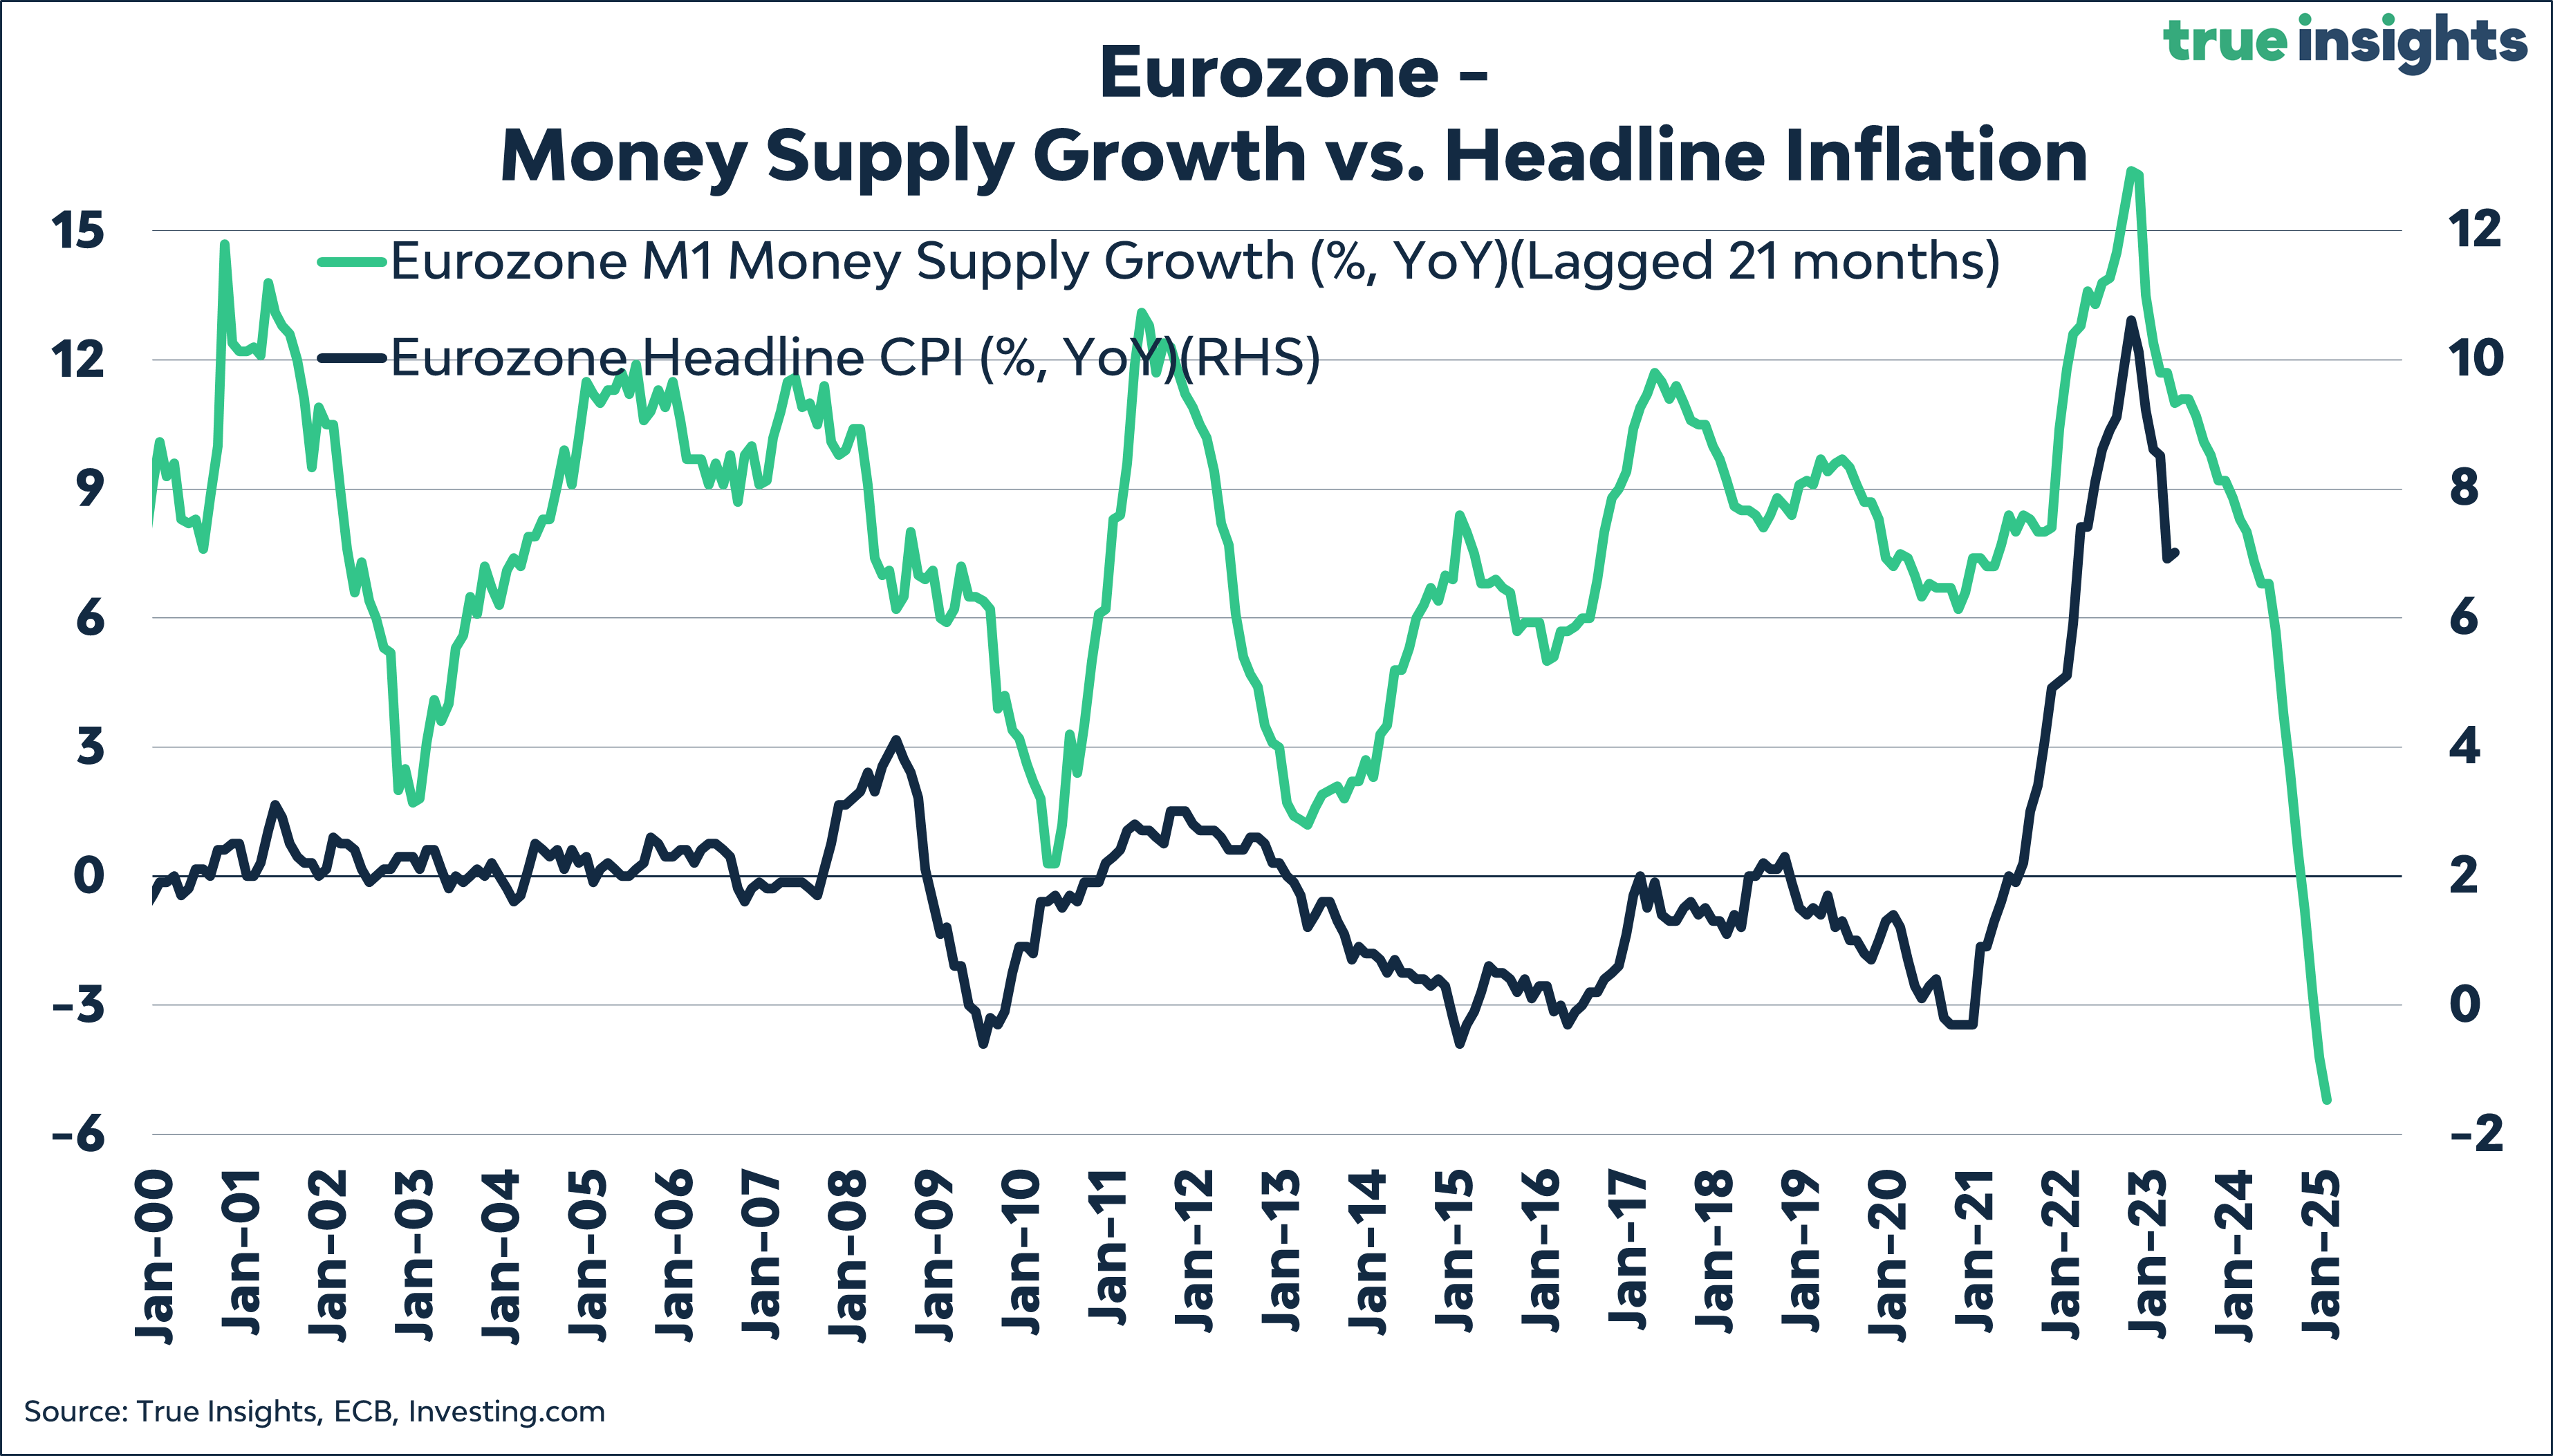
Finally, Eurozone’s M1 Money Supply has declined by over 5% compared to last year, while M2 Money Supply remains nearly unchanged. While the correlation between Money Supply and inflation is not flawless, the downward trend is crystal clear.
Two primary insights emerge from this week’s inflation data. First, even as headline and core inflation decline faster than anticipated, central banks remain committed to their objective of further rate hikes or maintaining elevated interest rate levels. This has all to do with restoring credibility, but with tangible economic risks. The risks of doing too much are real.
Second, despite central banks’ hawkish stand, decelerating inflation could signal the conclusion of the tightening cycle, particularly once GDP growth slows down significantly, potentially culminating in a recession if history is any guide. The scenario of central banks reducing rates in response to inflation reverting to target while managing a soft landing seems less probable to us. However, this is the exact scenario markets are anticipating.
China: Glass half full?
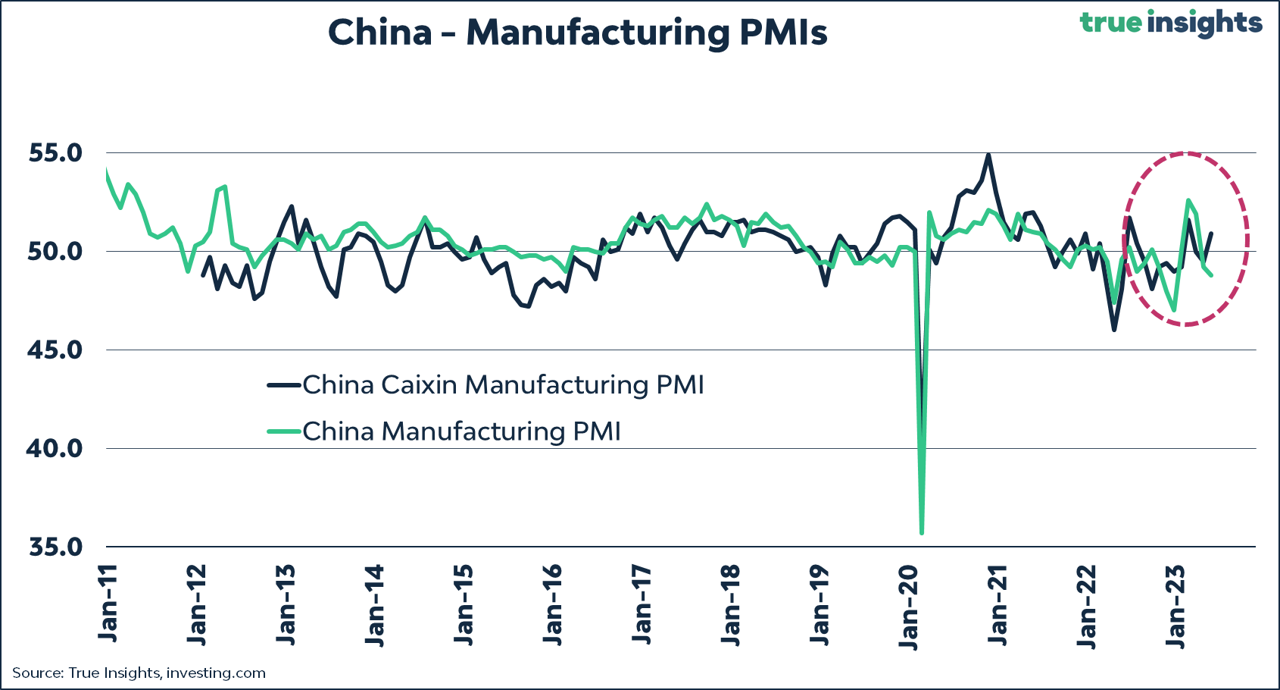
China’s recent reopening efforts have experienced a waning momentum, reflected in the official Manufacturing Purchasing Managers’ Index (PMI) of 48.8. And while the ‘other’ Caixin Manufacturing PMI beat expectations, the average of the two indices remains below 50.
The chart below reveals the surge in Manufacturing PMIs within the Eurozone and the United States after the relaxation of Covid restrictions in 2021. These regions experienced a flourishing economic momentum, as depicted by the green (US) and blue (Eurozone) lines.
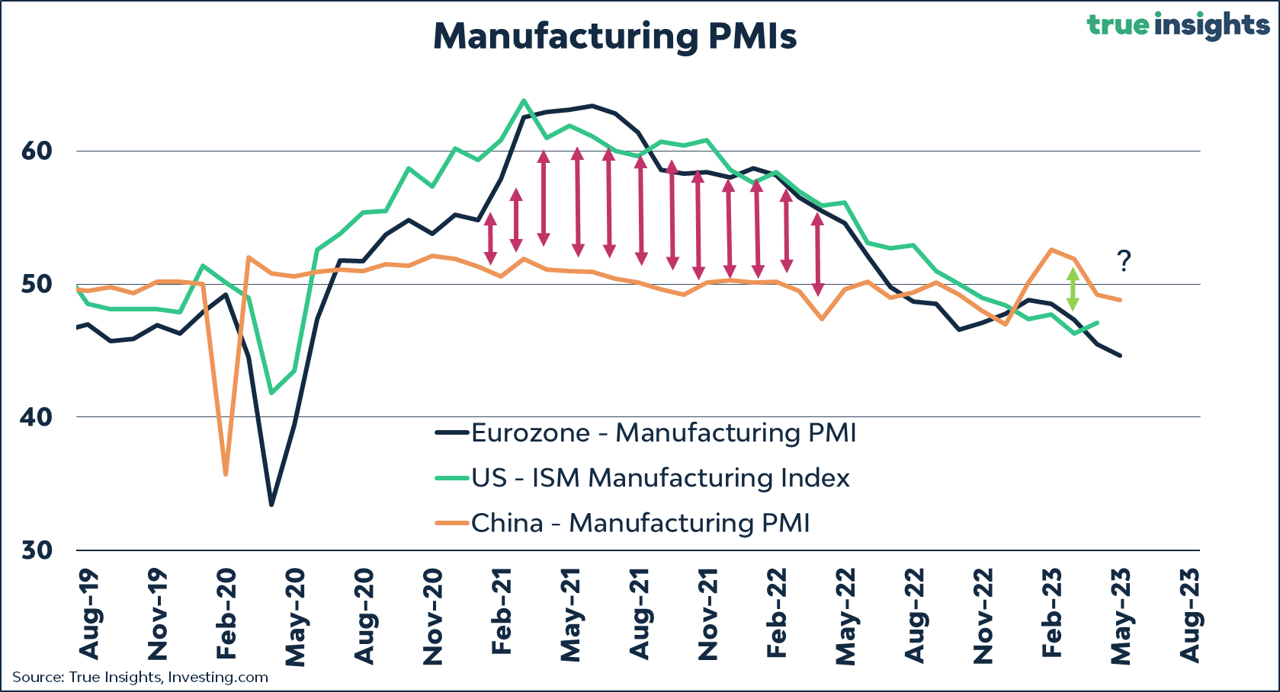
In contrast, China’s manufacturing activity (orange line) has witnessed a swift decline after only a modest recovery. The chart reveals an absence of any substantial catch-up compared to other regions, as emphasized by the solitary green arrow.
Anxiety rose among investors who had anticipated China to serve as a counterbalance to the deceleration of global economic momentum.
The China chart nobody is watching
The persistent economic challenges in China have led to a gradual devaluation of the Chinese Yuan against the US dollar throughout the year. However, the pace of this depreciation has significantly intensified since May, coinciding with the fading prospects of a swift economic recovery.
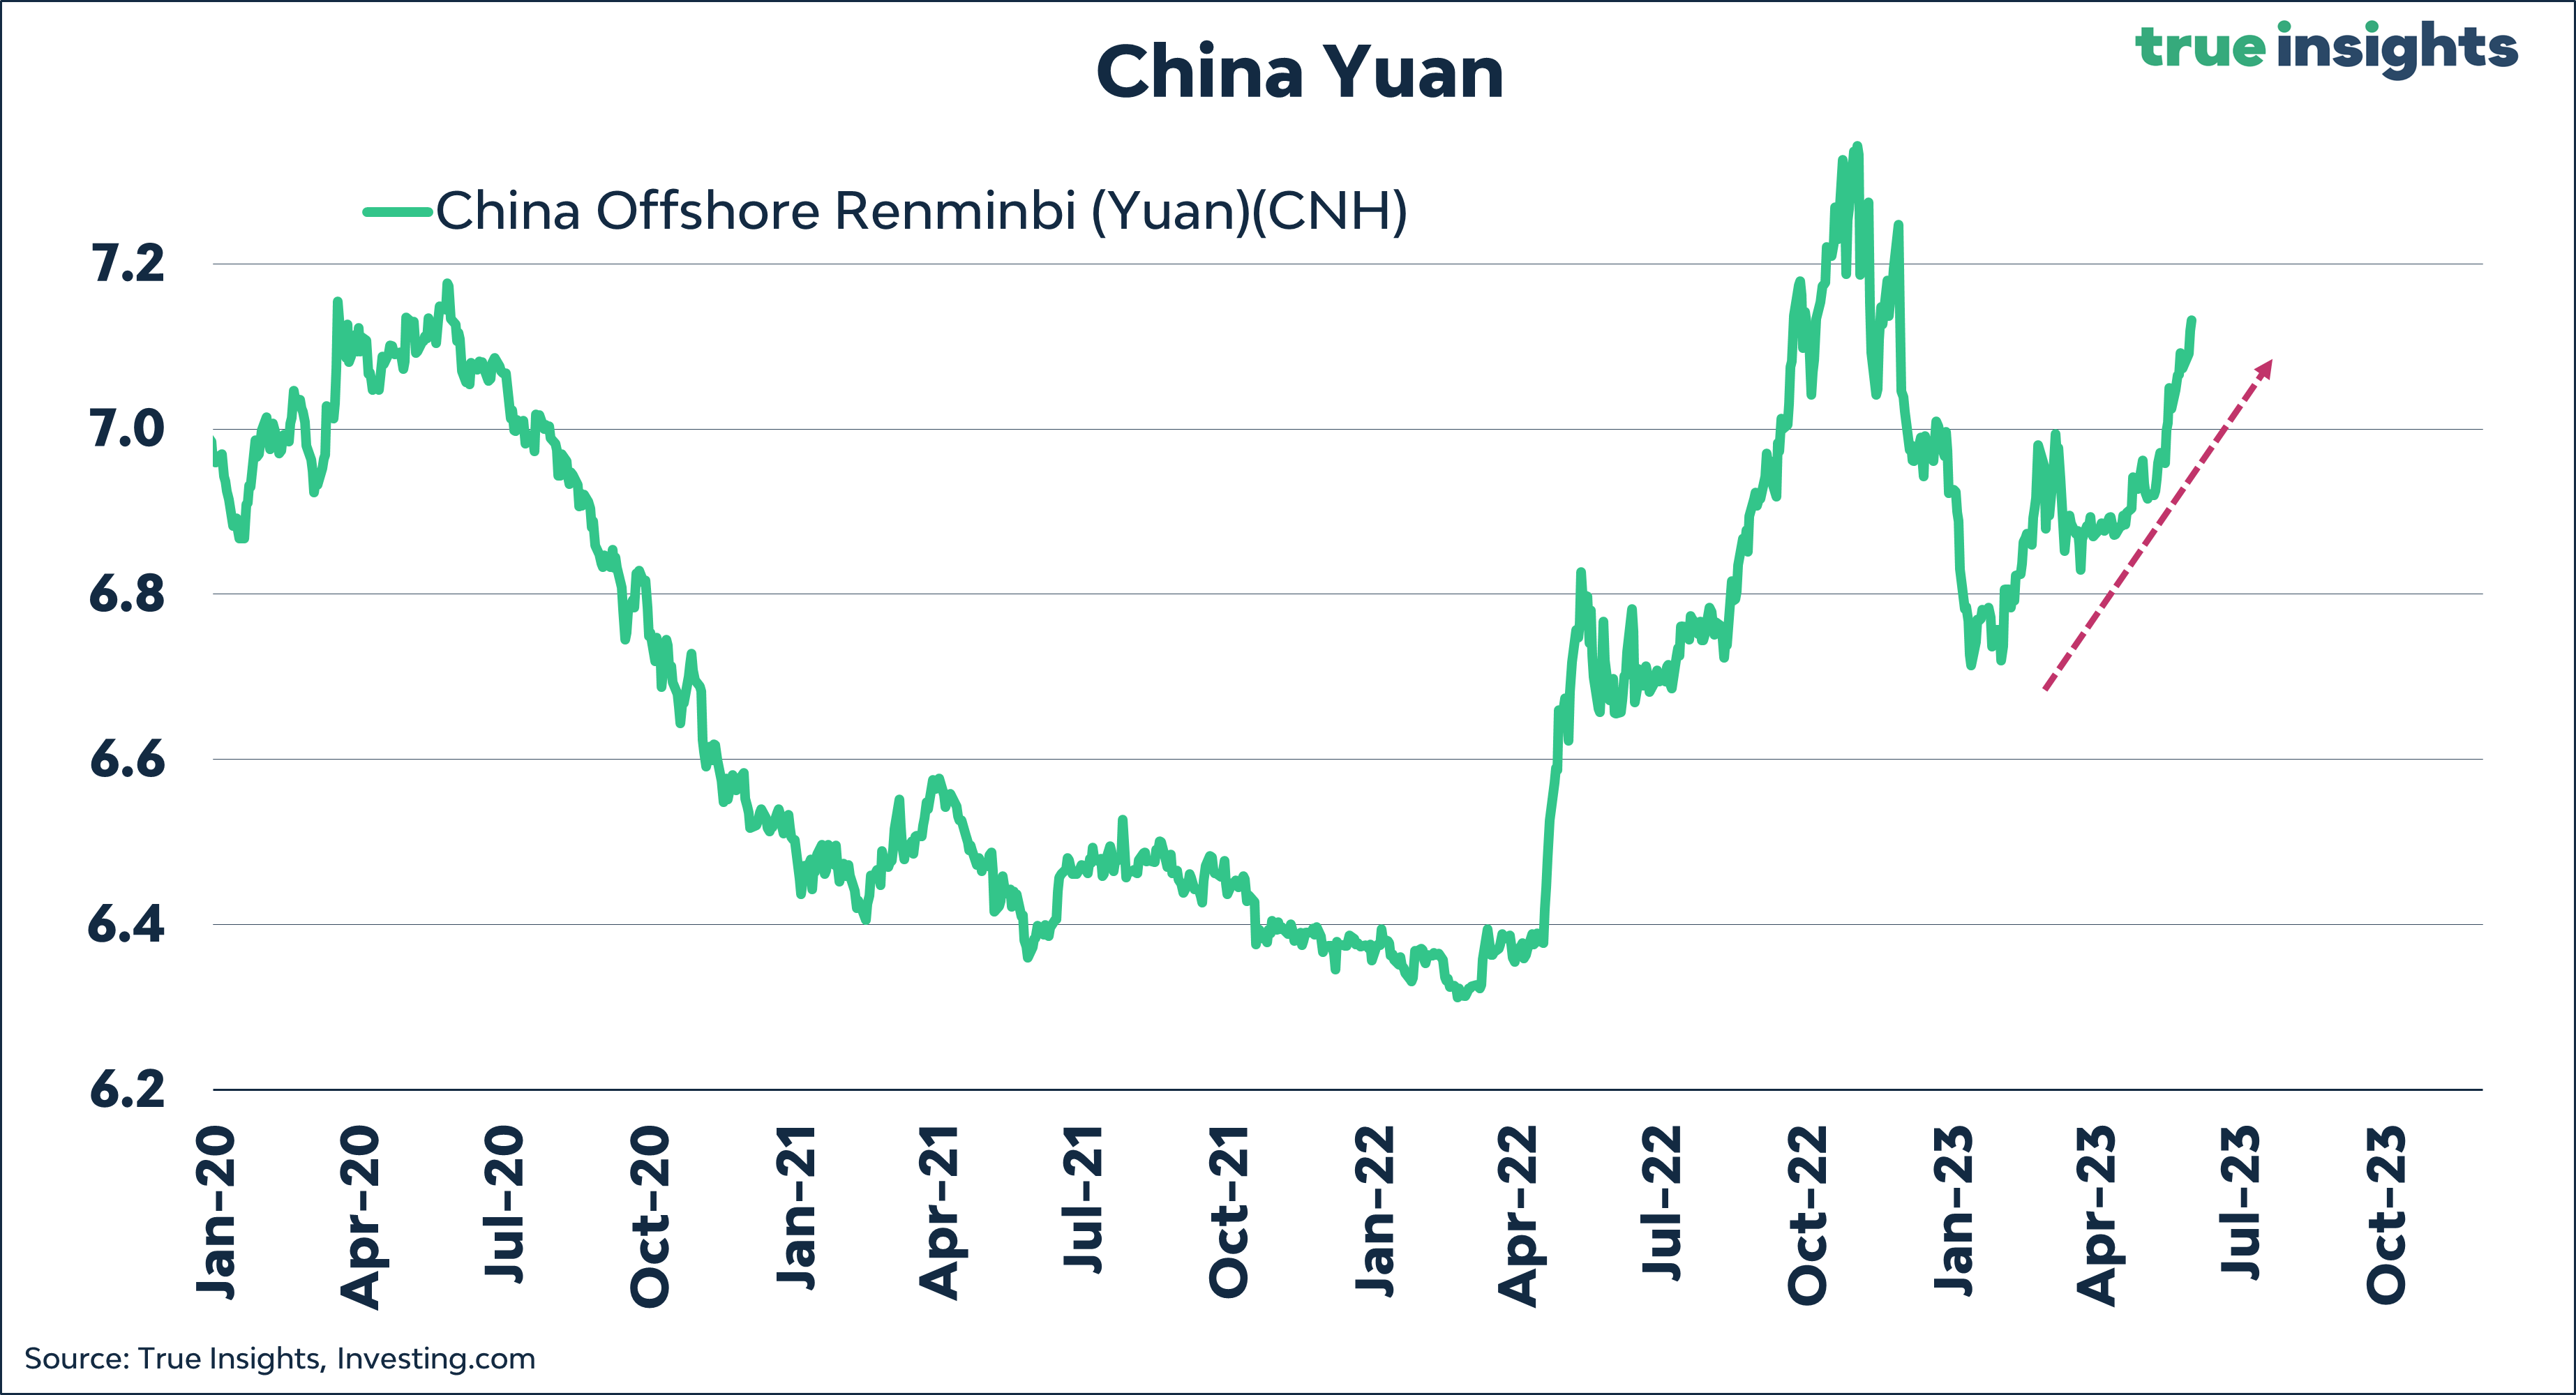
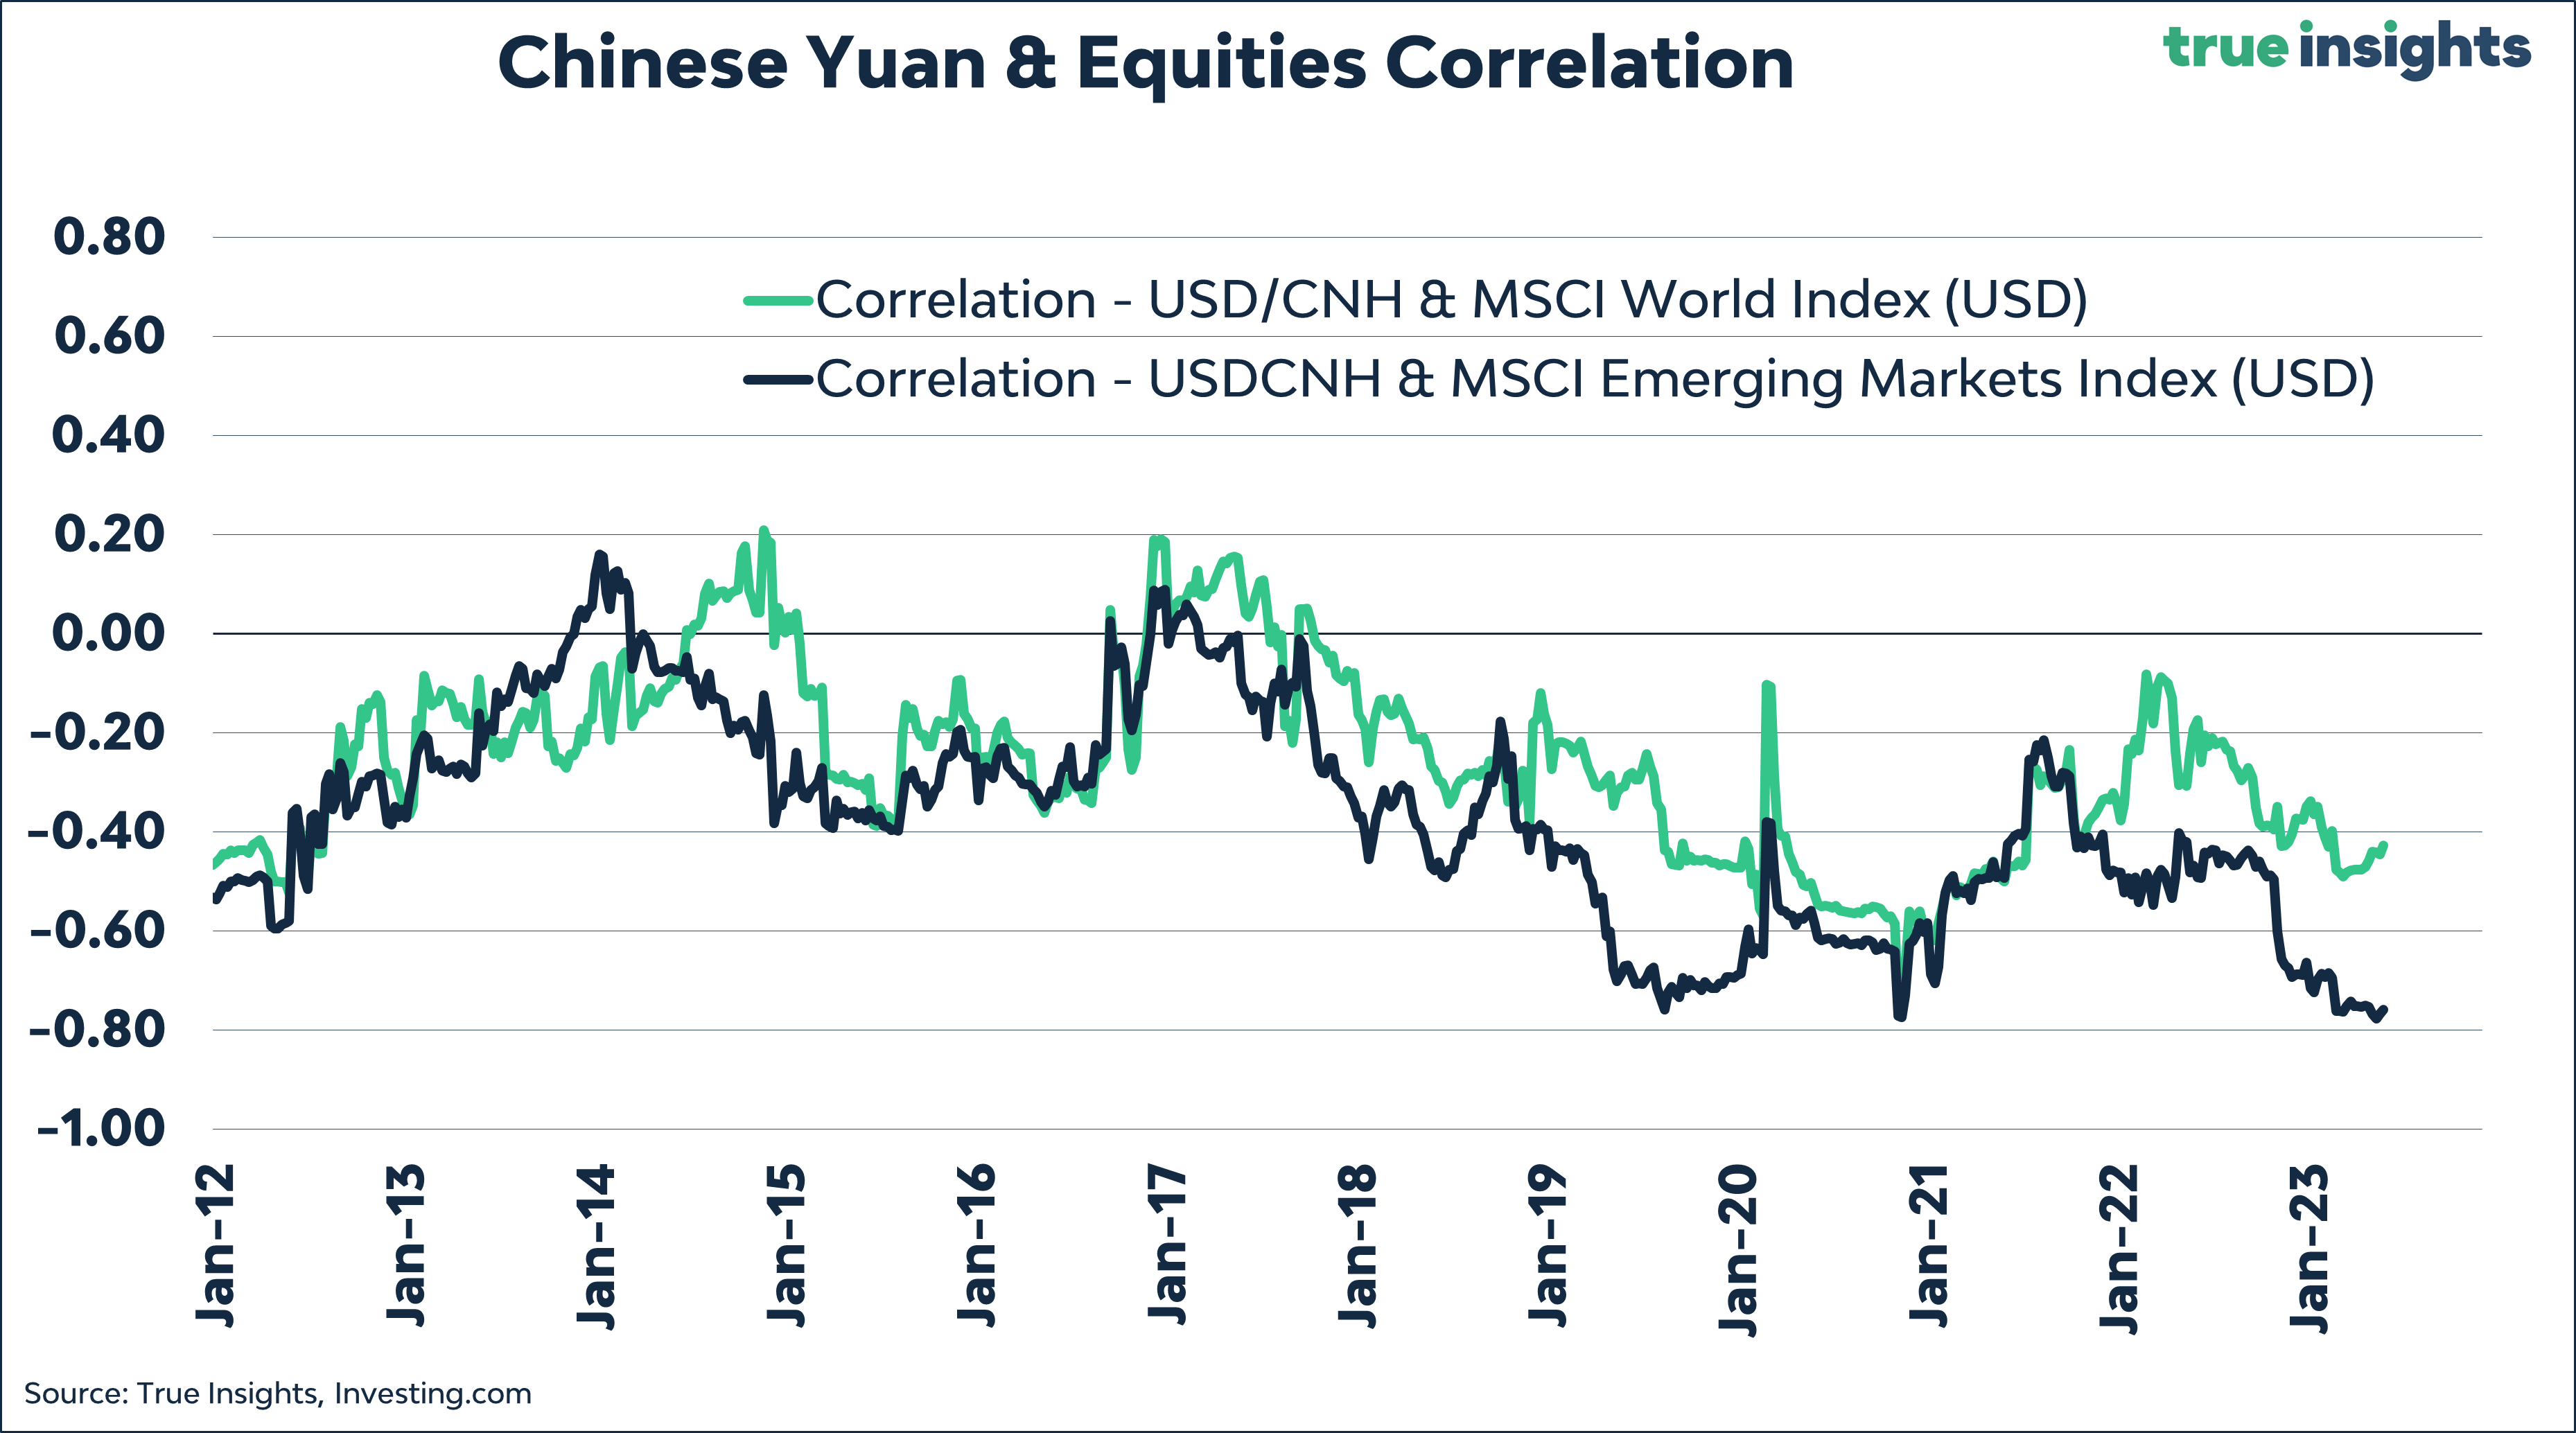
This development raises concerns for equity markets, as they exhibit a strong negative correlation with a depreciating Chinese Yuan. When the Chinese currency falls, so do equities most of the time.
For the record, parts of the Chinese stock market fell into bear market this week, helping our underweight in Emerging Market Equities.
Commodities and recessions
In one of our Insights, we looked at the decrease in prices of industrial metals and its effects on the broader spectrum of commodities. In the present week, oil has followed suit, experiencing a substantial drop of up to 8% before partially recovering from the decline.
Since reaching their peak in June of last year, the cumulative reduction in commodity prices has now expanded to over 27%. This significant downturn is indicative of a strong probability exceeding 70% that the United States will fall into recession, based on the historical patterns observed in commodity prices during periods of economic decline.
Interestingly, Equities, High Yield, and Corporate Bonds are pricing a lower likelihood of a new US recession.
Sentiment
Fear & Frenzy
Our Fear & Frenzy Sentiment Index is inching toward Frenzy, but there’s still some ground to cover before it gets there.
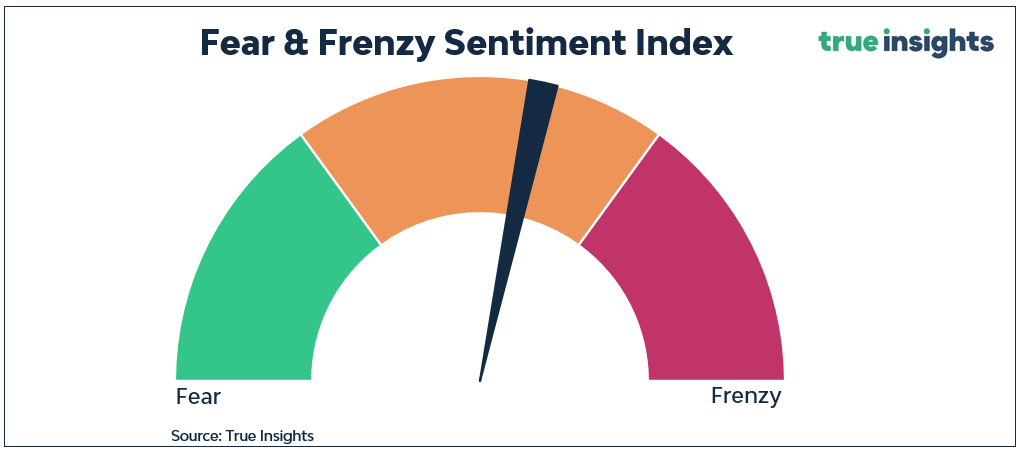
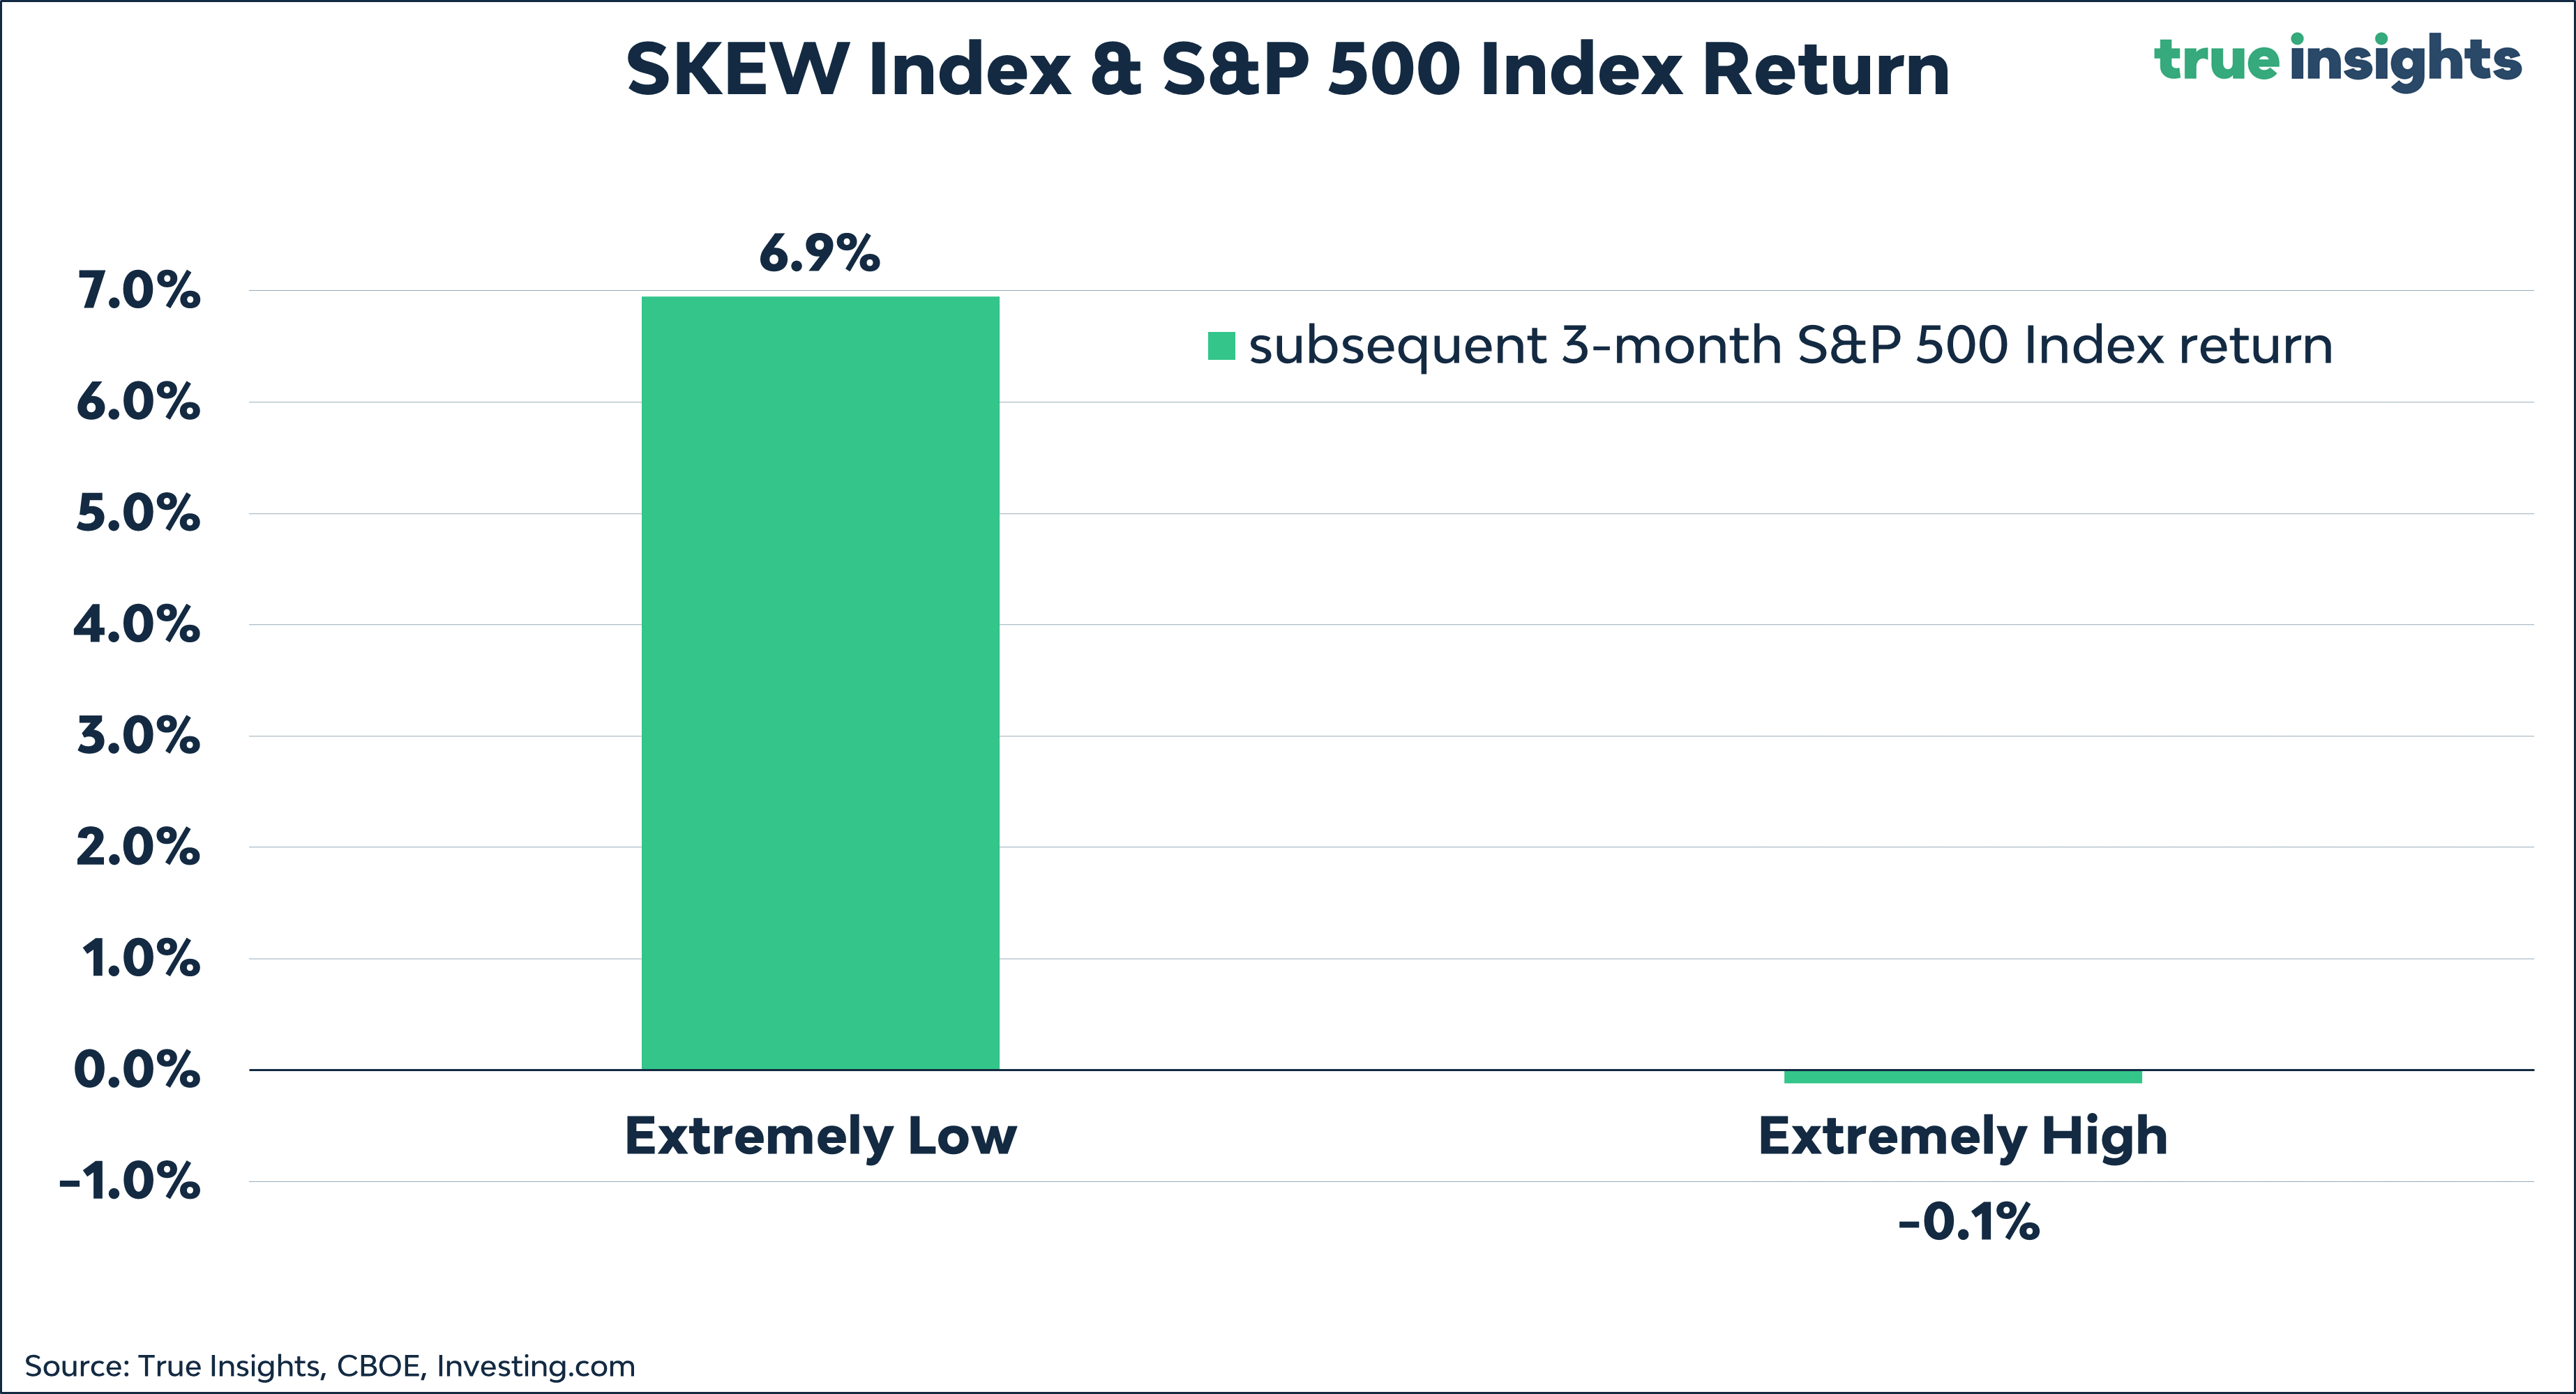
The SKEW Index, one of the 11 sentiment indicators incorporated in the Fear & Frenzy Sentiment Index, has spiked to extreme levels. The last time we saw this measure of potential tail risk or black swan events in financial markets was at the start of 2022.
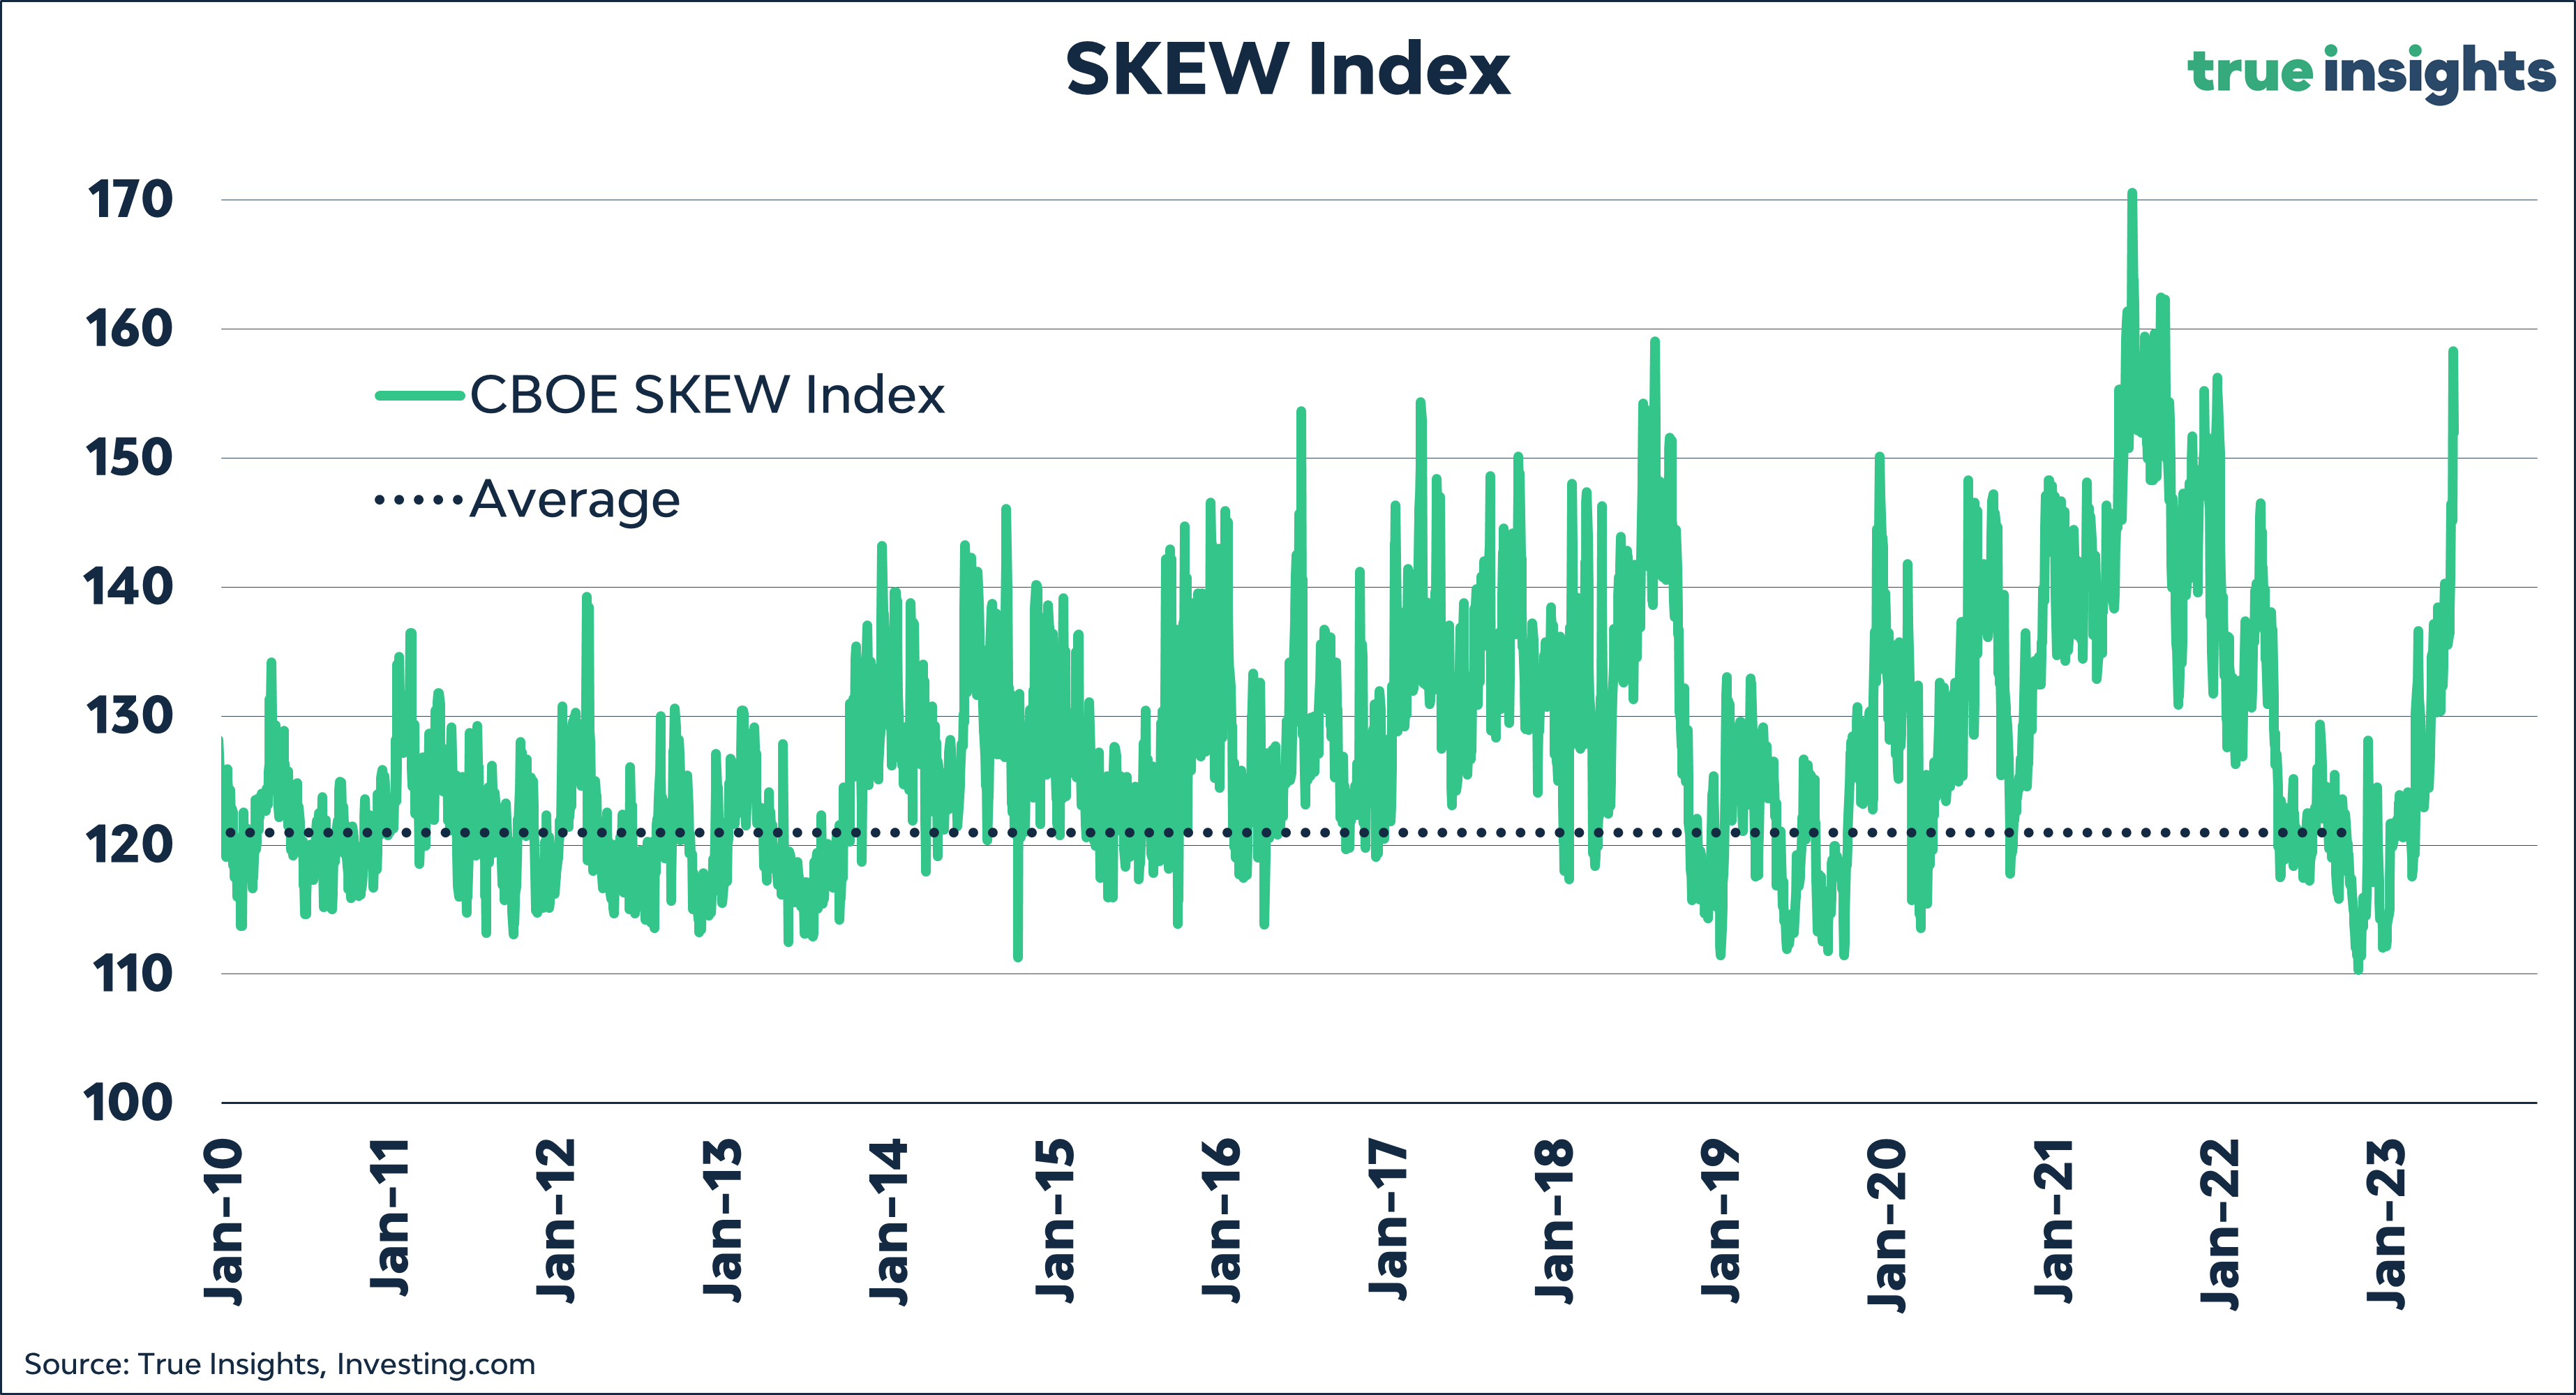
Contrary to what some investors believe, a very high SKEW Index is a bearish signal. The three-month average return on the S&P 500 Index following an extreme reading has been -0.1%.
Bubble spotting
As you will have noticed, we did some work on equity market bubbles this week. We highlighted the empirical study by Goetzmann (2016), which spans over 3000 stock market-years across 21 different markets from 1900 to 2014. This comprehensive study convincingly reveals that stock market bubbles – characterized by a 100% boom in real price within a single year, followed by a 50% or more downturn in the ensuing year – a very rare. The odds of a bubble in Goetzmann’s database are mere 0.3%.
We looked for (potential) bubbles in current markets as a follow-up. The chart below shows the performance since the low back in October of:
MSCI World
S&P 500 Index
NASDAQGlobal Semiconductors
SOX (The Philadelphia Semiconductor Index)
NYSE FANG+ (comprising Alphabet, Amazon, AMD, Apple, Meta, Microsoft, Netflix, NVIDIA, Snowflake, and Tesla)
Non-profitable Tech
ROBO Global® Robotics and Automation Index
NVIDIA
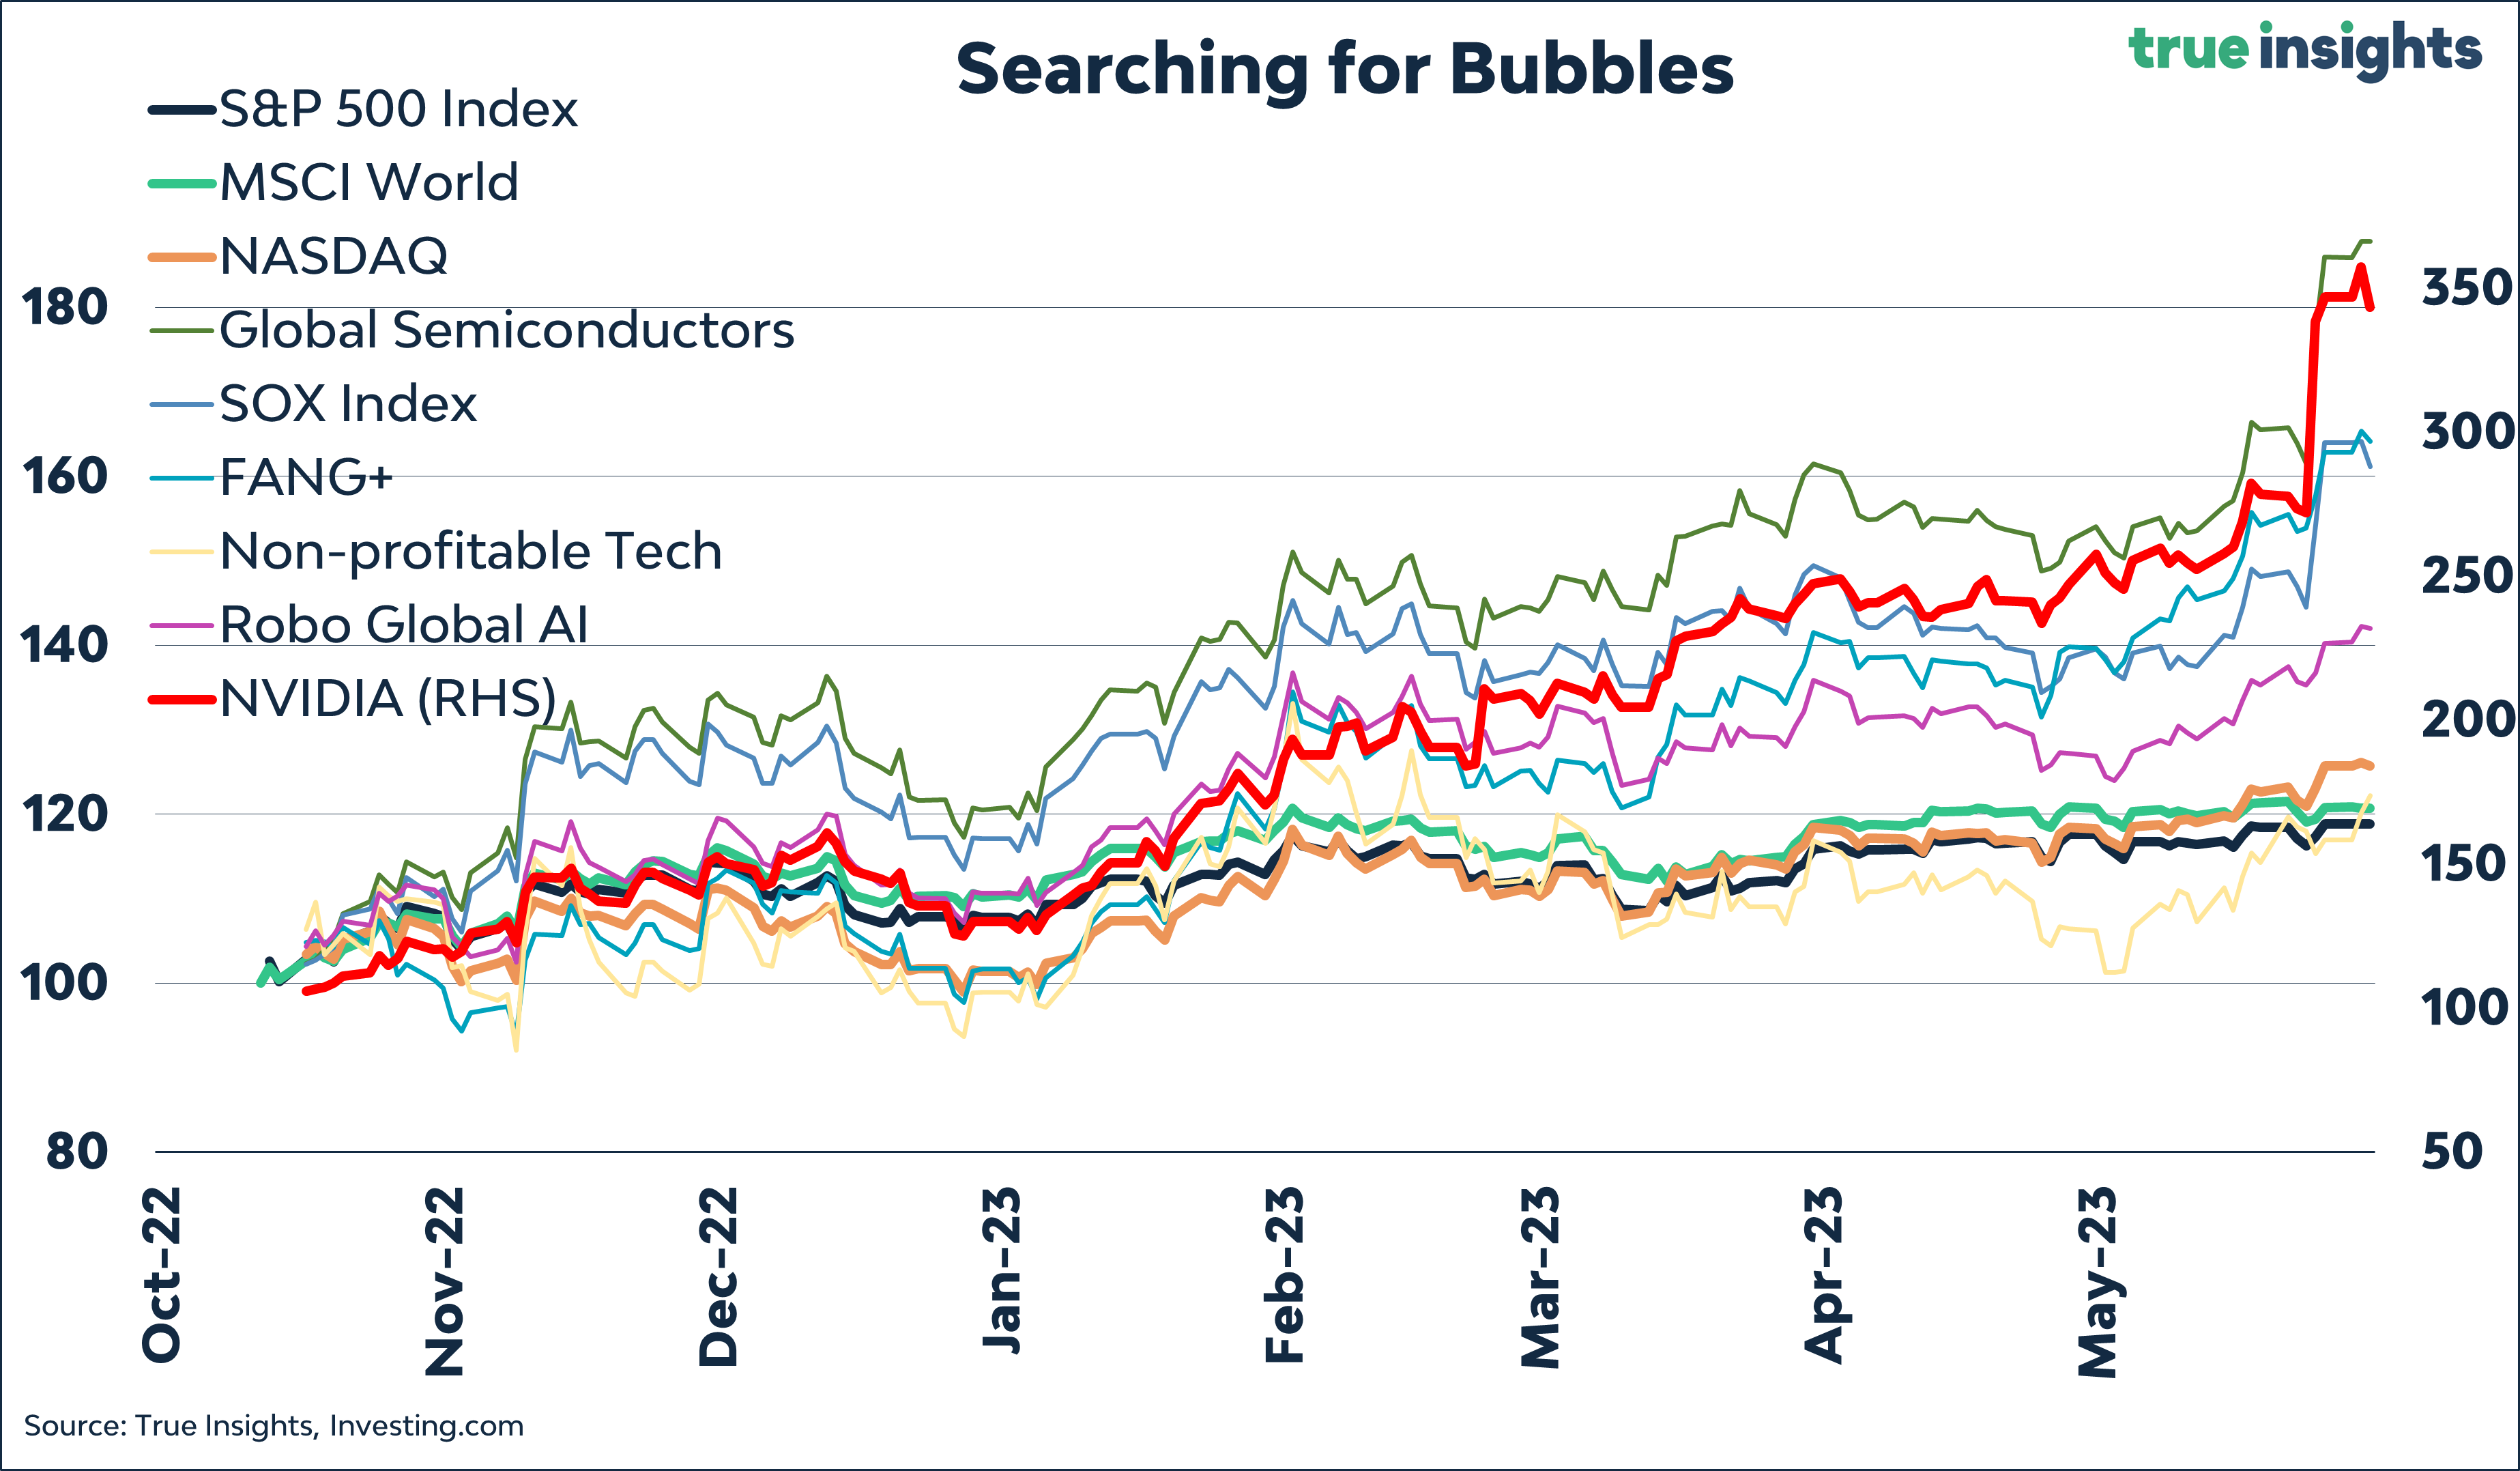
Based on Goetzmann’s core definition, a 100% rise within a year, it is evident that we are not currently experiencing such a boom. None of the indices mentioned in the previous analysis have shown an increase of more than 100% since their low in October. While NVIDIA, as a single stock, has risen by more than 100%, it would not make much sense to declare a market bubble based solely on the performance of a single stock.
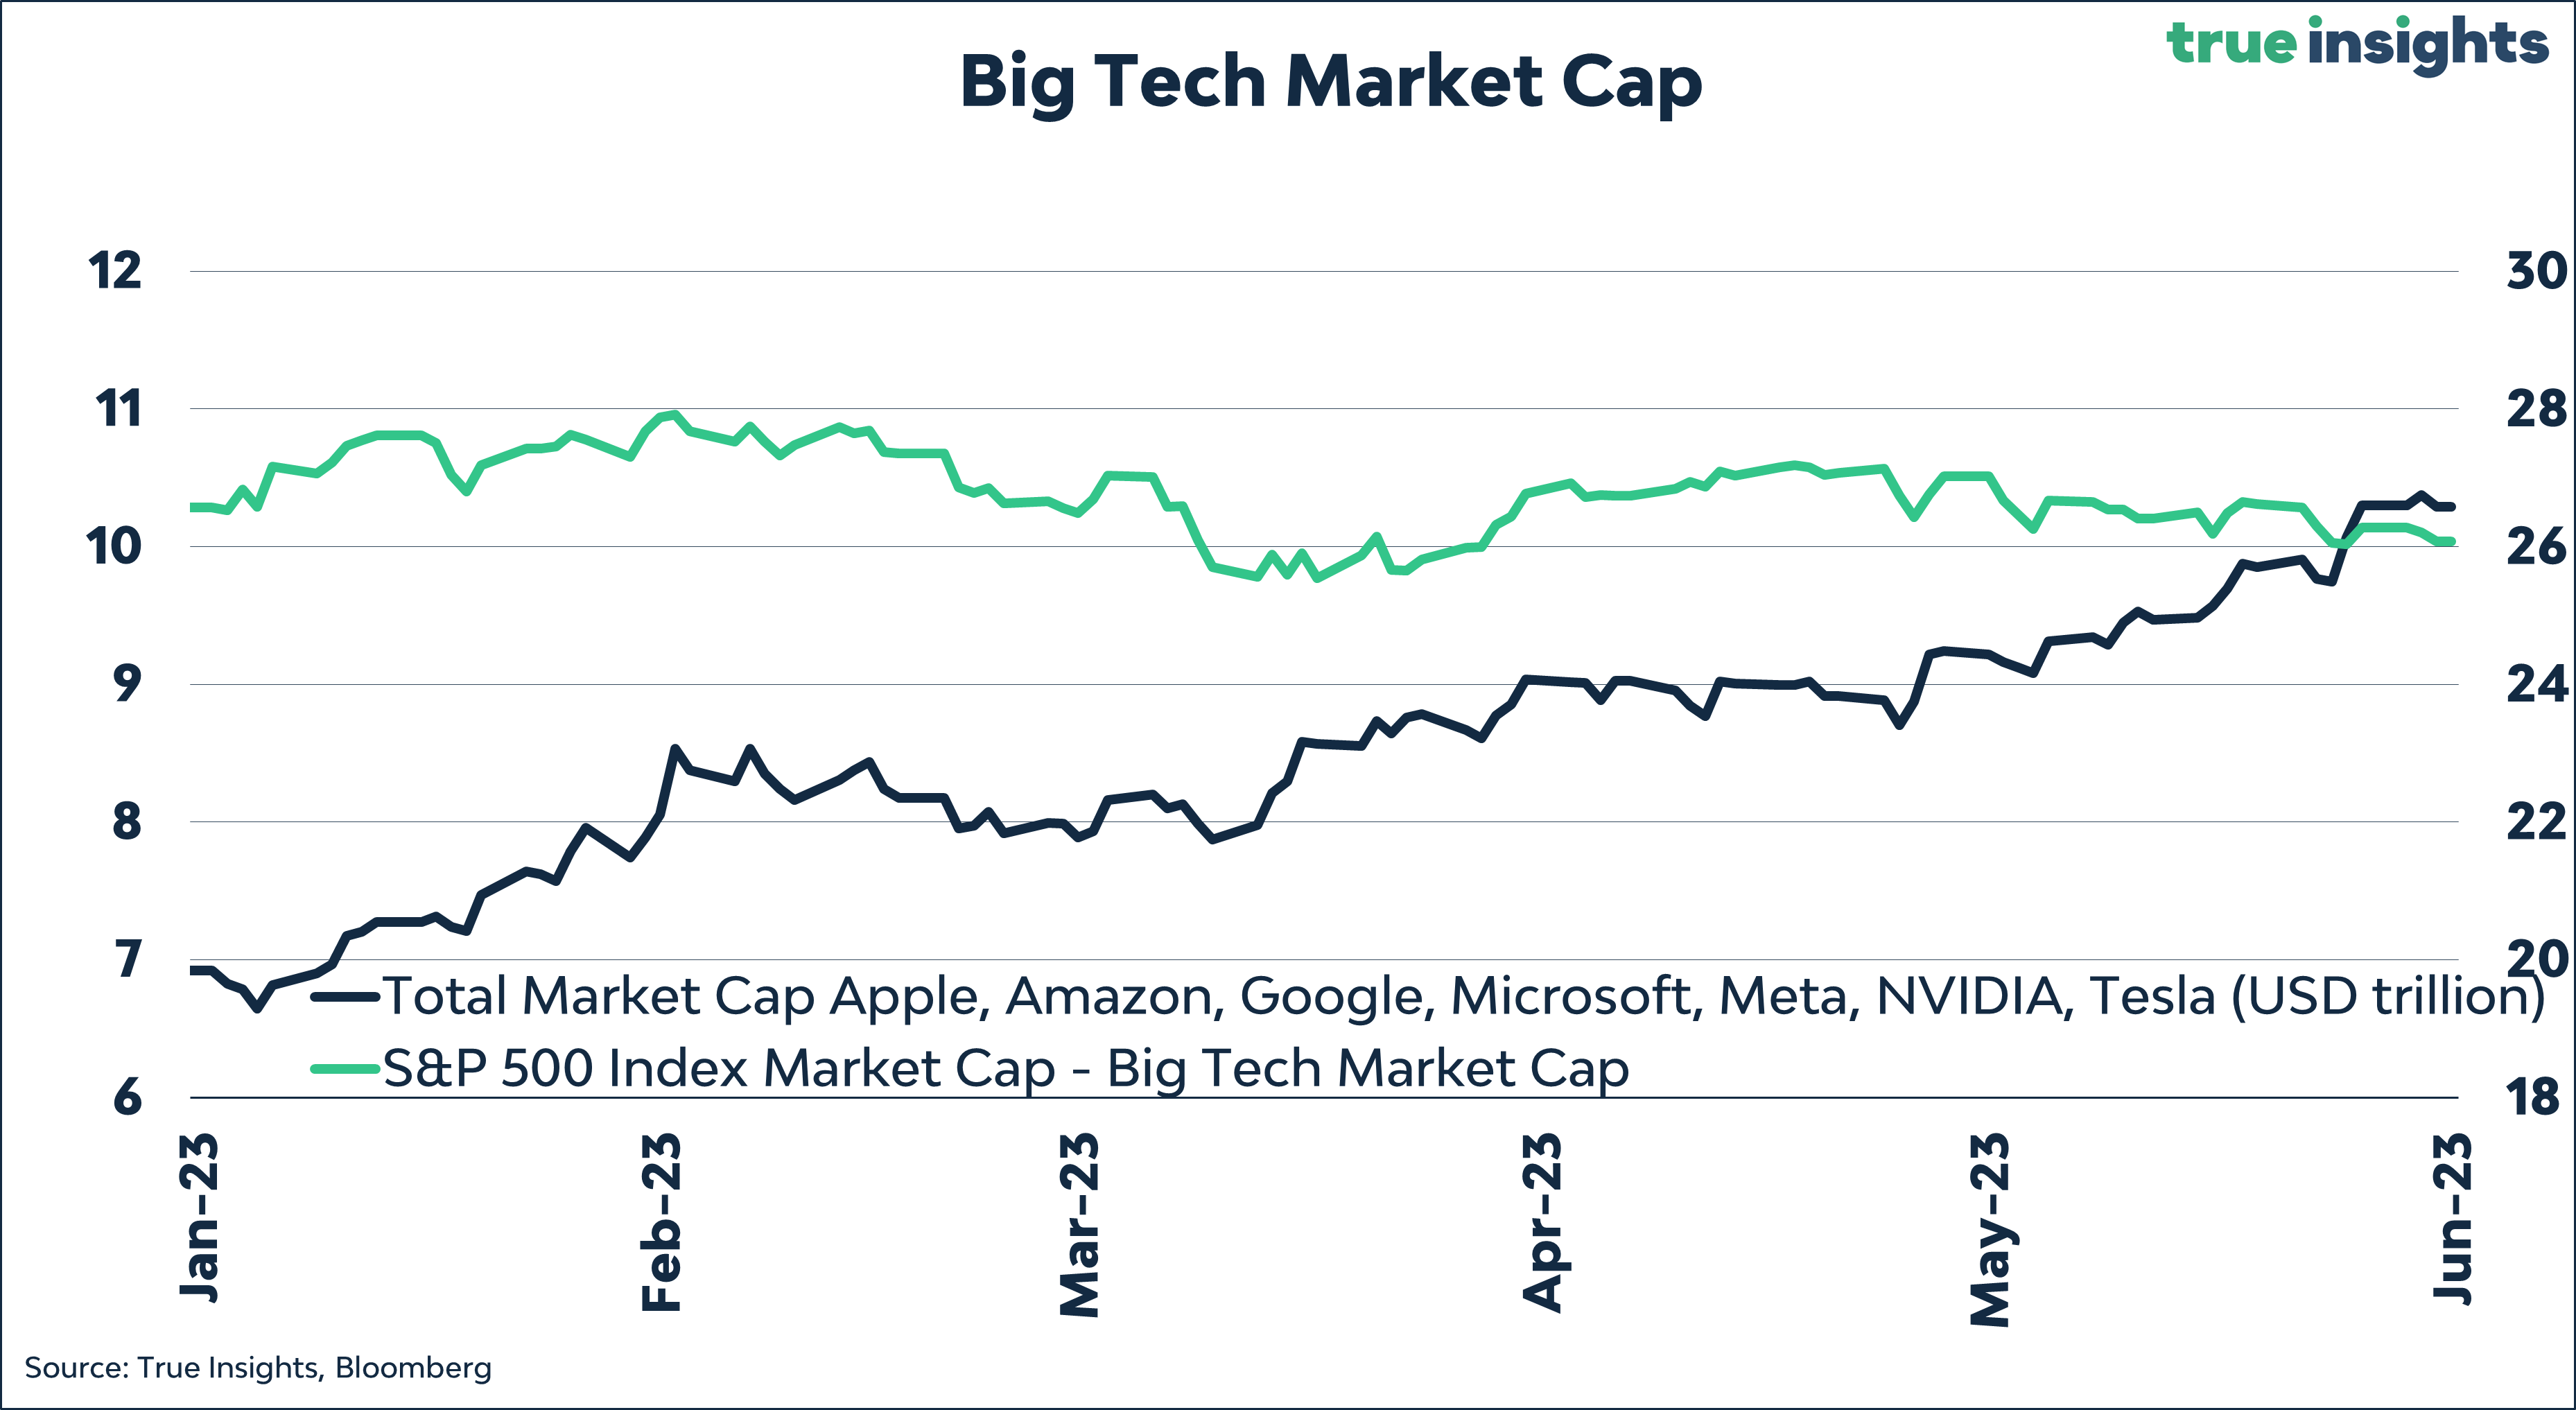
Bad Breadth

We believe investors are mistaking a bubble for what is really bad breadth. Currently, the five largest US stocks account for 24% of the total market capitalization of the S&P 500 Index. Additionally, only 35% of all NASDAQ stocks are trading above their respective averages, excluding the Big Tech companies. Furthermore, excluding BigTech, the market capitalization of all other stocks in the S&P 500 Index has experienced a decline of 2% this year. These figures highlight the concentration of market value in just a few major stocks.
Valuation
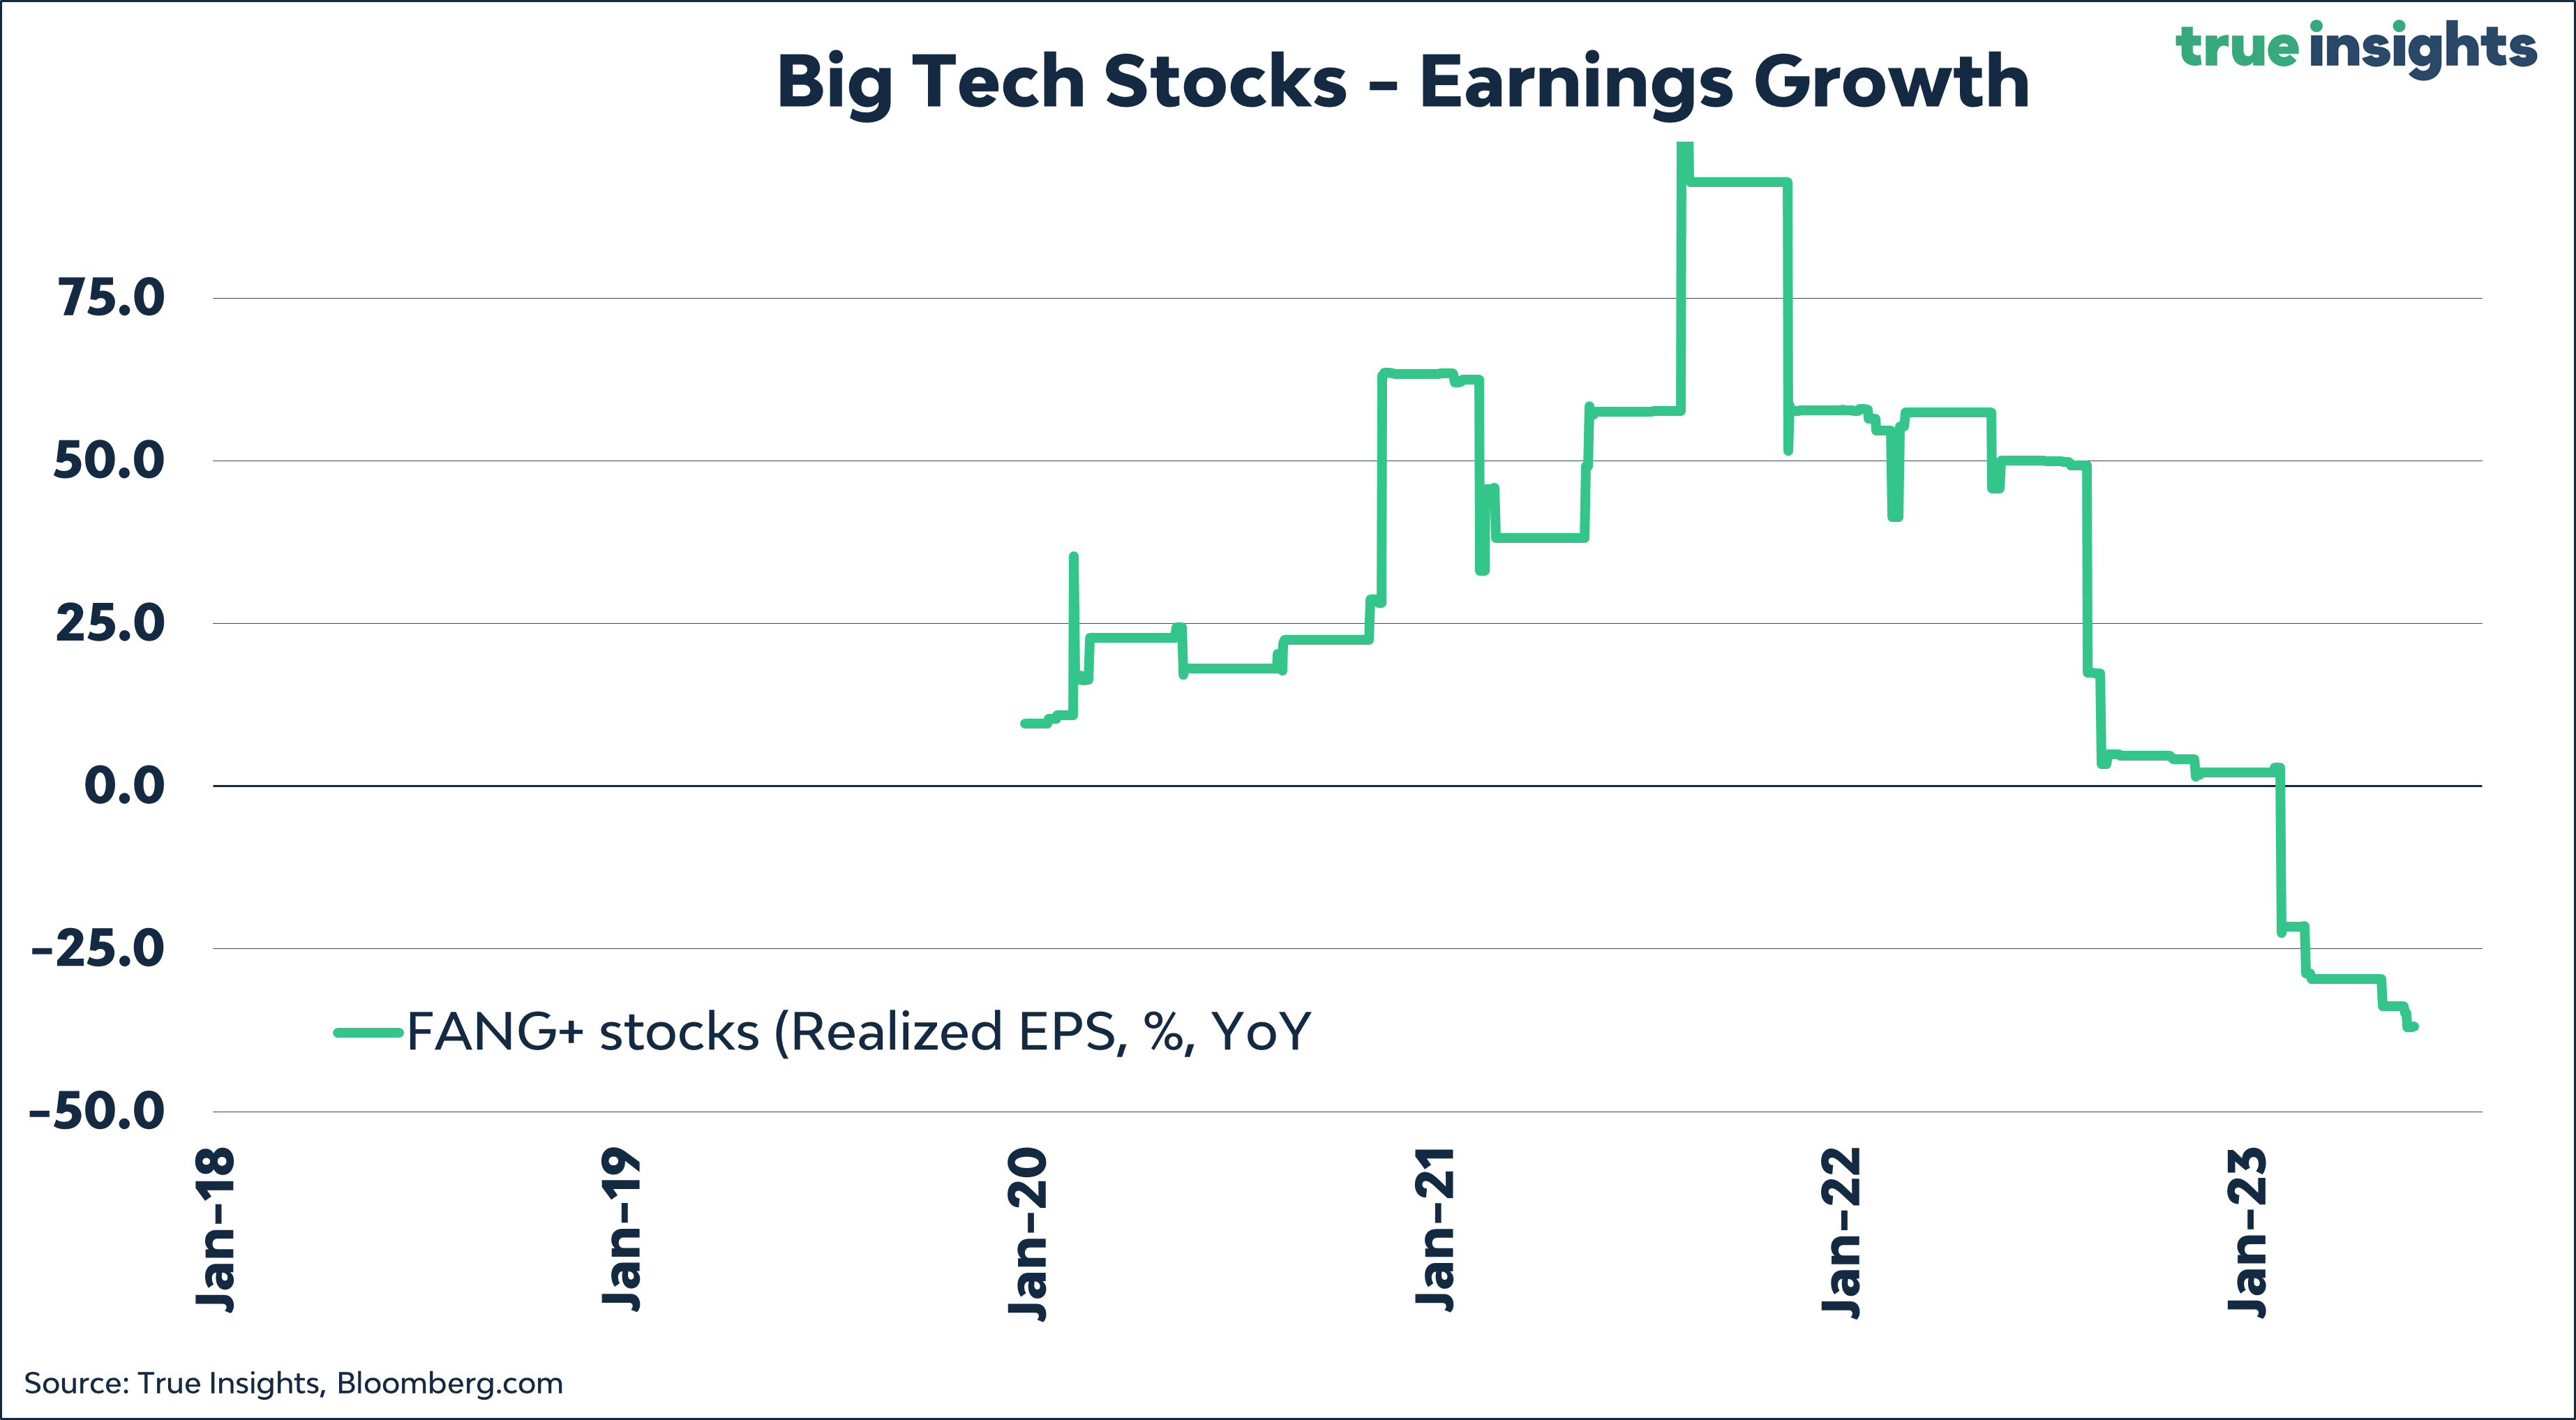
FANG+
As the AI revolution intensifies, market concentration has risen dramatically, causing a steep rise in the valuation of Big Tech equities. Below is a chart depicting the NYSE FANG+ index’s (forward) P/E ratio, comprising Alphabet, Amazon, AMD, Apple, Meta, Microsoft, Netflix, NVIDIA, Snowflake, and Tesla.
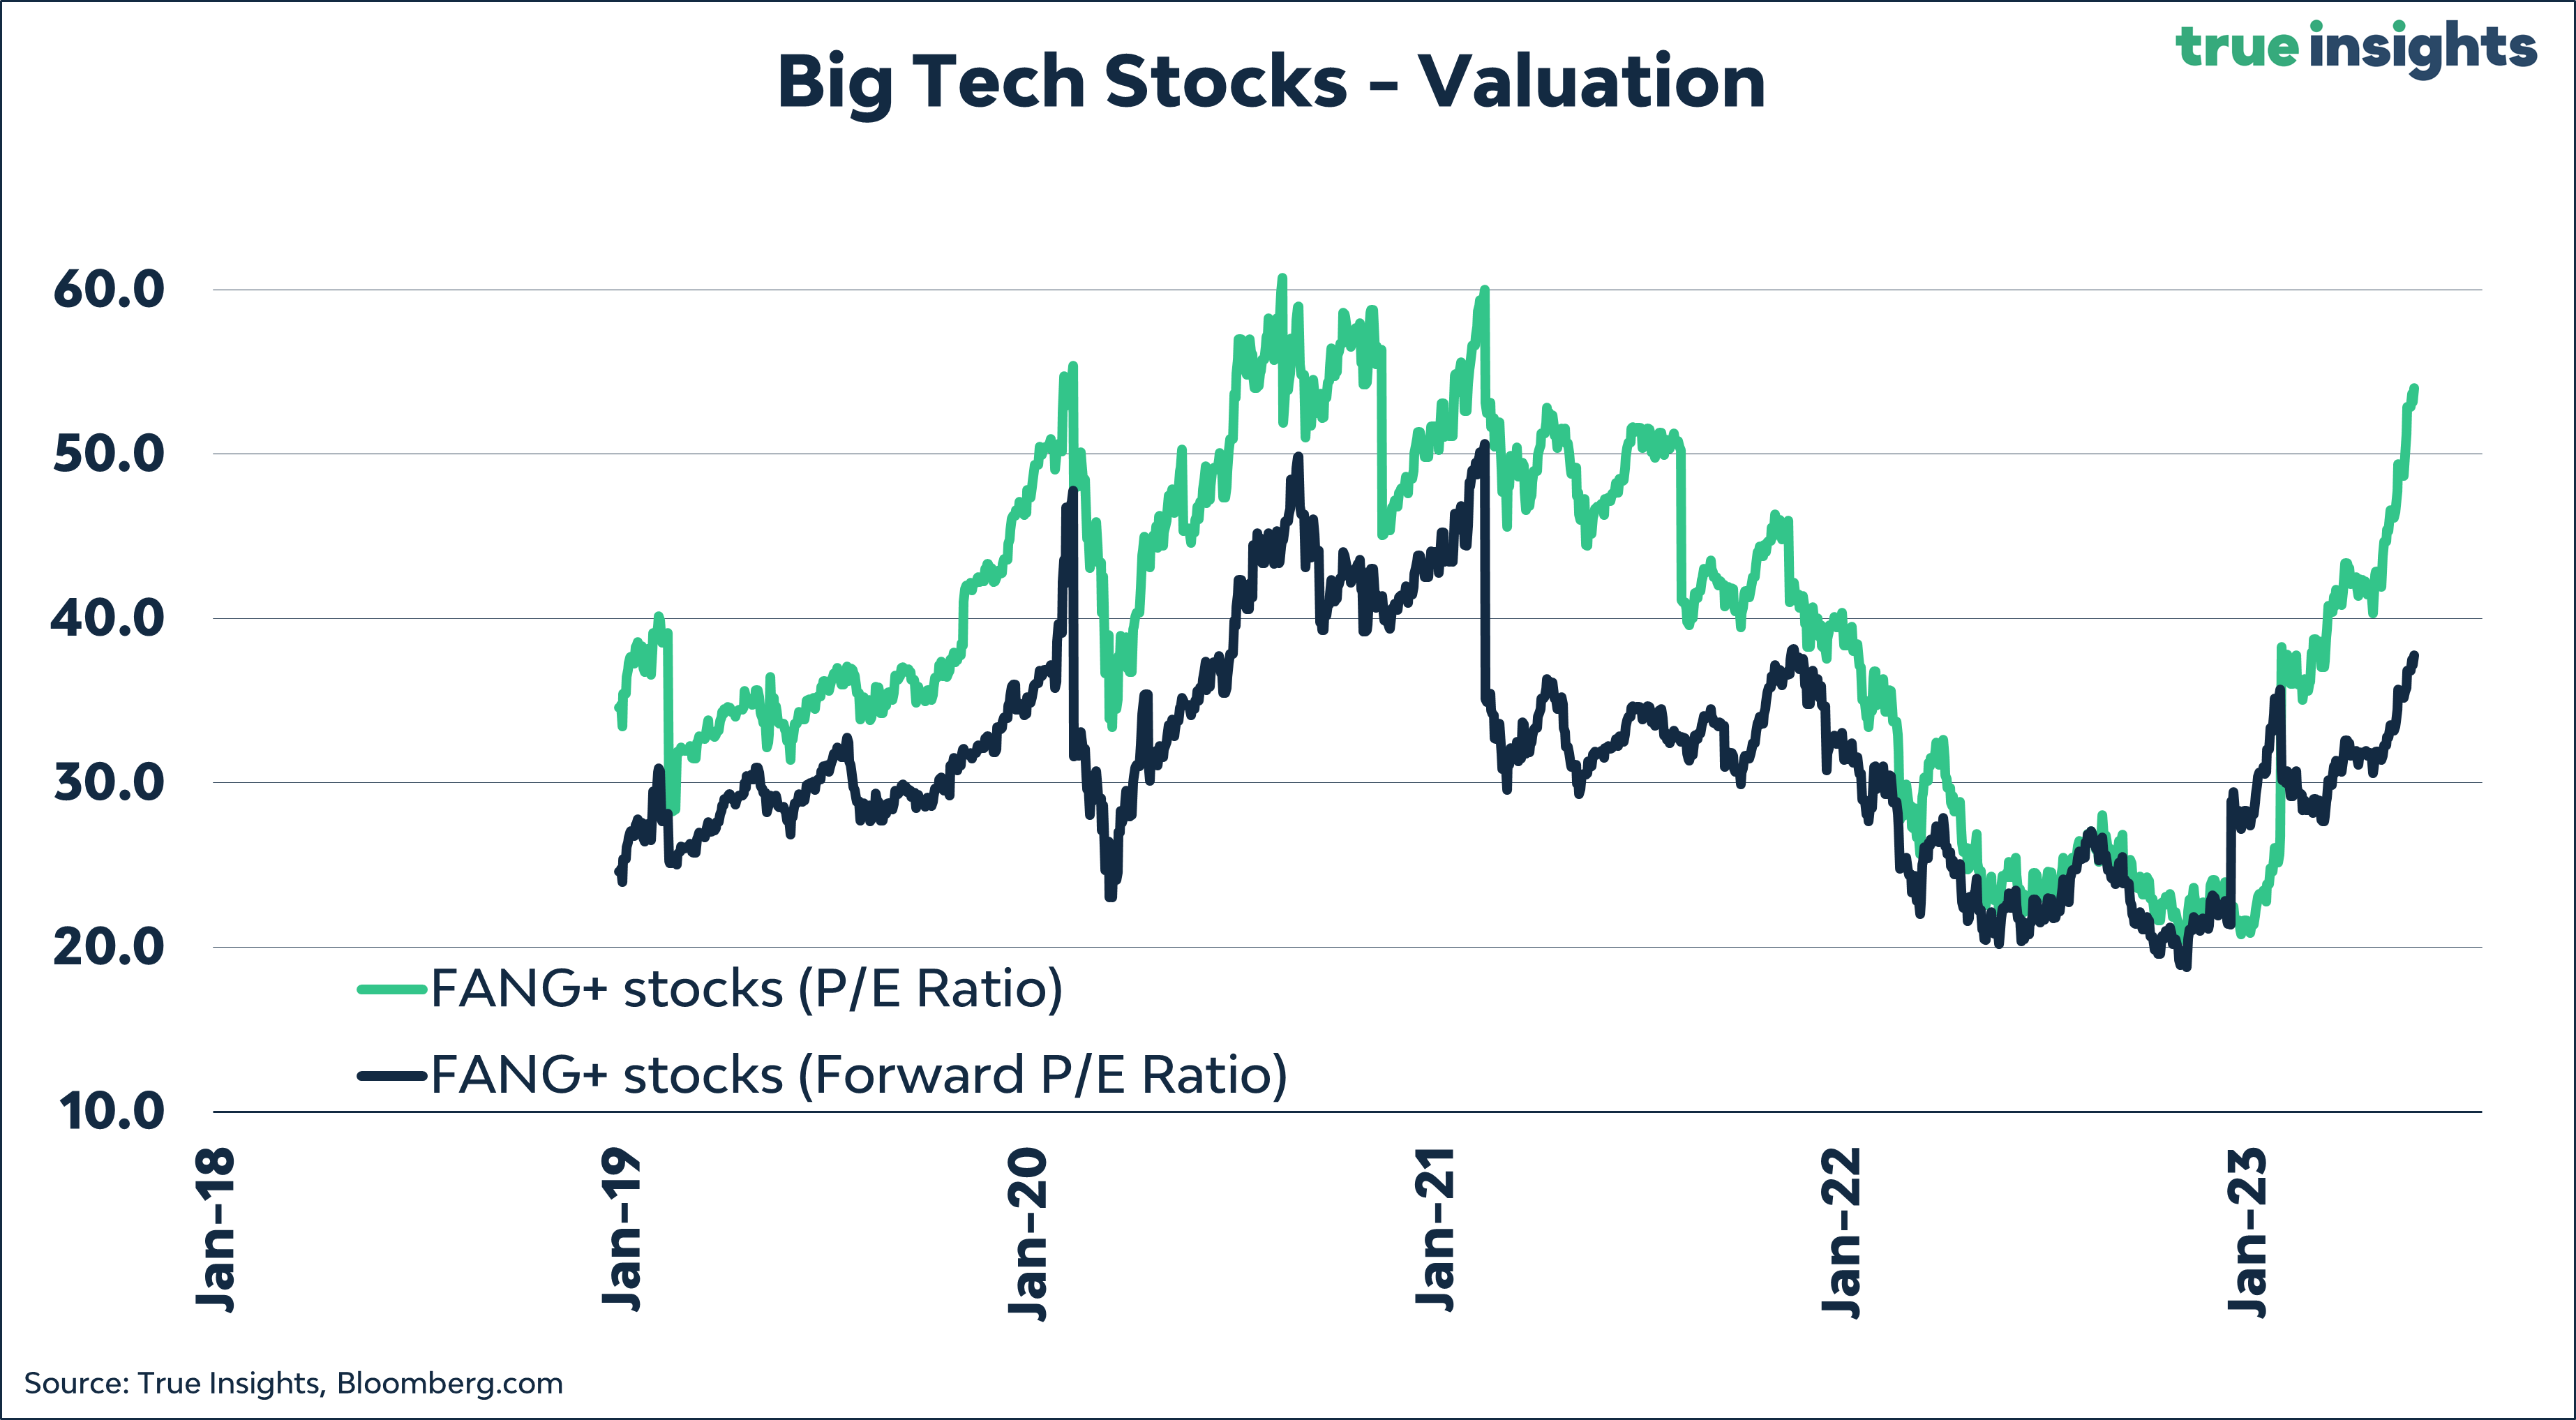
The next chart shows the realized earnings growth of these NYSE FANG+ stocks. Just one question applies here: What could go wrong?
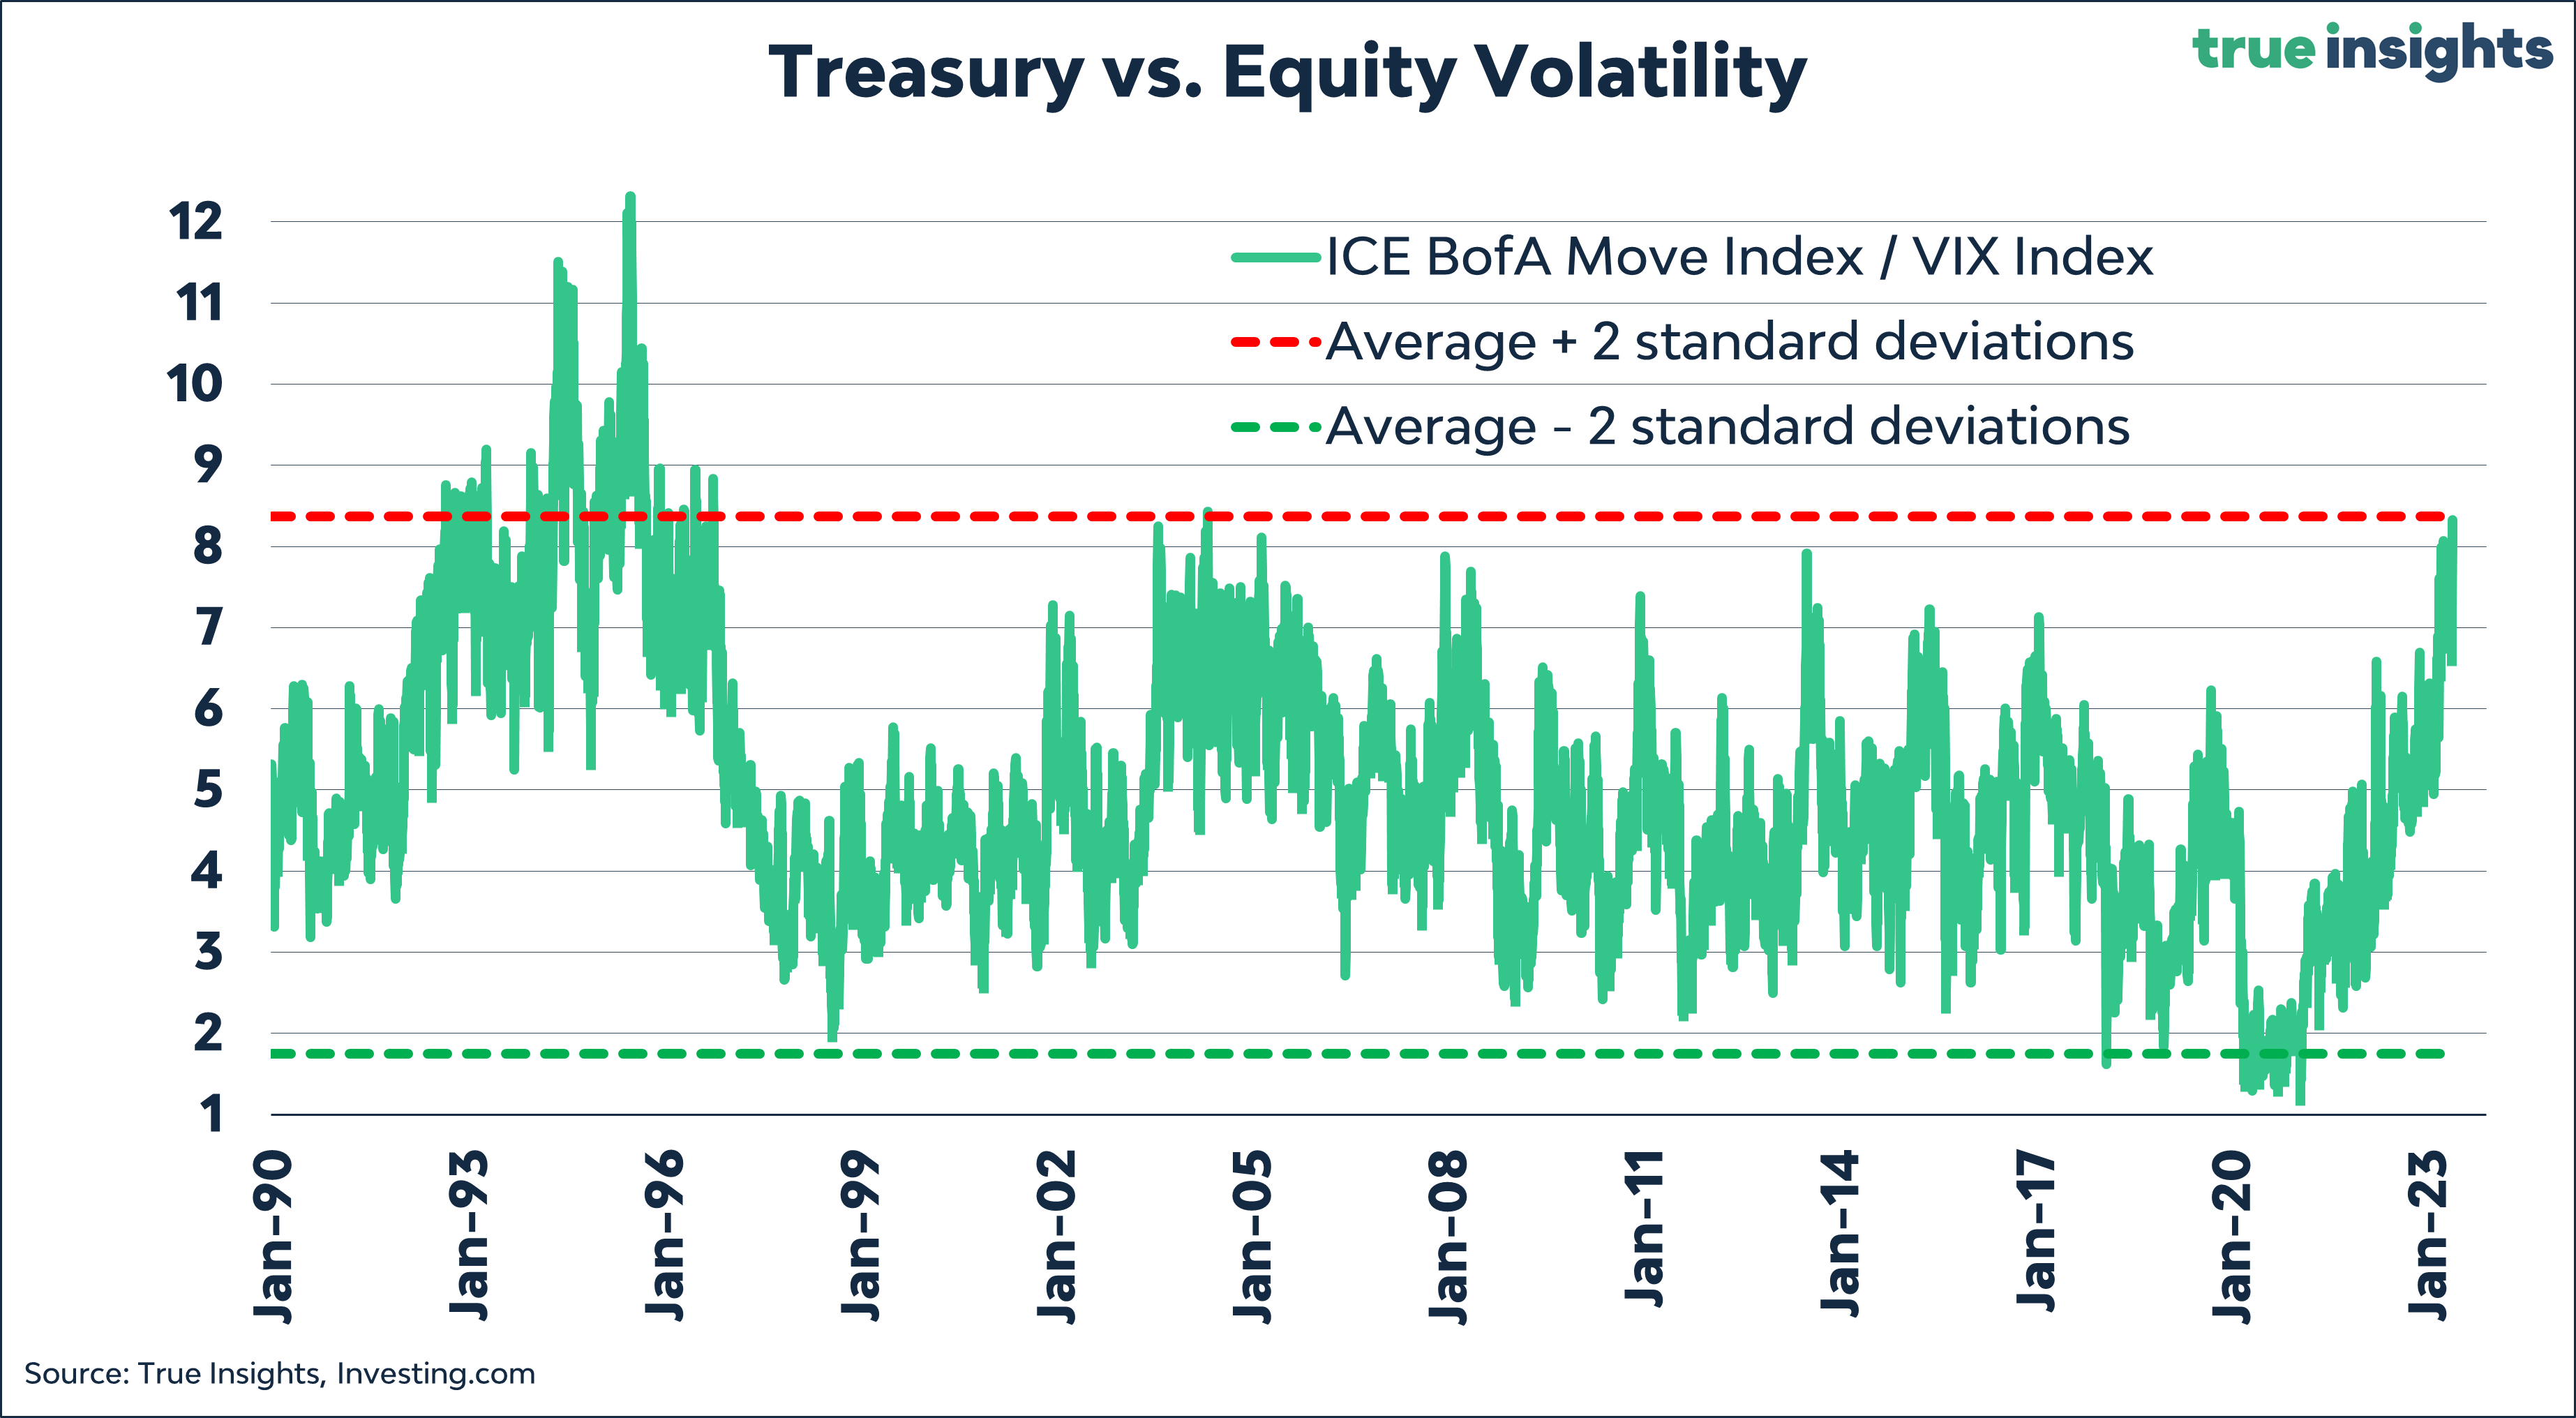
Watching that MOVE Index again
The MOVE/VIX ratio hit 8.3 this week, its highest level since 2005, and nearly two standard deviations above its long-term average.
Below are the key takeaways from our analysis of the returns on equities relative to bonds when the MOVE/VIX ratio is at (very) elevated levels.
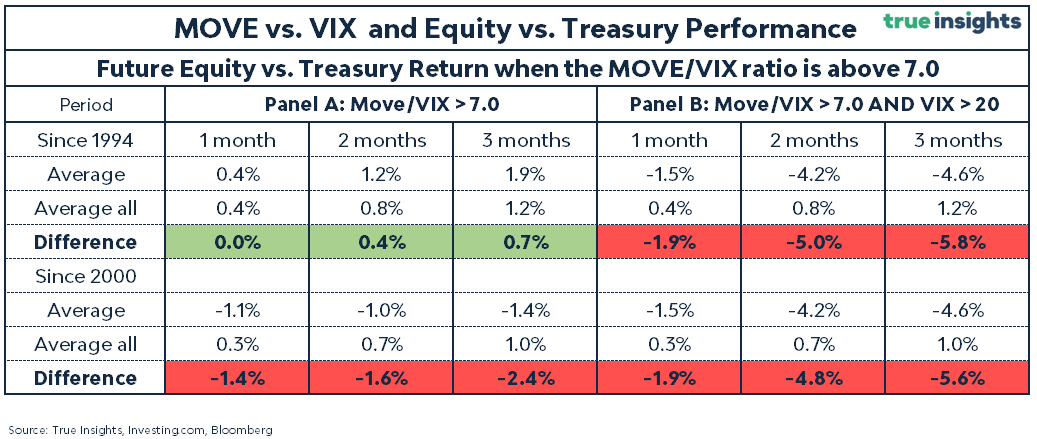
Panel A demonstrates that starting in 1994, on average, equities have exhibited modest positive relative returns over Treasuries when the MOVE/VIX ratio exceeds 7.0.
However, excluding the low equity volatility period of 1993-1997 starting in 2000, the S&P 500 Index has consistently underperformed the US Treasury Index after the MOVE/VIX ratio surpassed 7.0. This underperformance ranges from 1.4% to 2.4% over one to three months.
In Panel B – when the MOVE Index had to become extremely high to push the MOVE/VIX ratio above 7.0 given the VIX threshold of 20 – the outlook for equities gets outright unfavorable. On average, US equities have trailed US Treasuries by 1.9% in the first month following the breach of the 7.0 level by the MOVE/VIX Index. This underperformance intensifies over the three-month period, reaching nearly 6.0% (5.8% since 1994 and 5.6% since 2000).
Markets
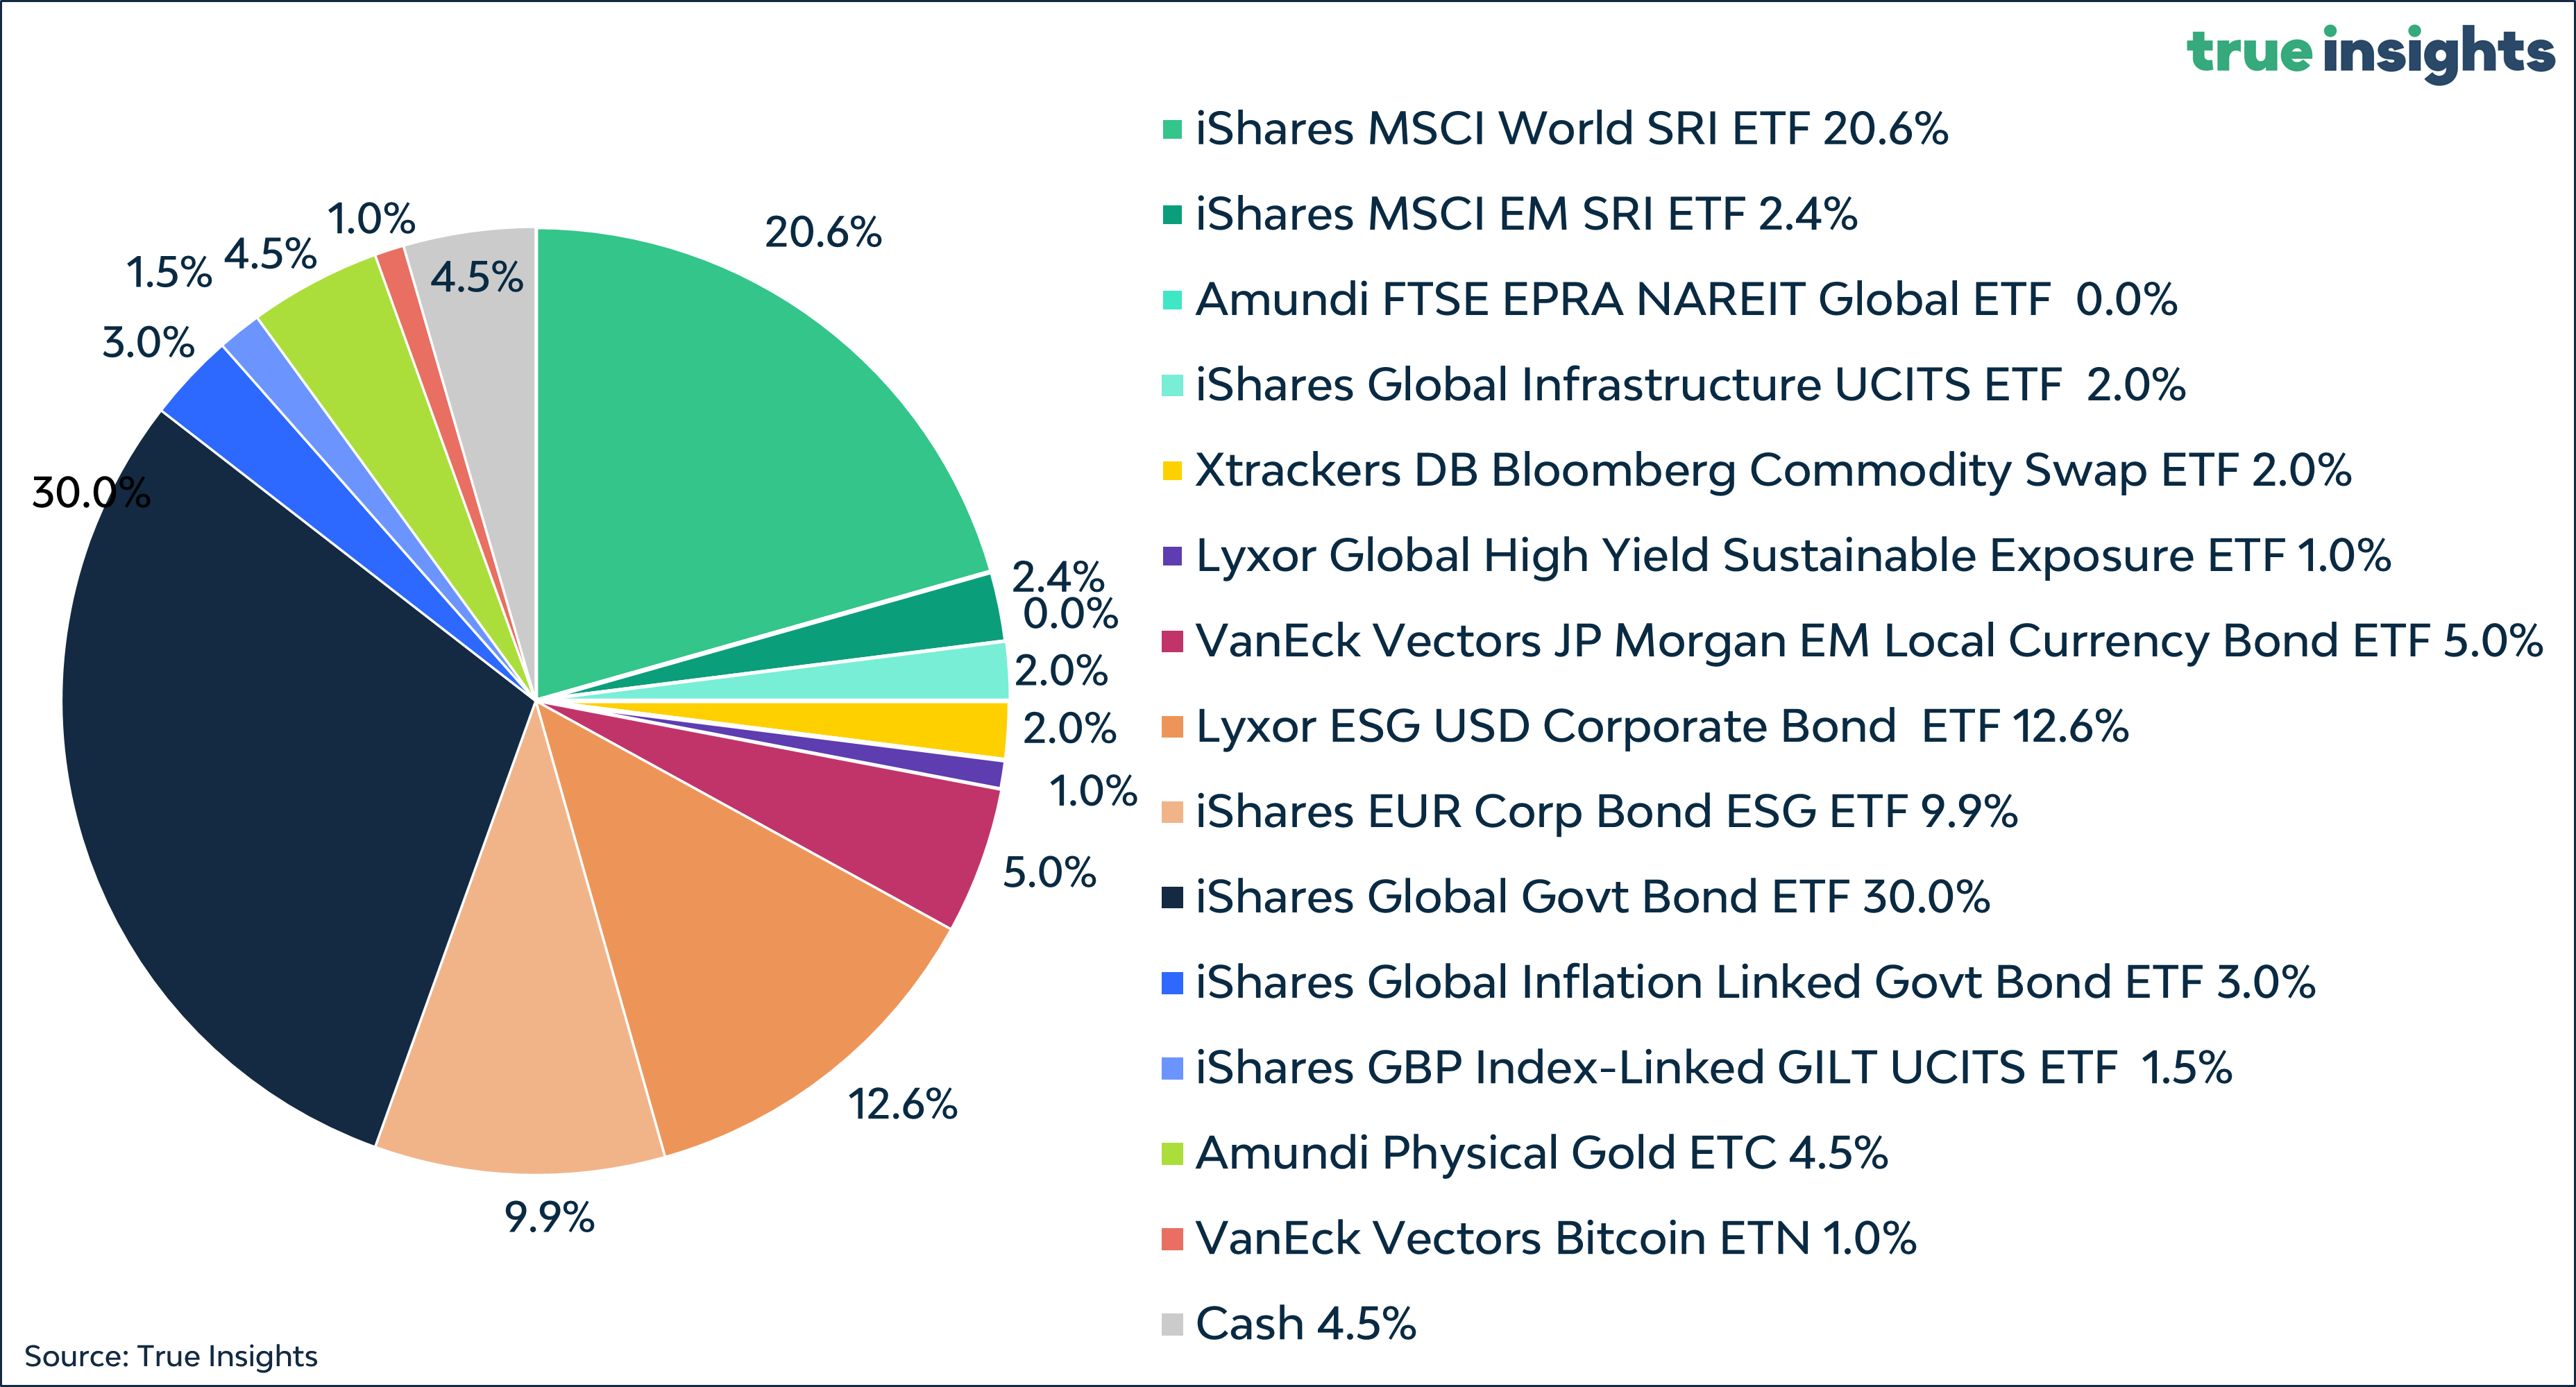
Active Weights
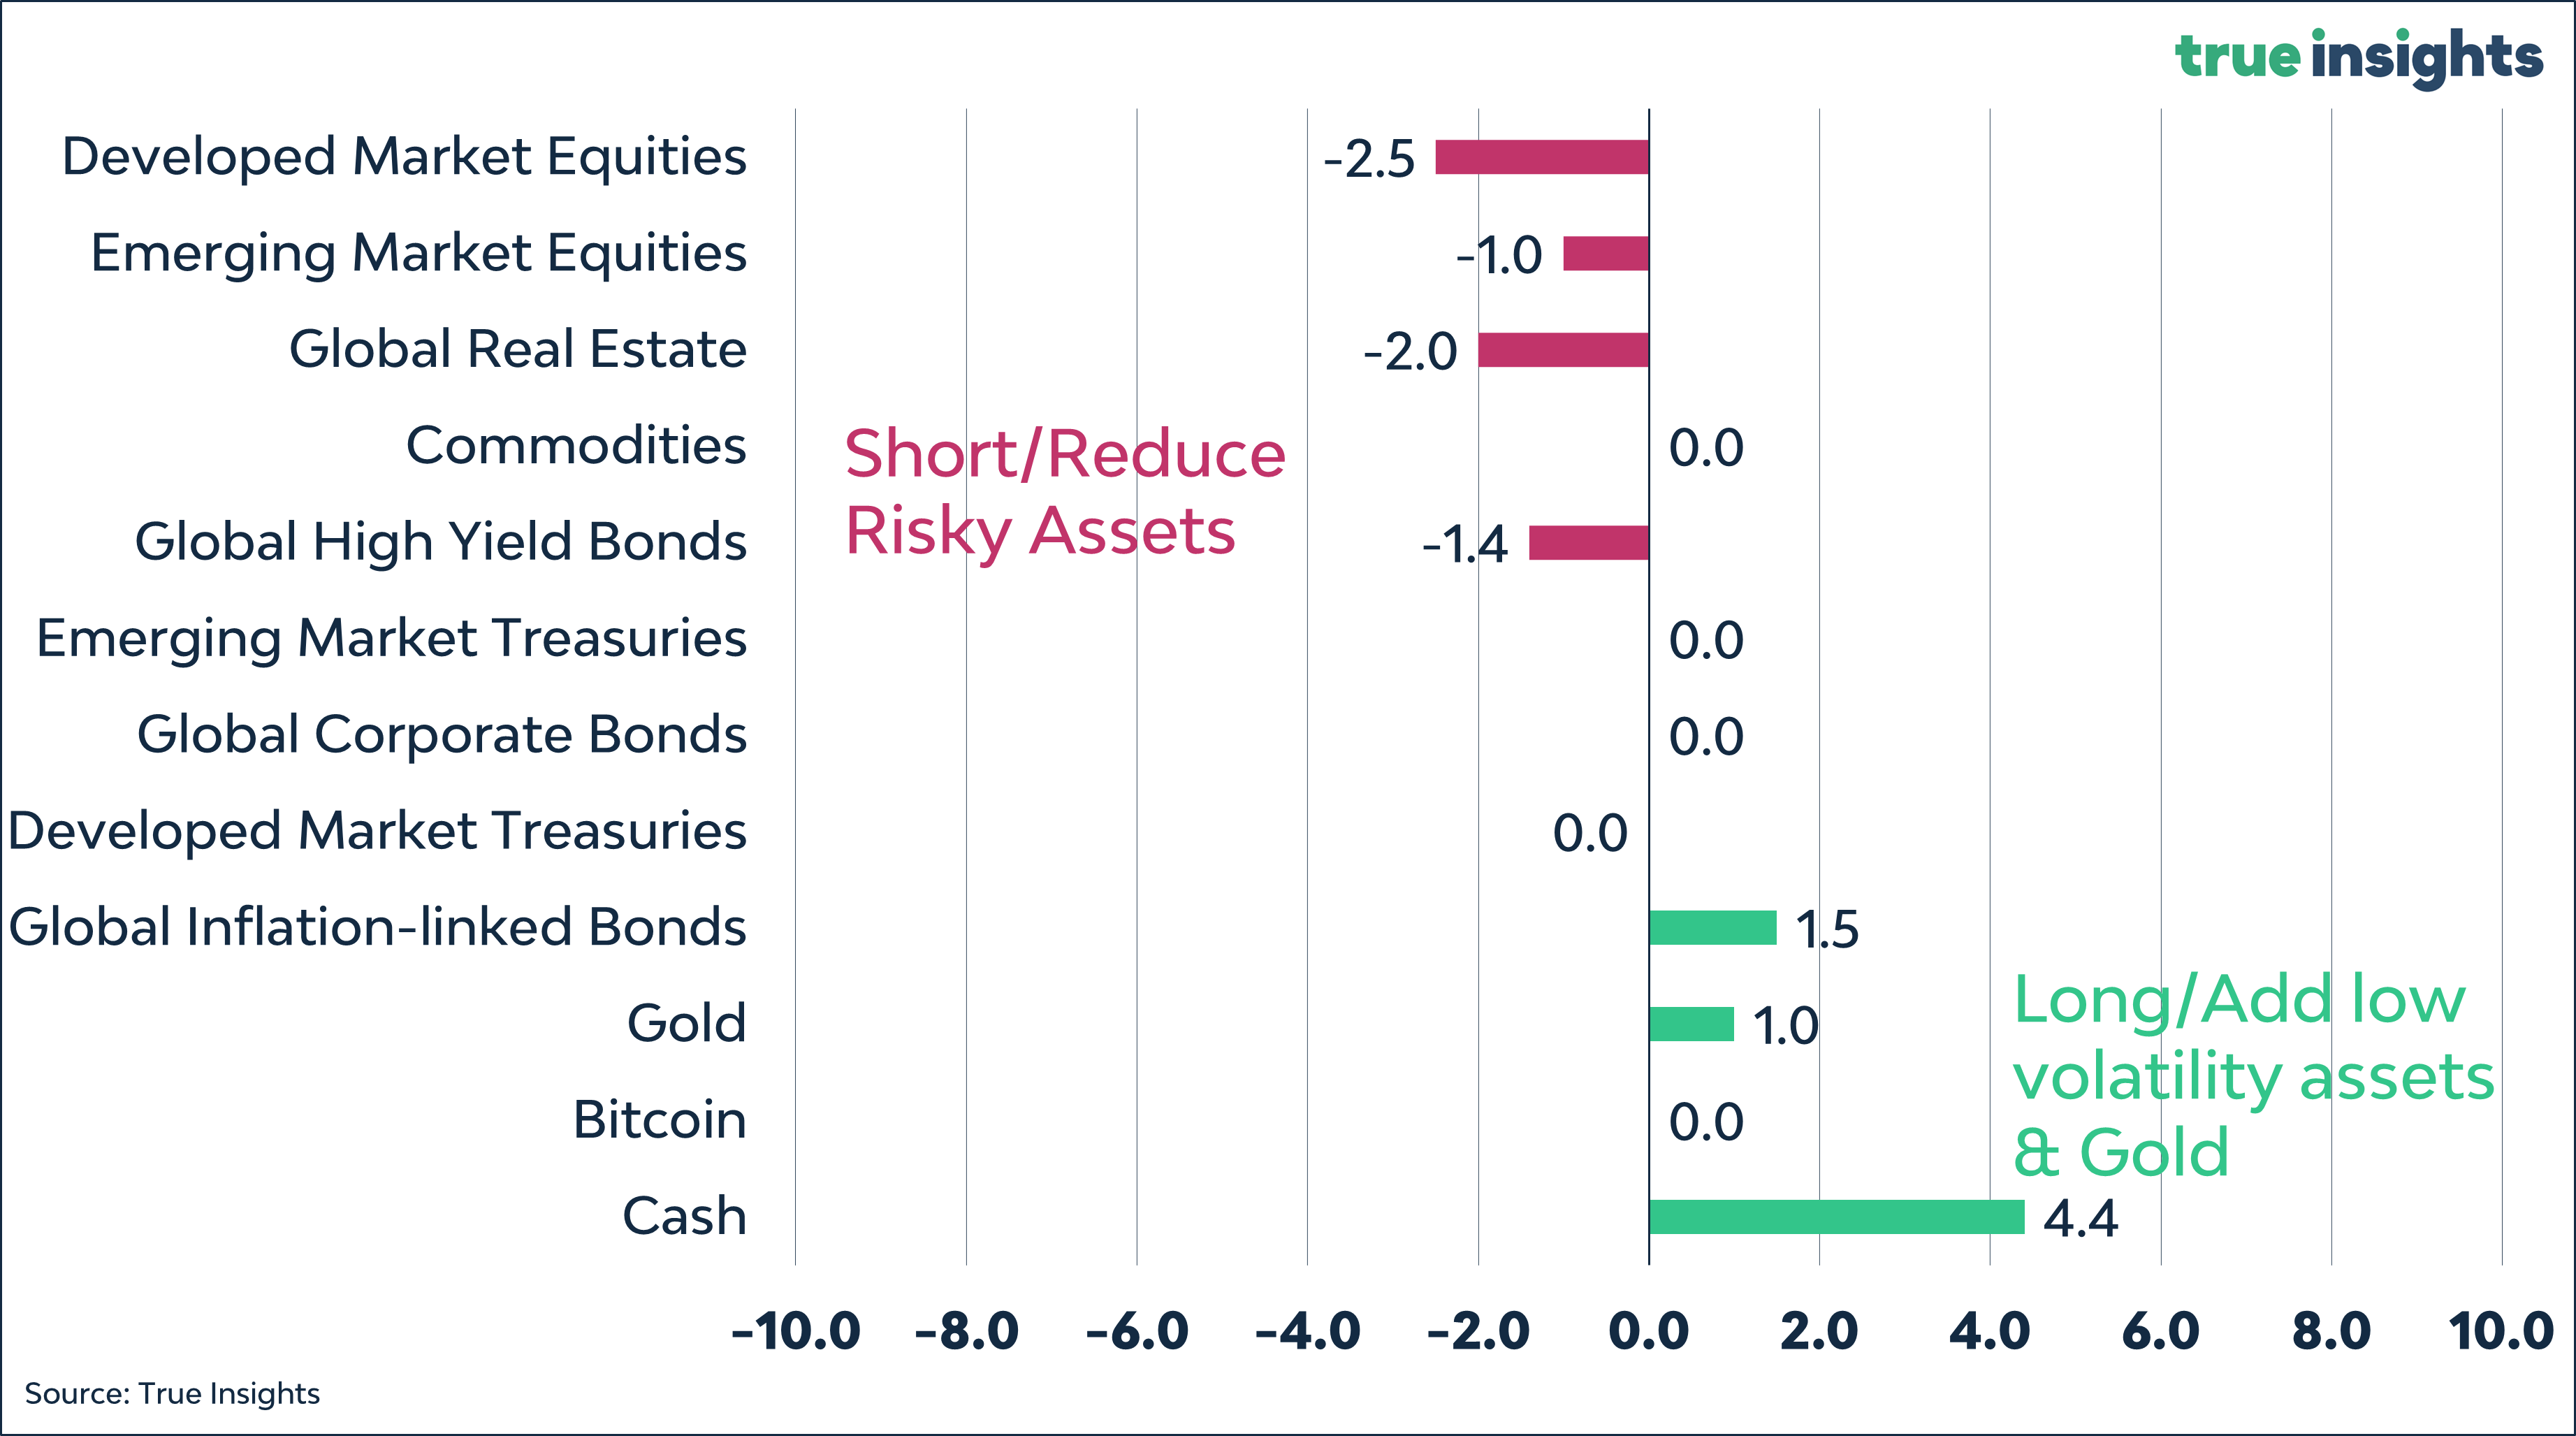
BALANCED PORTFOLIO
ASSET CLASS VIEWS
Developed Market Equities
We remain short/underweight Developed Market Equities. The outlook for the ISM Manufacturing Index has worsened again and remains subdued. Equity investors have been primarily focused on the direct impact of the US regional banking crisis, but tightening lending standards and refinancing increases the odds of a recession. The US yield curve also signals an elevated likelihood of a new recession. Equity market valuation has risen even as interest rates, the earnings outlook, and excess liquidity suggest otherwise. A positive for Developed Market Equities is positioning, which remains cautious on most metrics, while our Fear & Frenzy lingers in Neutral territory.
Emerging Market Equities
Emerging Market Equities are also short/underweight. First, the China reopening is mixed with the Manufacturing PMIs dropping below 50 again. In addition, commodity prices are falling, and global export growth numbers have declined. Contrary to Developed Market Equities, positioning is less downbeat. Valuation remains a small positive.
Global Real Estate
Global Real Estate remains short/underweight. One reason are the indirect effects of the US regional banking crisis. US smaller banks represent roughly two-thirds of all Commercial Real Estate loans, creating a challenging environment for commercial property refinancing. In addition, most of the value depreciation has yet to be announced. Home values will decline further, and with the Fed aiming to keep rates high for longer, housing market activity will be low in the coming months.
Global High Yield Bonds
Global High Yield Bonds remain short/underweight. First, high yield bonds remain the only asset classes reflecting zero odds of a recession. Second, tightening lending standards indicates a quadrupling of the US high yield default rate. Third, historically, there has been a strong correlation between high yield and CMBS spreads, which did widen significantly in recent months.
Global Corporate Bonds
Global Corporate Bonds are neutral. The asset class does (finally) reflect some likelihood of a recession, albeit limited. Compared to tighter lending standards, spreads are low. However, should Treasury yields drop significantly due to a recession, Global Corporate Bonds will likely outperform other asset classes.
Developed Market Treasuries
For the first time in more than two years, our ‘fair value’ estimate of the 10-year US Treasury yield tops the current 10-year yield. From a valuation perspective, 10-year US Treasuries are no longer attractive. However, several macro indicators like the ISM Manufacturing Index signal Treasuries should be favored over equities. In case a US recession materializes, Developed Market Treasuries are one of the key asset classes to seek shelter.
Emerging Market Treasuries
With the repricing of Fed rate hikes, the US dollar has moved higher, confirming our neutral call on the asset class. Overall credit risk is increasing, and it would not be the first time we saw spillover effects into EM Treasuries. Developed Market Treasuries remain neutral.
Commodities
Commodity prices have declined in recent months, reflecting slower global growth. However, the divergence in the outlook for oil is striking. In case of a recession, oil prices should decline. But with low (structural) inventories, the reshaping of energy supply chains, and a proactive OPEC, the odds of a big drawdown look muted. Longer-term supply issues related to industrial metals like Copper are also at play. Likely it requires a swift deterioration in the economic outlook to push down Commodities further. We remain neutral for now.
Global Inflation-Linked Bonds
The coming months should benefit Global Inflation-Linked Bonds if core inflation is truly sticky. Especially since inflation expectations have come down across the board. But with headline inflation coming down quickly, there’s no need to add to the asset class right now. We remain (marginally) long/overweight.
Gold
Gold has been enjoying a perfect storm. Real rates dropped while US regional bank jitters and deposit outflows benefited the key haven asset. In addition, the latest wave of the ‘end of the dollar’ stories also pushed the gold price higher. However, it would be prudent to expect that gold momentum will become less intense at some point.
Bitcoin
The recent negative correlation between Bitcoin and US regional banks is clear evidence that Bitcoin, too, has profited from collapsing US banks. In addition, it seems that Bitcoin investors have left the FTX debacle and everything around it behind. Yet, with blockchain congestion increasing because of the acceleration of ‘Bitcoin NFTs,’ there’s always the next issue. Intensified focus on the next halving, increased market liquidity, and the next economic cycle are likely catalysts to push Bitcoin higher.