

ISM Manufacturing: Zero upside left for Equities
US, Developed, and Emerging Market Equities are vulnerable, with the ISM down to 46.3.

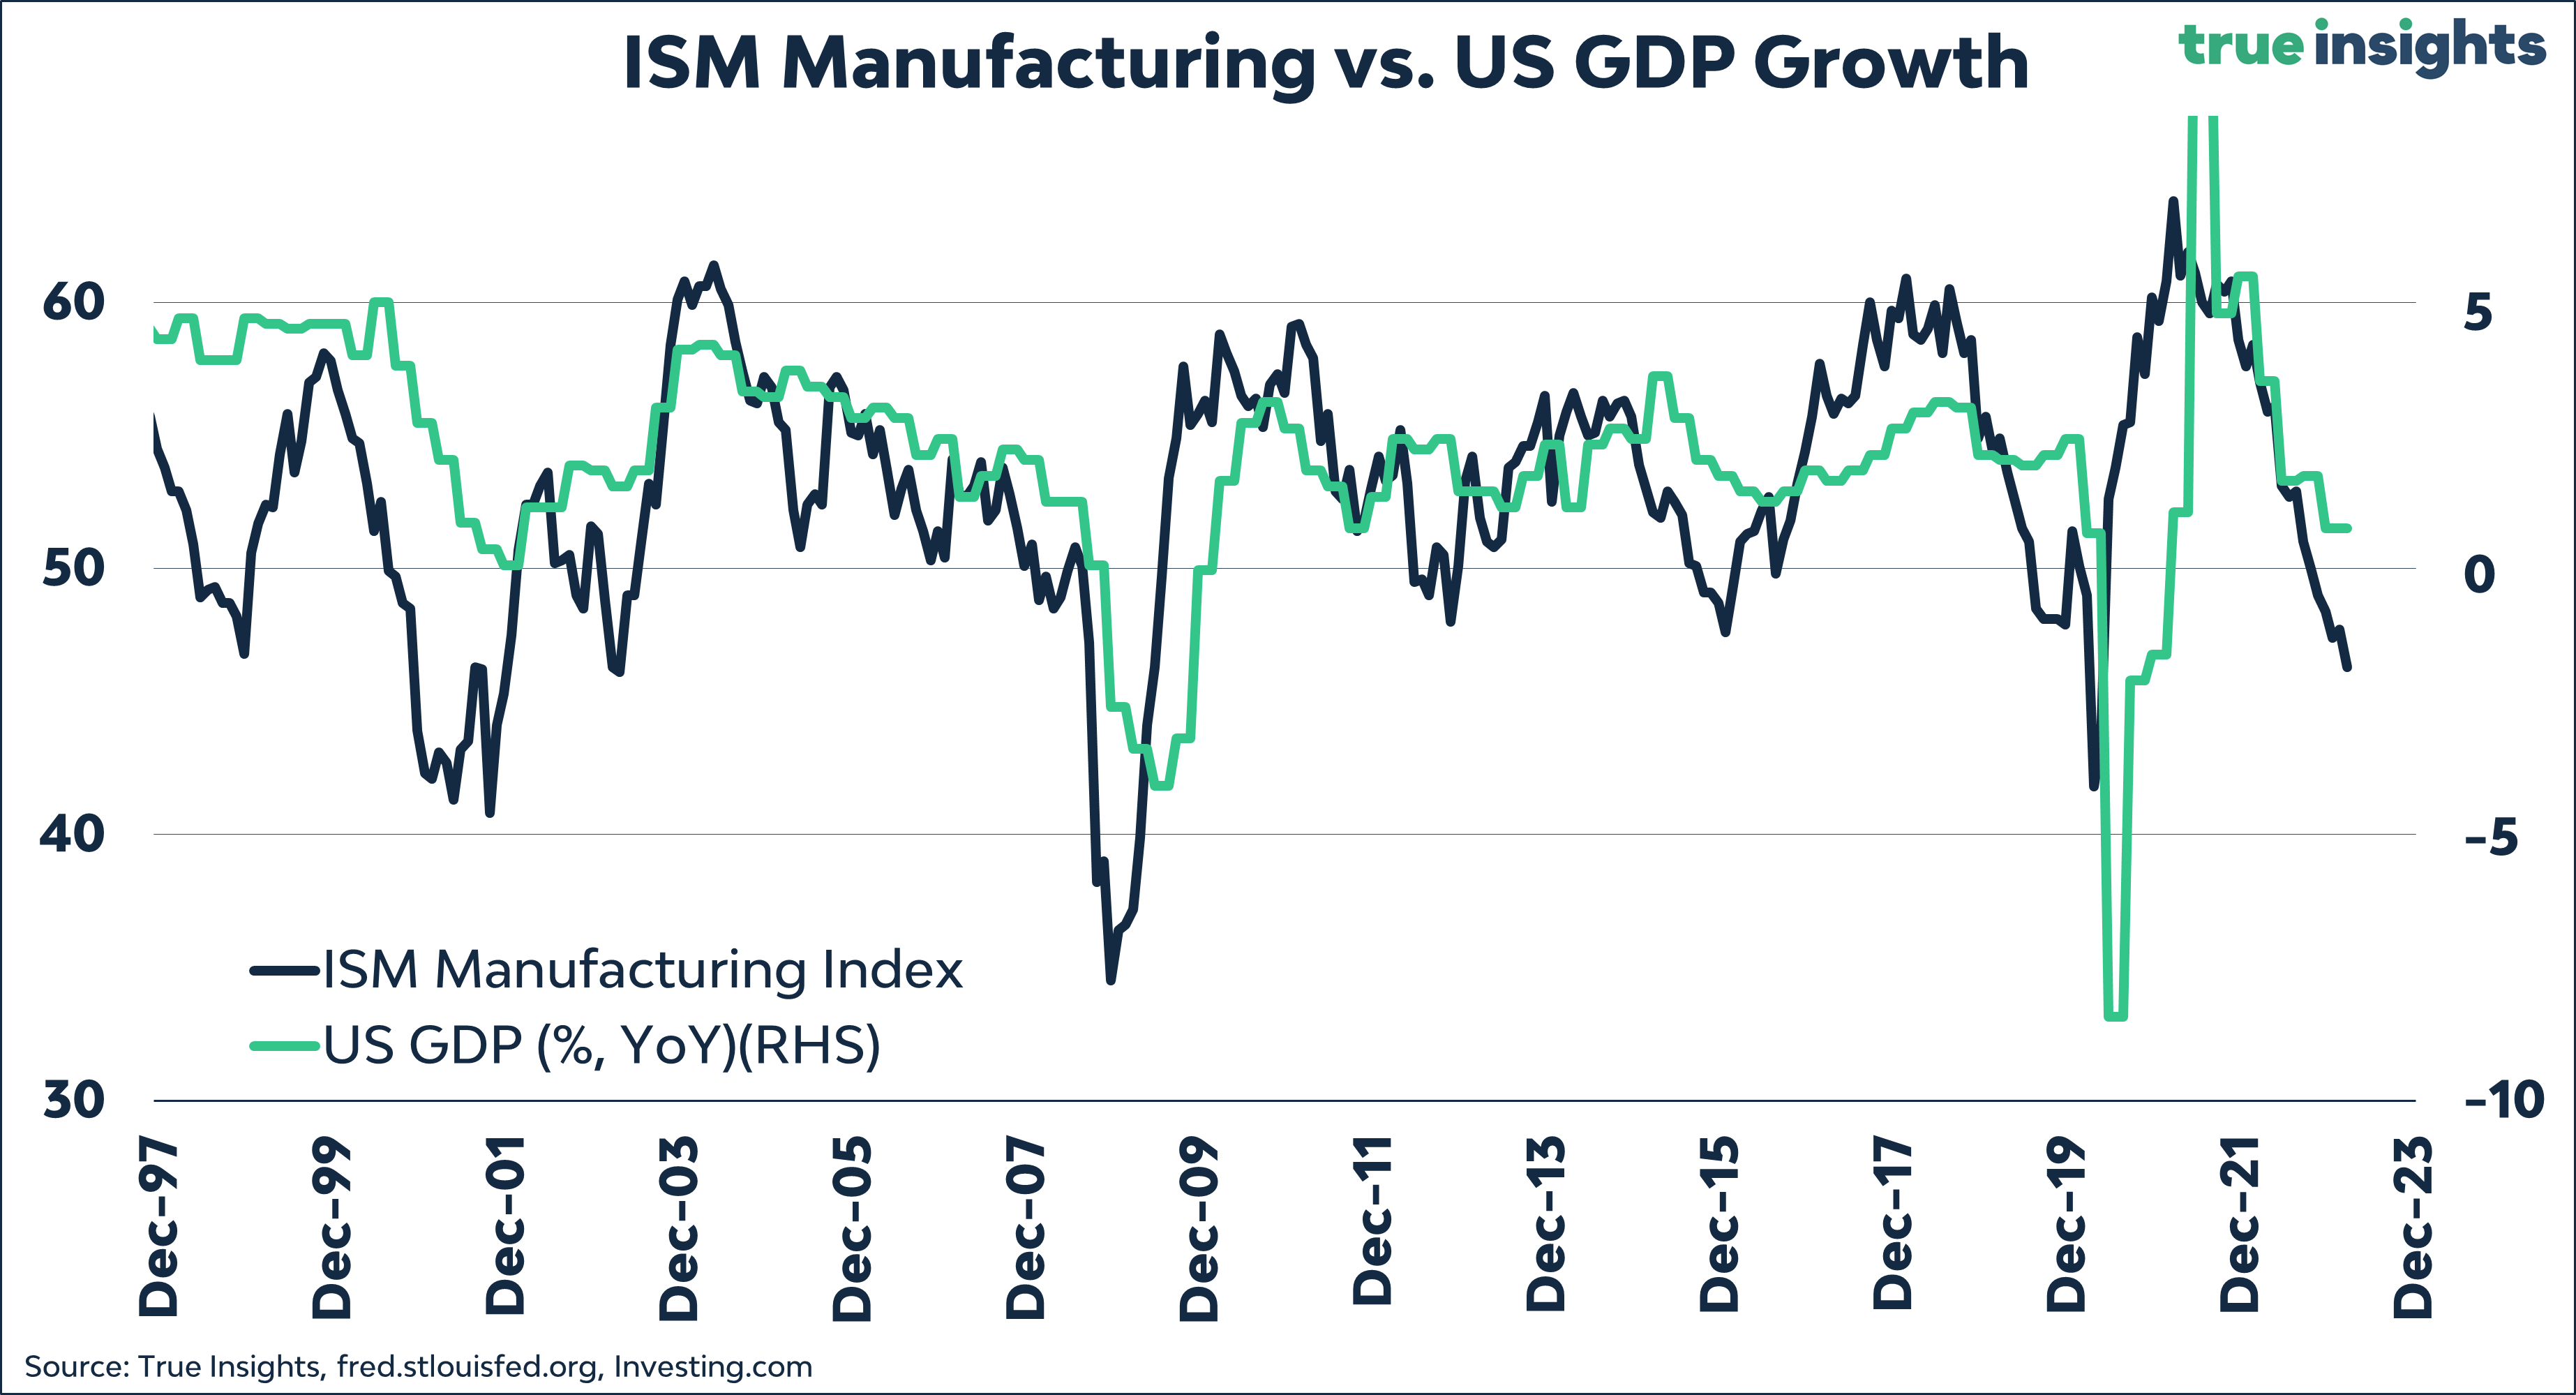
As suggested by the forward-looking indicators – ISM New Orders, NFIB Small Business Confidence, and the OECD Leading Indicator Diffusion Index – the ISM Manufacturing Index continued its downturn in March. And at 46.3, recession worries will soon start popping up again in markets. Not in the least because there is little reason to believe a near-term reversal in the ISM is in the making.
More downside
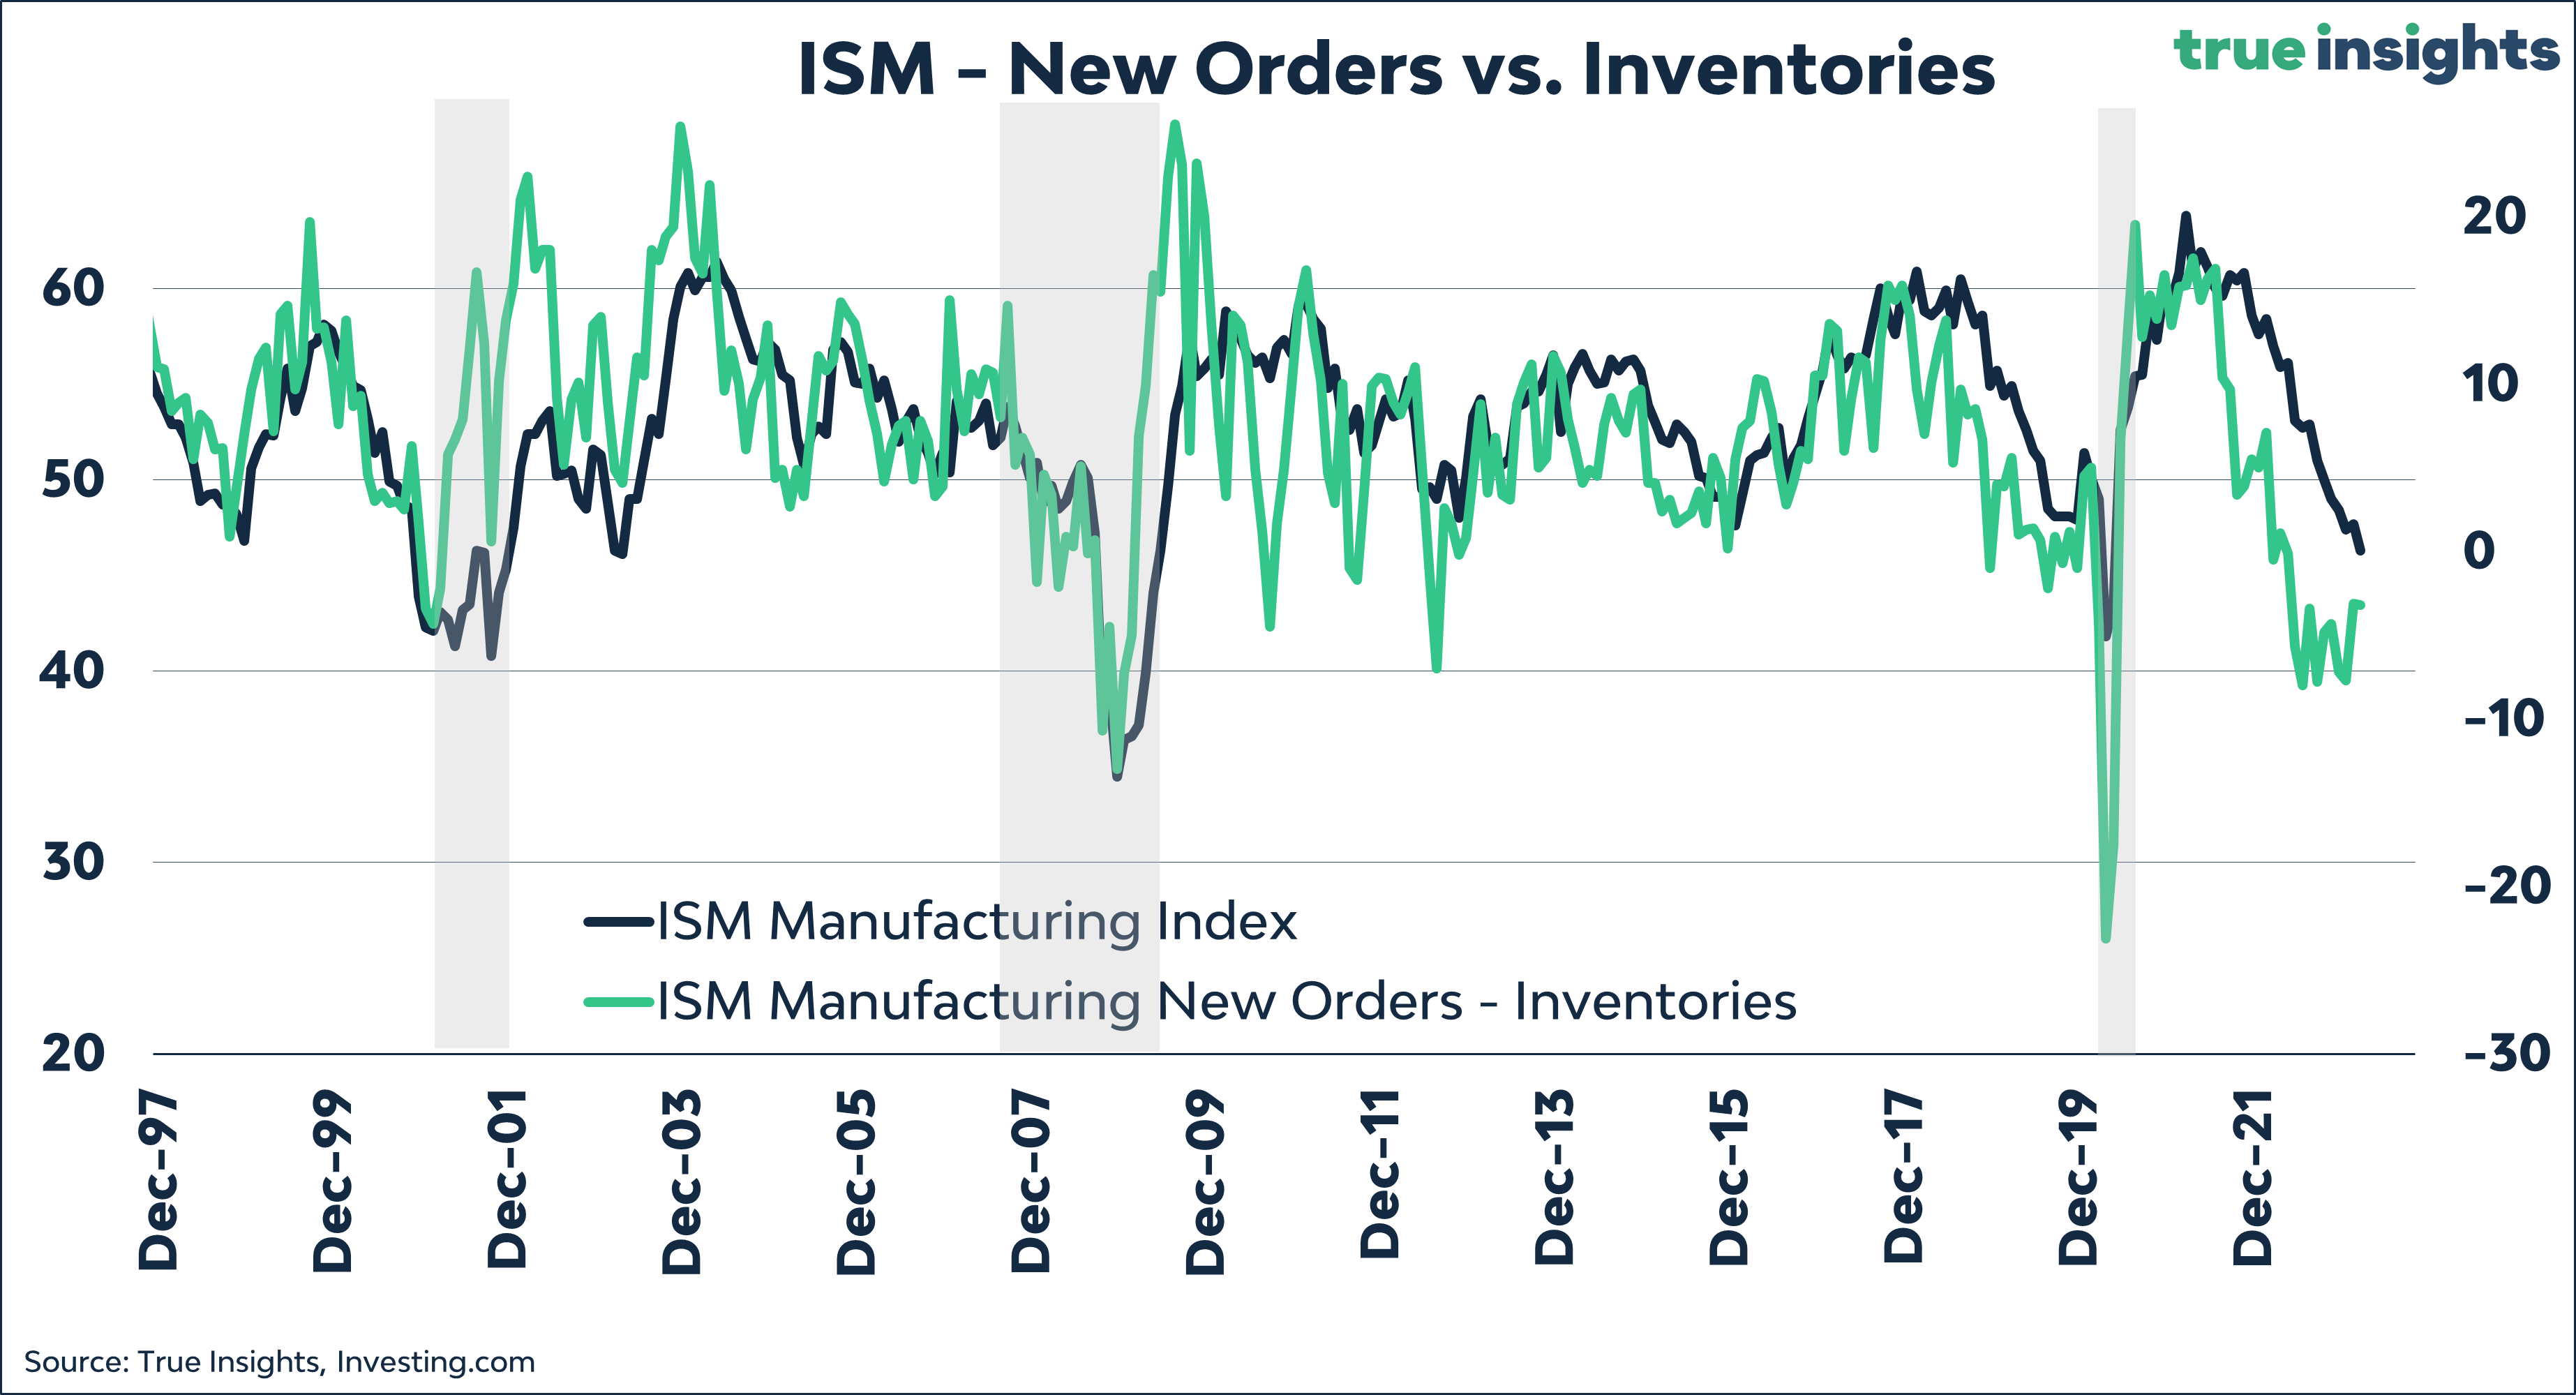
The gap between the ISM Manufacturing New Orders Index (higher = more GDP growth) and the Inventories Index (higher = less GDP growth) widened marginally in March, signaling further downside for the overall ISM Manufacturing Index.
ISM regimes
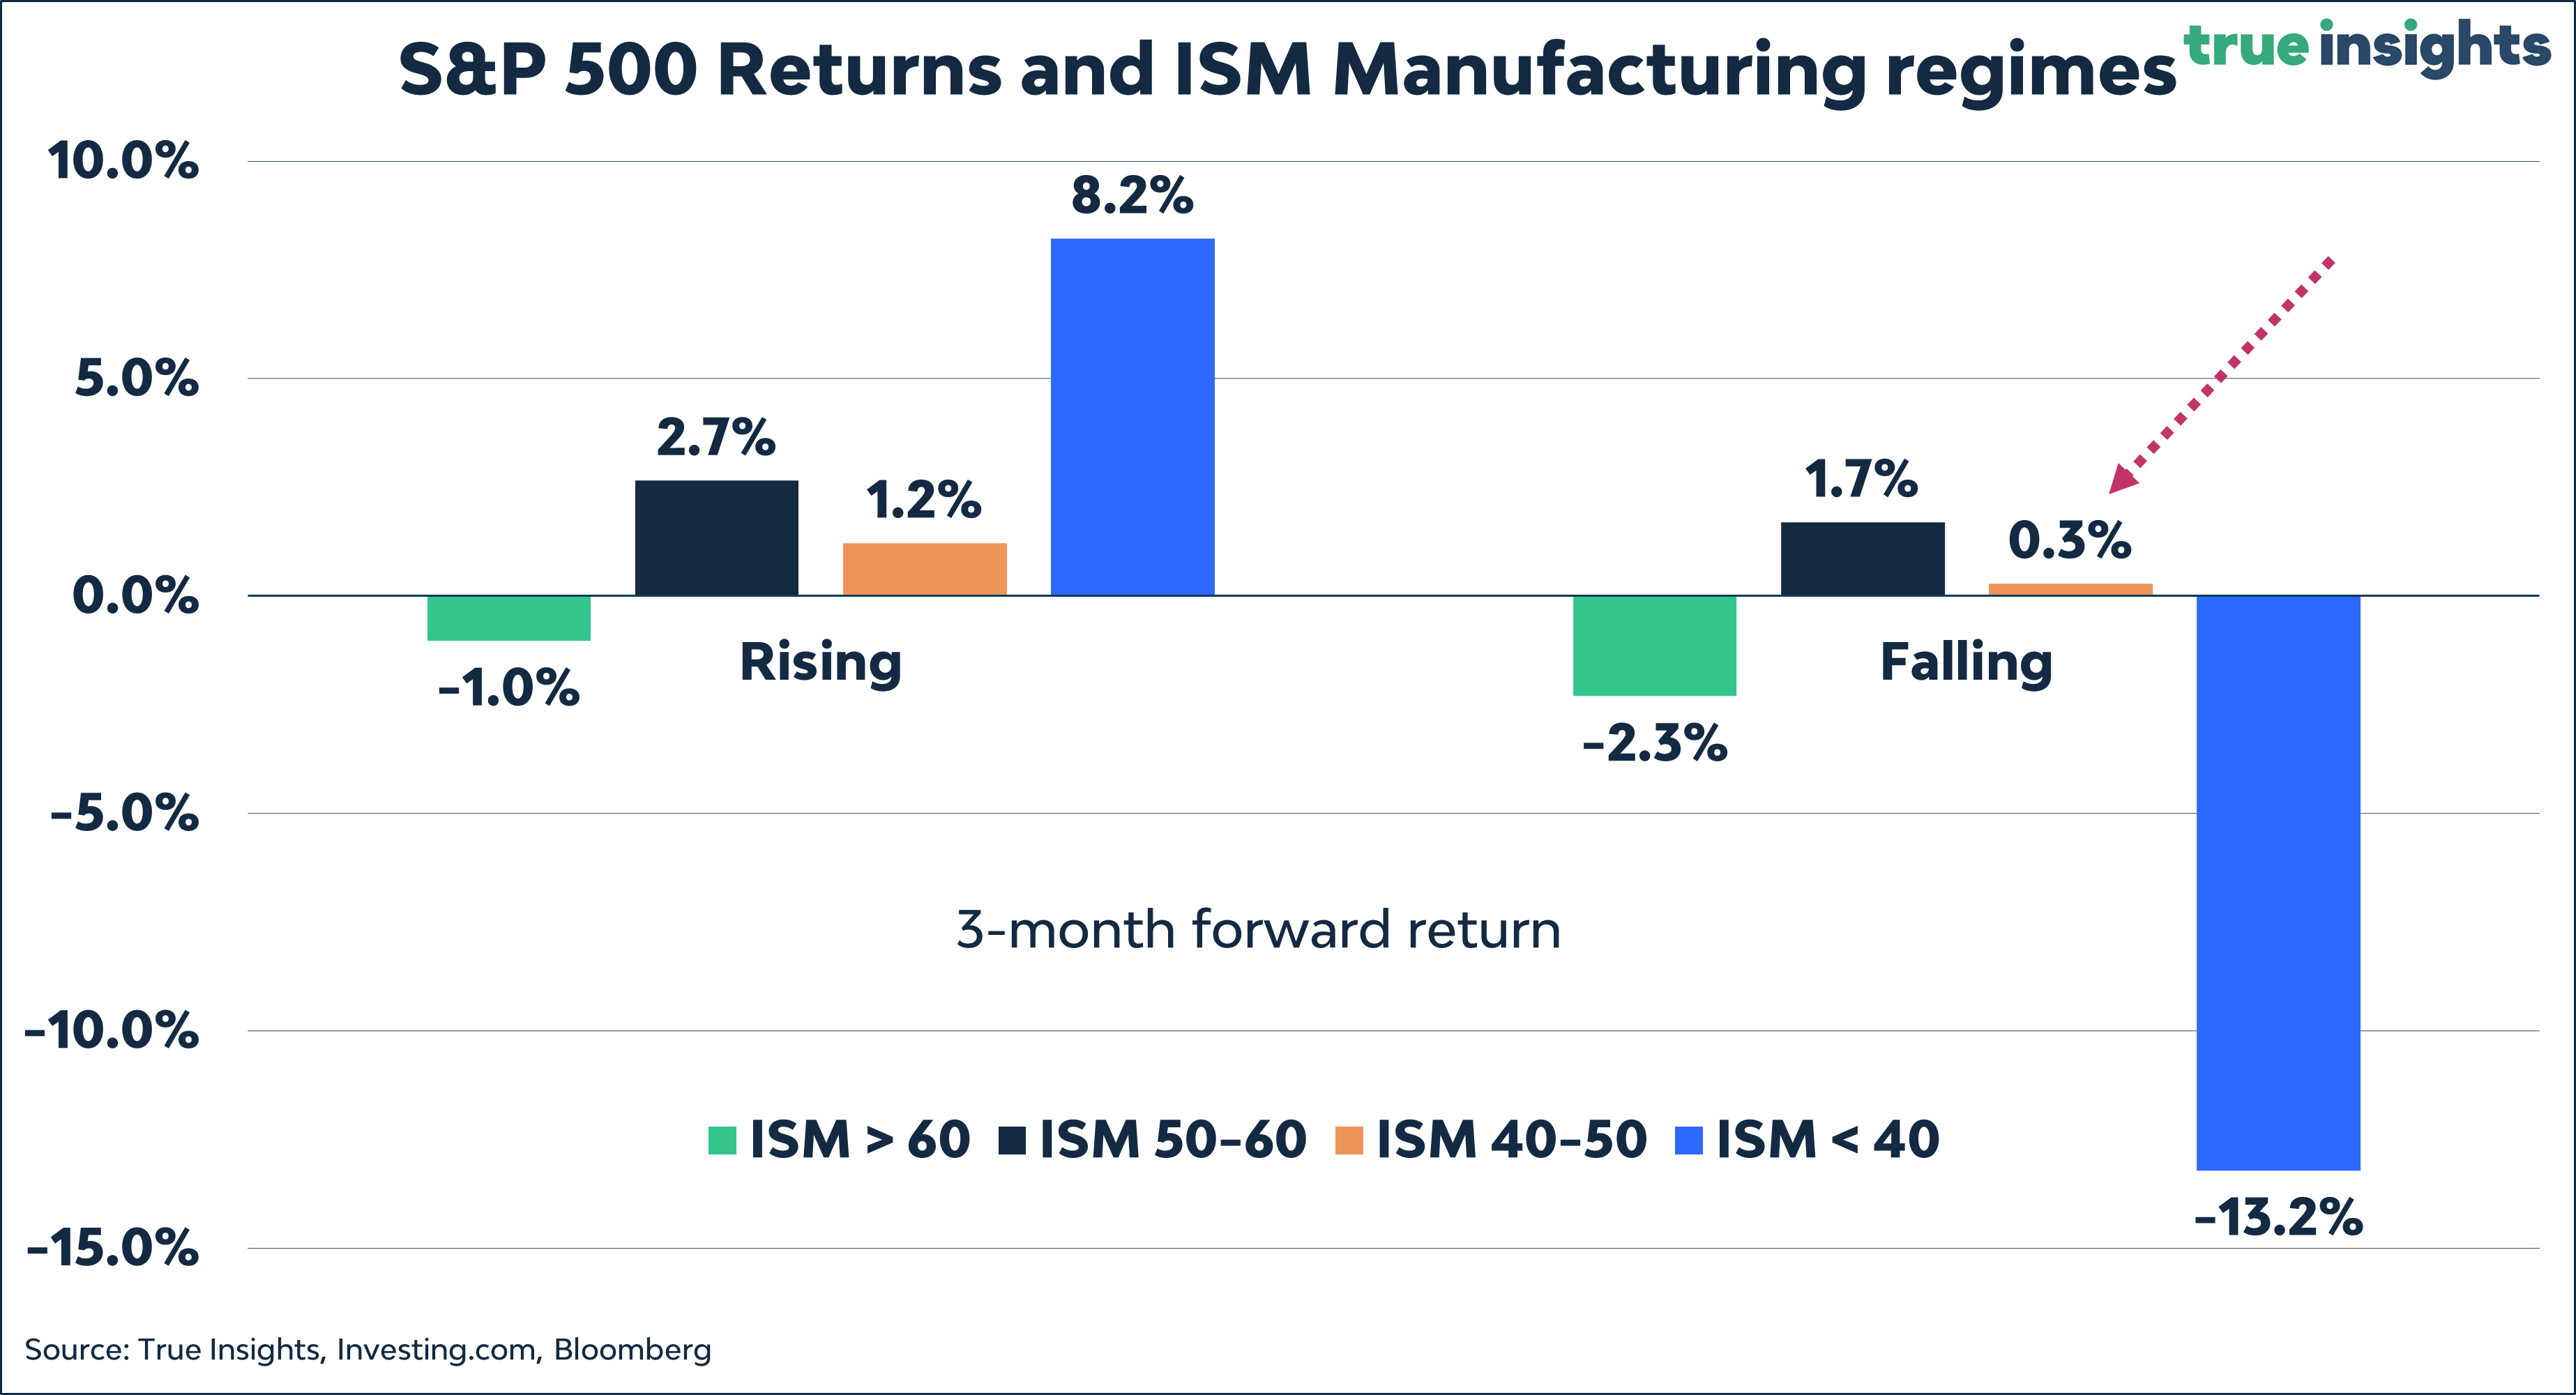
The chart below shows the average 3-month return on the S&P 500 Index for different ISM Manufacturing regimes. With the ISM below 50 and falling, this historically has
been one of the weakest phases for equities. On average, the 3-month average return has been virtually zero (+0.3%.) Should the ISM Manufacturing be heading for a level below 40 – though not our base case – things get really ugly.
The Fit
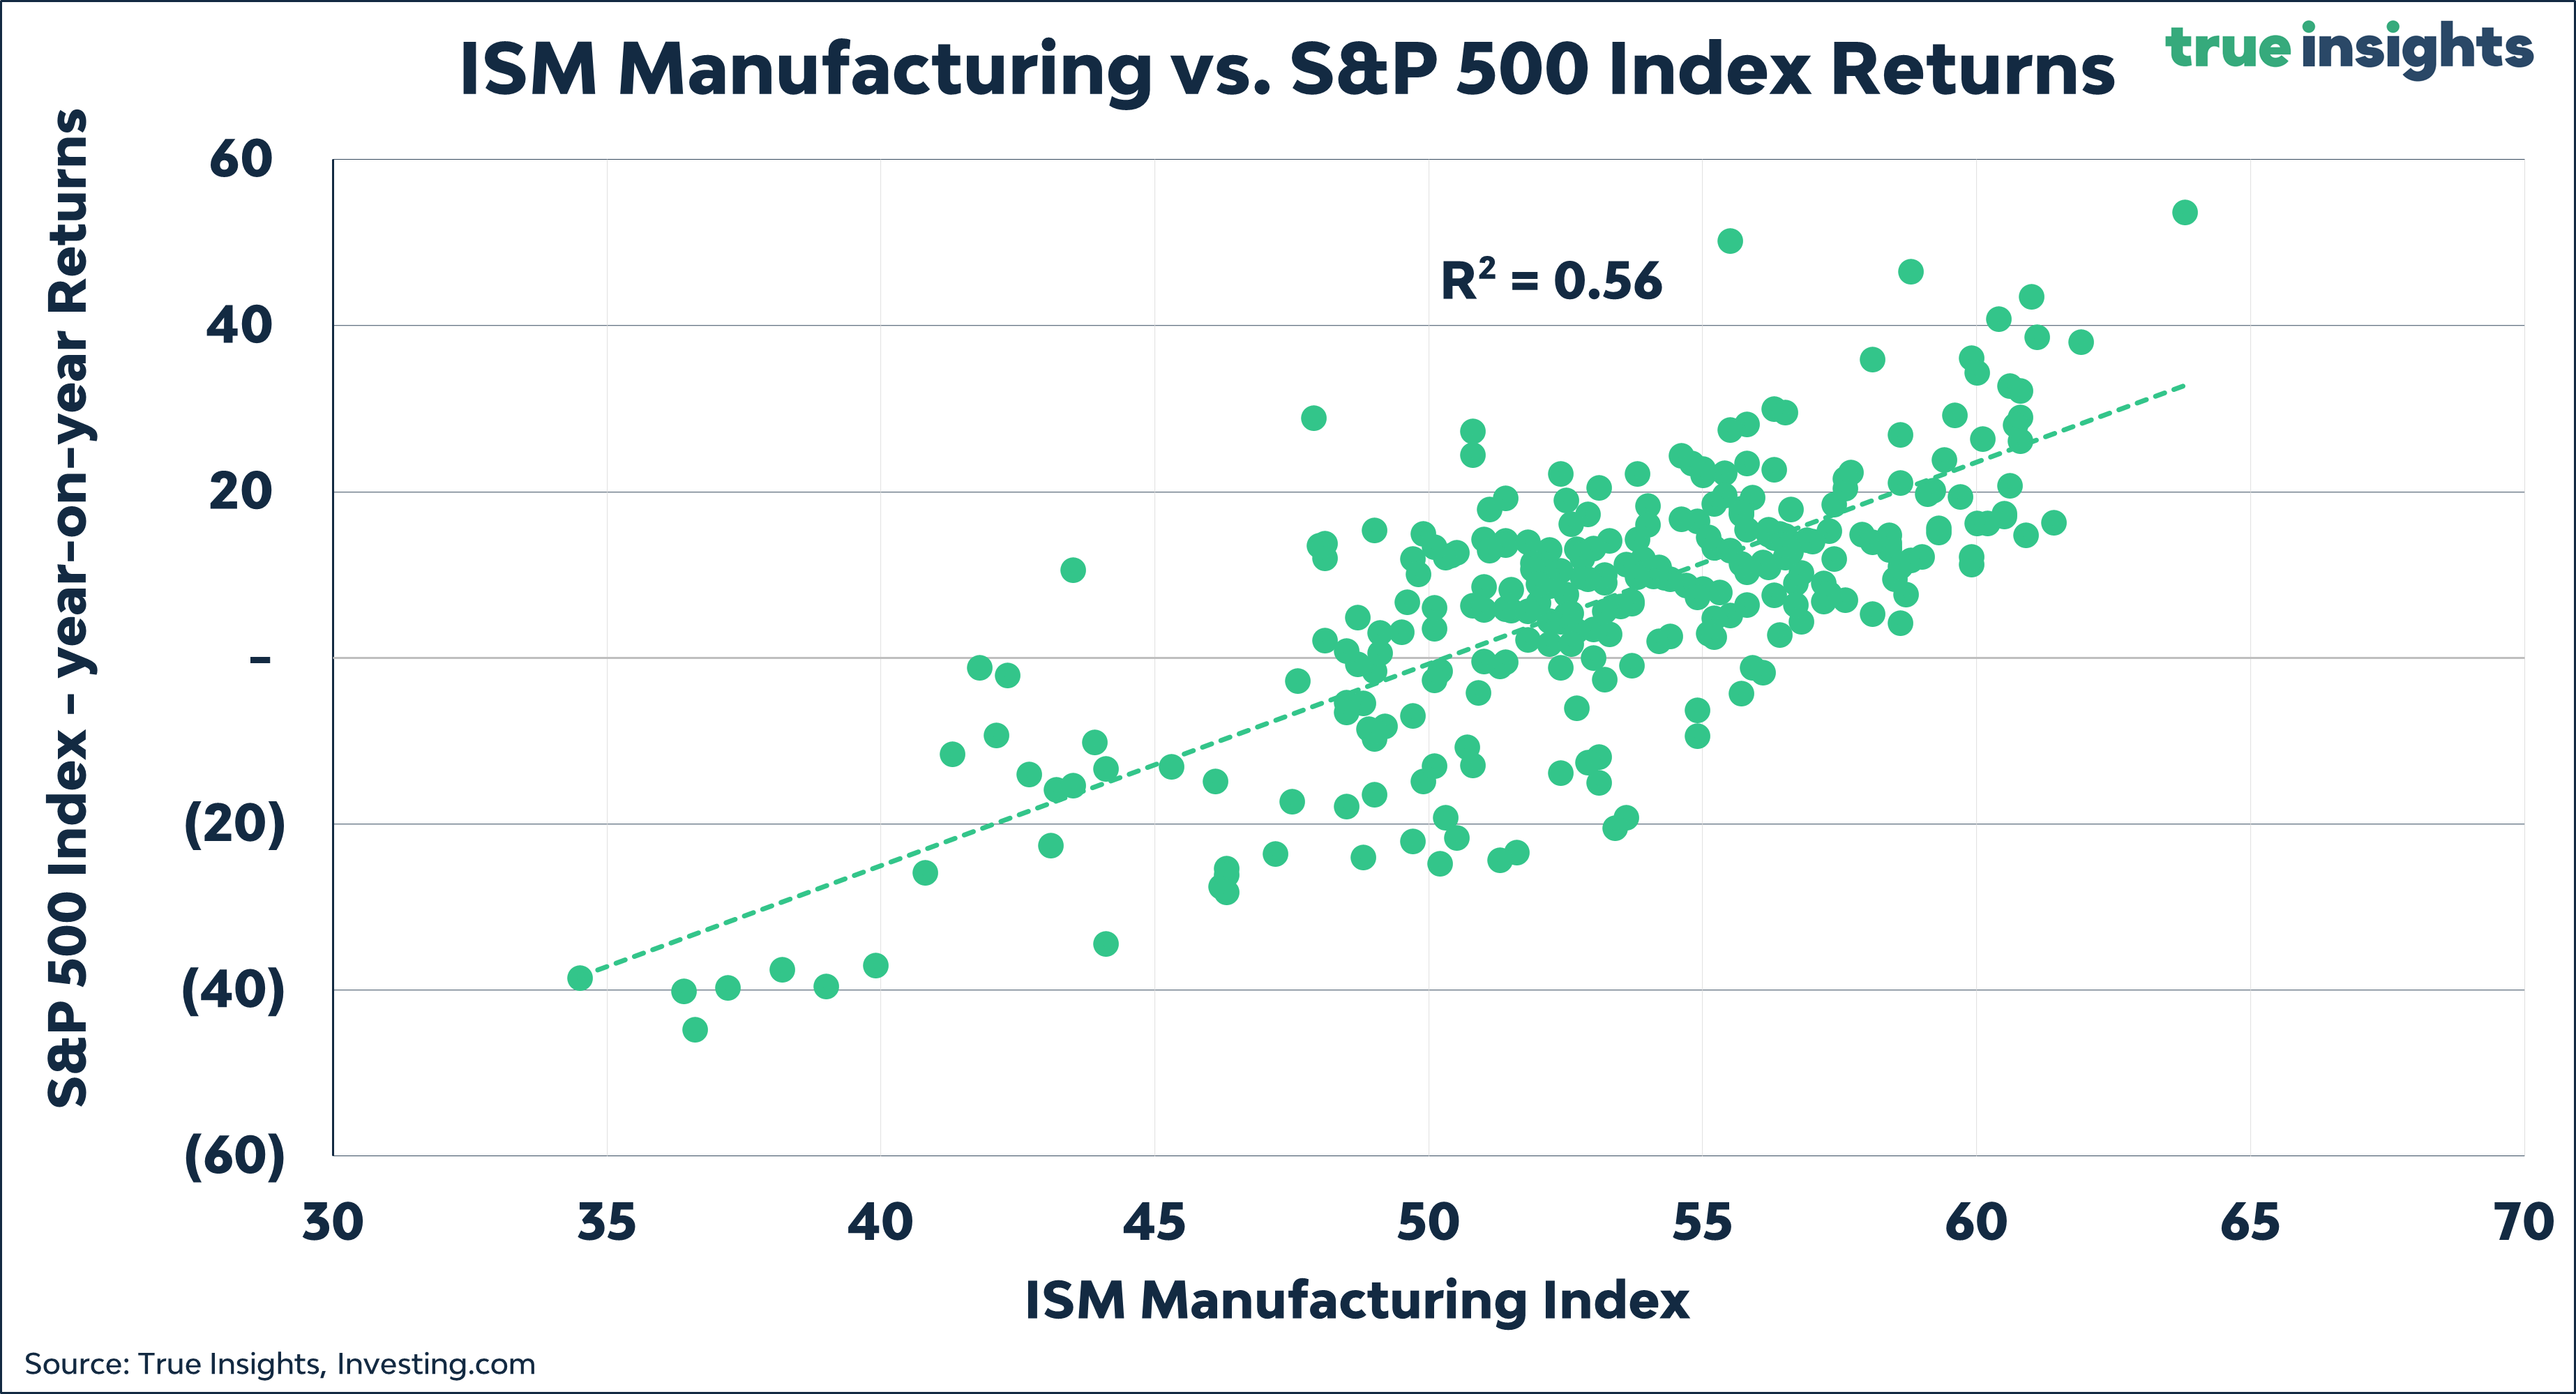
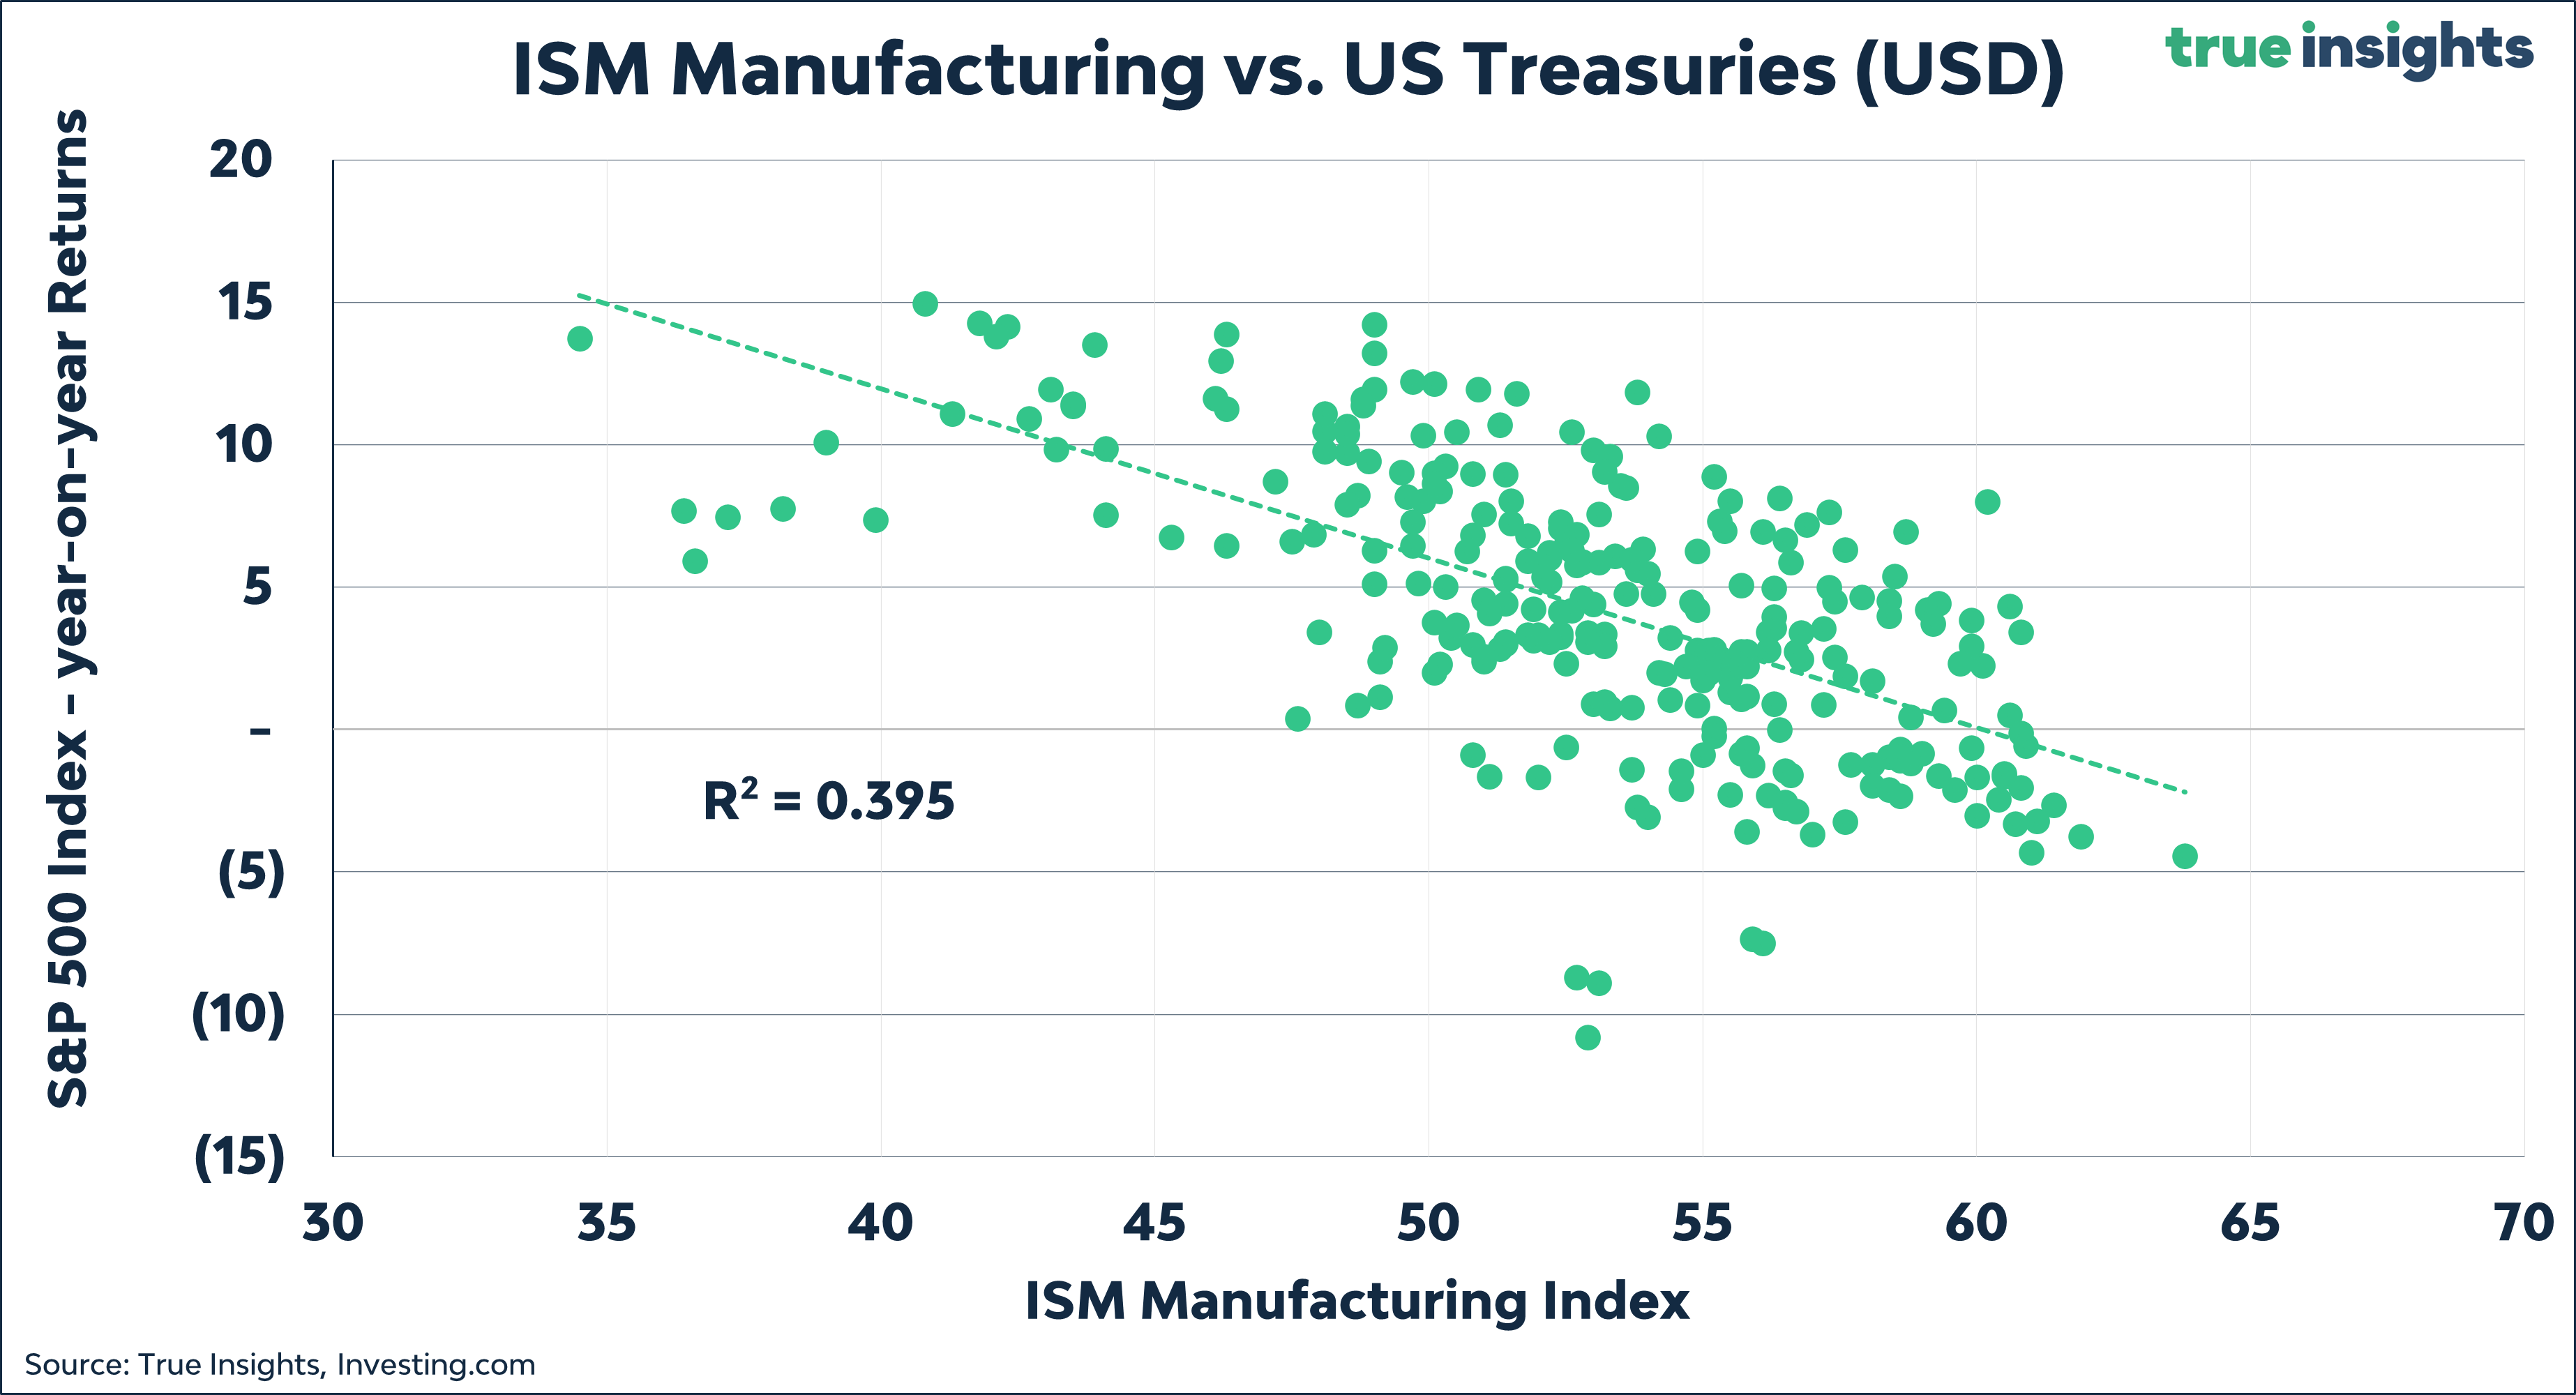
While the ISM Manufacturing Index makes a solid GDP growth forecaster, we are interested in market returns. Historically, the ISM Manufacturing ‘explains’ more than 50% of the variation in year-on-year changes in the S&P 500 Index. But it doesn’t end there. The relationship between the ISM and year-on-year returns on the MSCI World Index is even stronger and remains significant for Emerging Market Equities. In addition, the ISM Manufacturing explains roughly 40% of the variation in US Treasury returns, which is often overlooked. These findings are the foundation of a cross-asset ISM-based allocation strategy.
Connecting the Dots
Combining our forward-looking indicators – our base case is an ISM Manufacturing slightly below or close to the current level of 46.3 in the next couple of months – and the historical relationship between the ISM and equities and bonds, we derive implied returns for several asset classes. These are shown in the table below.
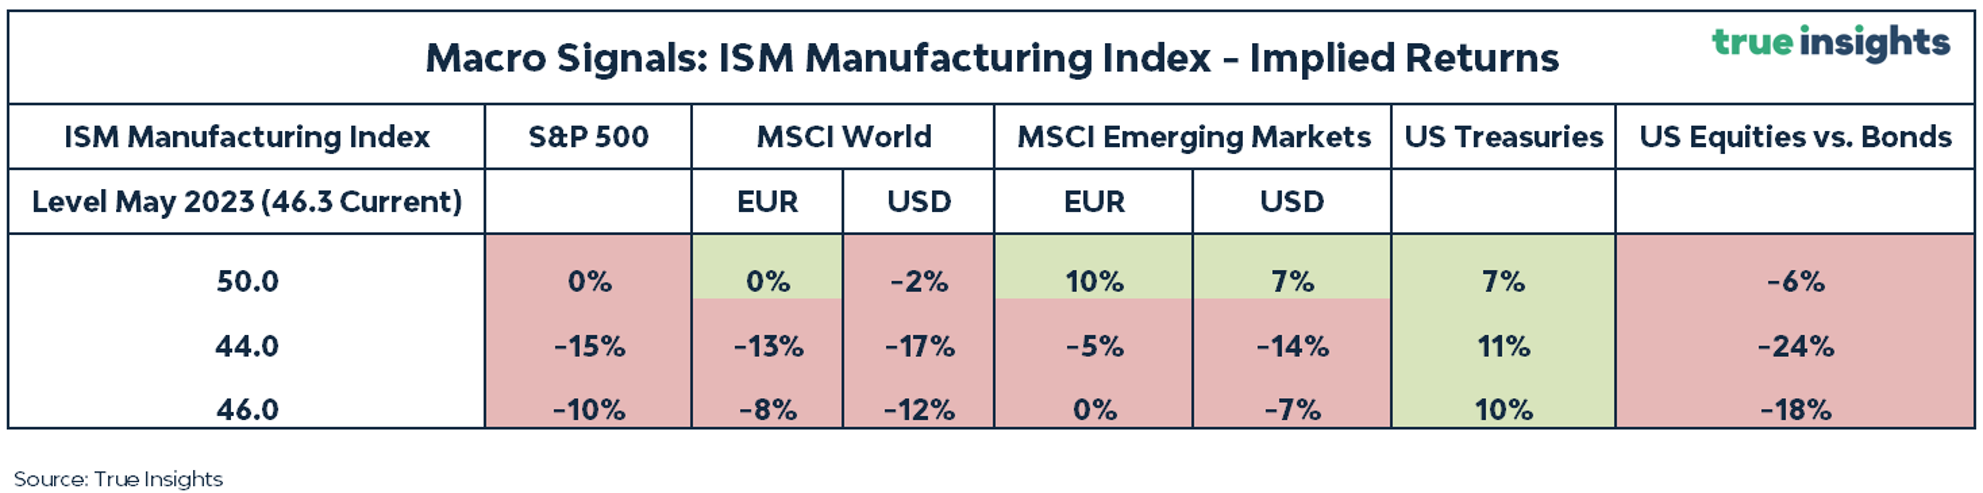
Key observations:
For any level below 46.0, our ‘Neutral’ scenario, equities have no upside, including Emerging Market Equities.
If the ISM Manufacturing Index falls to 44.0, equities face steep declines across the board, with the S&P 500 Index projected to drop to below 3,500 points.
Should the ISM Manufacturing Index start to recover from here, Emerging Market Equities are the place to be, providing ample upside. This is one of the reasons we are neutral EM Equities but underweight DM Equities.
The implied return on US Treasuries is ‘sizeable’ in each of the three scenarios. Obviously, this also has to do with the poor performance of Treasuries in 2022, despite the ISM Manufacturing Index falling throughout the year.
The ISM Manufacturing Index scenarios call for a long US Treasuries, short US Equities strategy in each scenario.
Conclusion
At 46.3, the ISM Manufacturing Index will put a recession back on the agenda. A quick look at earnings expectations reveals equity markets are pricing a low likelihood of a recession. And the implied returns derived from our ISM Manufacturing Index scenarios confirm this. Even if the ISM rebounds to 50 in the coming months – not our base case – Emerging Equities are the only equity-related asset class providing upside. Significant downside for equities looms at the current ISM level and below. The opposite is the case for US Treasuries, revealing upside in each of our three scenarios. Ongoing cautiousness on equities within a multi-asset perspective is warranted.