


Monthly Investor Guide April
A selection of key charts from the Sentiment pillar of our framework

Momentum
Based on EUR returns, gold is the only asset class that truly shines. Its 3-month and 12-momentum are positive, making it the only asset class in the top right quadrant.
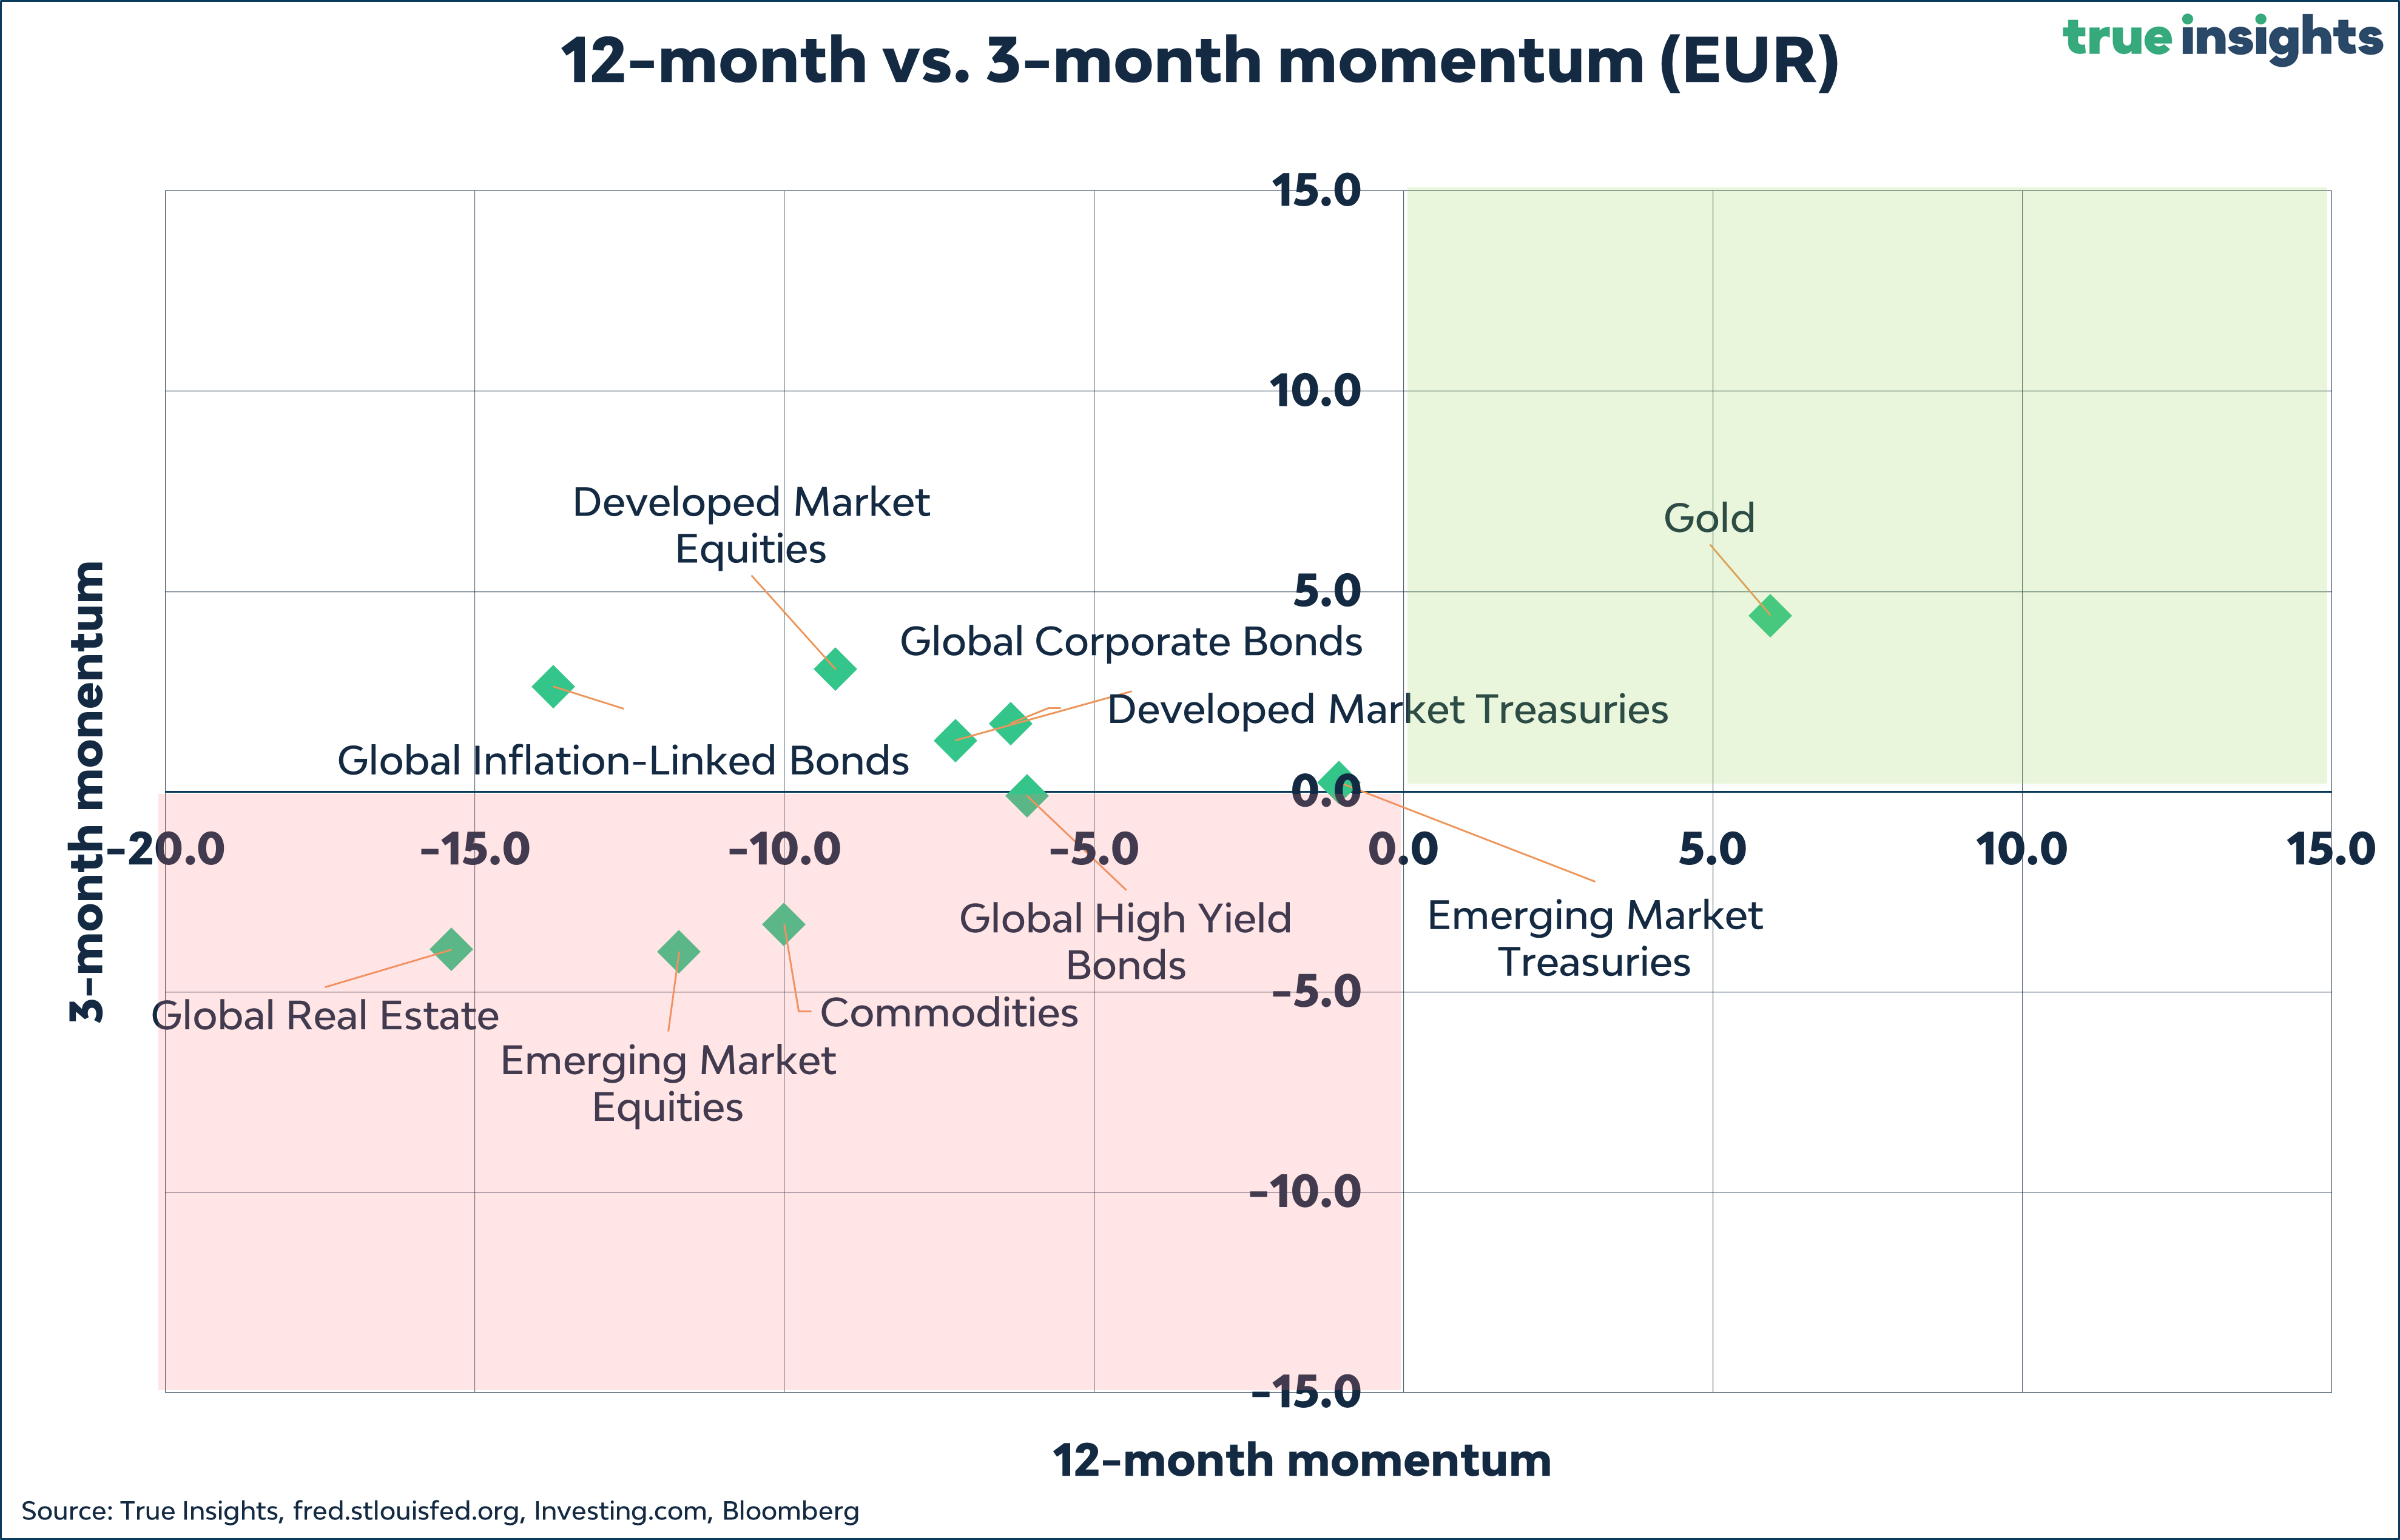
Based on USD returns, no asset class makes it into the top right quadrant, while the same three asset classes – Commodities, Emerging Market Equities, and Global Real Estate – are found in the bottom left quadrant.

Fear & Frenzy Sentiment Index
Our Fear & Frenzy Sentiment Index moved away from ‘Frenzy’ but remains in Neutral territory. Futures positioning and equity flows worsened, pushing the Fear & Frenzy Sentiment Index toward ‘Fear.’

Net Non-Commercial Futures positioning in the S&P 500 Index took a big dive last week. Active investors are very short US equities.

The positioning in US tech stocks, NASDAQ, looks less stretched at first glance. But a heavily bearish view emerges if Covid is taken out – with many investors ‘protecting’ themselves by selling the riskiest part of the equity market universe.

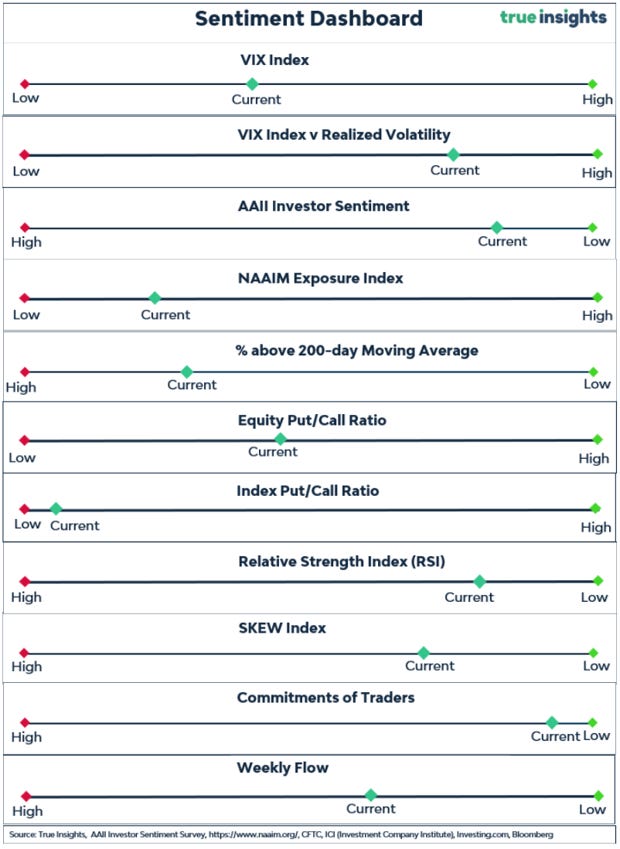
Sentiment Dashboard
Asset Allocation Consensus
We incorporate the ‘Asset Allocation Consensus’ of Alpha Research, an independent research company for institutional investors focusing on multi-asset investing. Alpha Research publishes the Asset Allocation Consensus monthly, incorporating over 60 asset allocation reports from all major asset managers.

There have been no changes in the Asset Allocation Consensus. The same is true for the True Insights Global Multi-Asset Portfolios. While we did lower the weight of Developed Market Equities again, the views on the asset classes remain the same.
The current environment, characterized largely by range-bound trading in several asset classes, including Developed Market Equities and Treasuries, mandates a prudent approach. We believe the odds of a (US) recession are rising again, substantiating our overall cautious portfolio stance. Yet, with the banking crisis subdued for now and central banks injecting liquidity and adjusting their forward guidance, there is no need to get overly bearish. Should the recession loom large on the horizon, there is ample time to further de-risk the portfolio whenever appropriate.
Bank of America Global Fund Manager Survey
The risks that the liquidity mini-crisis migrates into a credit crisis are increasing. However, the market is well aware of this risk, as is revealed in the latest Bank of America Global Fund Manager Survey, published on March 21. In fact, global fund managers now see a ‘systemic credit event’ as the biggest tail risk.

The BofA Global Fund Manager confirms investors’ negative stance on equities, which are significantly underweight.

Bad Breadth
Equity market breadth looks unimpressive. Big tech stocks are driving the rally, while others are not doing all that much. The combined market cap of Apple, Amazon, Alphabet (Google), Facebook (Meta,) and Microsoft is up USD 1.25 trillion, or 26%.

Unfortunately, this is not because of earnings superiority, the key driver that made Big Tech crush everything else since the Great Financial Crisis. Earnings growth has trailed the broader market since the second half of 2021, as the Covid extrapolation was unraveled. Historically, technology earnings growth led other sectors during economic downturns, but with their business model turning increasingly cyclical (advertisement), assuming this will happen again would be somewhat ignorant.

The chart below shows the performance of the equal-weight S&P 500 Index relative to the S&P 500 Index. As the purple oval highlights, the performance has turned aggressively, as just a few tech stocks explain the recent rise.

Seasonality - April
April is the strongest month for equities. The chart below, showing the calendar month returns on US equities, reveals that April has become stronger over time.

But investors should not end here. April is a strong month for Commodities too.

Dito high yield bonds.

Next up Valuation.