Navigating the Yield Curve: What It Means for Equities, Other Assets, and Recession
Shedding some light on what yield curve inversion actually means for recessions and returns
There appears to be some confusion regarding how to interpret recession forecasts from the inverted yield curve and their implications for equities and other asset classes. Today’s Daily Insight will provide clarity on what to expect.
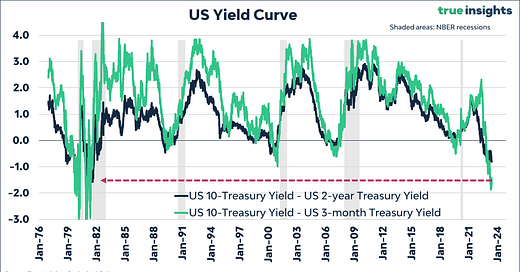
The graph below shows that the key US yield curves – 10-year minus 3-month and 10-year minus 2-year yields – are deeply inverted. Arguably, the yield curve based on Overnight Index Swaps (OIS) better indicates the Federal Reserve’s trajectory. Yet, data availability is crucial here. Reliable OIS data extends back to 2002, encompassing just two recessions. Given the infrequency of recessions, the value of data stretching back to the 1970s, covering six recessions, is highly significant.
In October last year, the 10-year minus 3-month yield curve inverted, while the 10-year minus 2-year yield curve had already inverted in April. Hence, the latter has been signaling a recession for well over a year. So, anticipating a recession based on the slope of the yield curve does not make you a perpetual pessimist.
If history is any guide, it will take a while before the recession arrives. The median lag between the yield curve inversion and the recession is about 1.5 years (18 and 19 months.) The same is true for the average lag. However, as the table shows, there is considerable variation in lag times. Based on the historical lag between yield curve inversion and the beginning of a US recession, the next downturn should commence in Q4 of this year or Q1 of 2024.
The New York Fed Recession Model
The New York Fed calculates the probability of a US recession from the shape of the 10-year minus 3-month yield curve, with a 12-month forecast horizon. Currently, the NY Fed model predicts a 70% recession probability. That is substantial. The chart below reveals that an estimated probability of roughly 40% was enough to accurately forecast a recession.
Not bad news
A yield curve inversion isn’t necessarily a negative sign for the markets. Our research reveals that all asset classes performed quite well between the start of yield curve inversion and the start of a recession. To provide a clearer picture, let’s look at the table below. It displays the annualized returns for US Equities, the MSCI World Index, Commodities, Gold, US Treasuries, and US Corporate Bonds during the period between the first day of the 10-year – 2-year yield curve inversion and the onset of the subsequent US recession. We’ve analyzed data from the most recent six recessions. By using annualized returns, we can adjust for variations in the lag time between inversion and recession and compare asset class returns directly.
No Negative Numbers
The S&P 500 Index realized an average annualized return of 7.3%, which is not far from the long-term average return on US equities. The median return of 5.8% is slightly lower but still quite respectable. US equities tend to perform fairly well after a yield curve inversion. In addition, the S&P 500 Index has shown positive returns in all six instances.
The performance of the MSCI World Index is less impressive but still quite positive, with an average return of 4.1% and a median return of 3.8%. While these figures fall slightly below the long-term average, they remain significantly positive. Developed market equities historically did not experience a collapse leading up to a US recession.
Similar patterns can be observed for Commodities, demonstrating low single-digit average returns between yield curve inversion and recession.
Shining Bright with Gold?
When it comes to Gold, it stands out as the best-performing asset class in our analysis based on average return. However, it ranks bottom, based on the median return. Gold returns in the run-up to US recessions have been highly volatile, with three positive returns, including one remarkable 124% return and three negative returns.
US Corporate Bonds have achieved an average return of 3.4%, with a median return of 5.0%. As the economy slows down and the risk of default rises prior to a recession, corporate bonds tend to trail US Treasuries.
Solid Performance from US Treasuries
US Treasuries have shown a solid performance after a yield curve inversion, with an average return of 6.0% and a median return of 6.4%. Importantly, this is not solely due to higher bond yields and returns witnessed during the late 1970s and early 1980s, which encompassed two US recessions. In fact, the return on US Treasuries was higher leading up to the subsequent four recessions in our sample. Additionally, from a risk-return or Sharpe ratio perspective, Treasuries have “outperformed” equities.
Conclusion
Inverted yield curves suggest that a US recession may occur in the final quarter of this year or the first quarter of the following year. However, it’s important to note that the inversion itself does not guarantee negative returns for any asset class. None of the asset classes in our sample – US Equities, the MSCI World Index, Commodities, Gold, US Treasuries, and US Corporate Bonds – experienced negative returns between the first inversion and the start of the US recession. Of course, other factors, such as the upcoming liquidity reversal, market breadth, and valuation, should be considered, warranting caution but not outright bearishness.


