

Operating Leverage in Reverse: The Impact on Equity Markets
A recession determines the impact of 'reverse operating leverage' (earnings growth less than sales growth) on future equity market returns.

Operating leverage at company level
Operating leverage reflects the degree to which a company can increase its operating income by increasing sales. The key driver of operating leverage is the ratio of fixed and variable costs. Companies with high fixed costs relative to variable costs have high operating leverage, while companies with low fixed costs relative to variable costs have low operating leverage.
Most of the time, operating leverage is presented as a static figure determined largely by the industry a company is active in. But a wider definition of operating leverage impacts company earnings through the economic cycle.
Macro dynamics
During major economic downturns and recessions, the decline in consumer demand translates into lower prices for final goods and services but not for stickier company costs like wages and rents. As a result, profit margins are squeezed, and earnings take a hit.
Given the inflation/price-costs/wages dynamics during downturns, the gap between earnings and sales growth is a way to determine the operating leverage for the market as a whole. This is because sticky costs matter most for the bottom line and less for the top line.
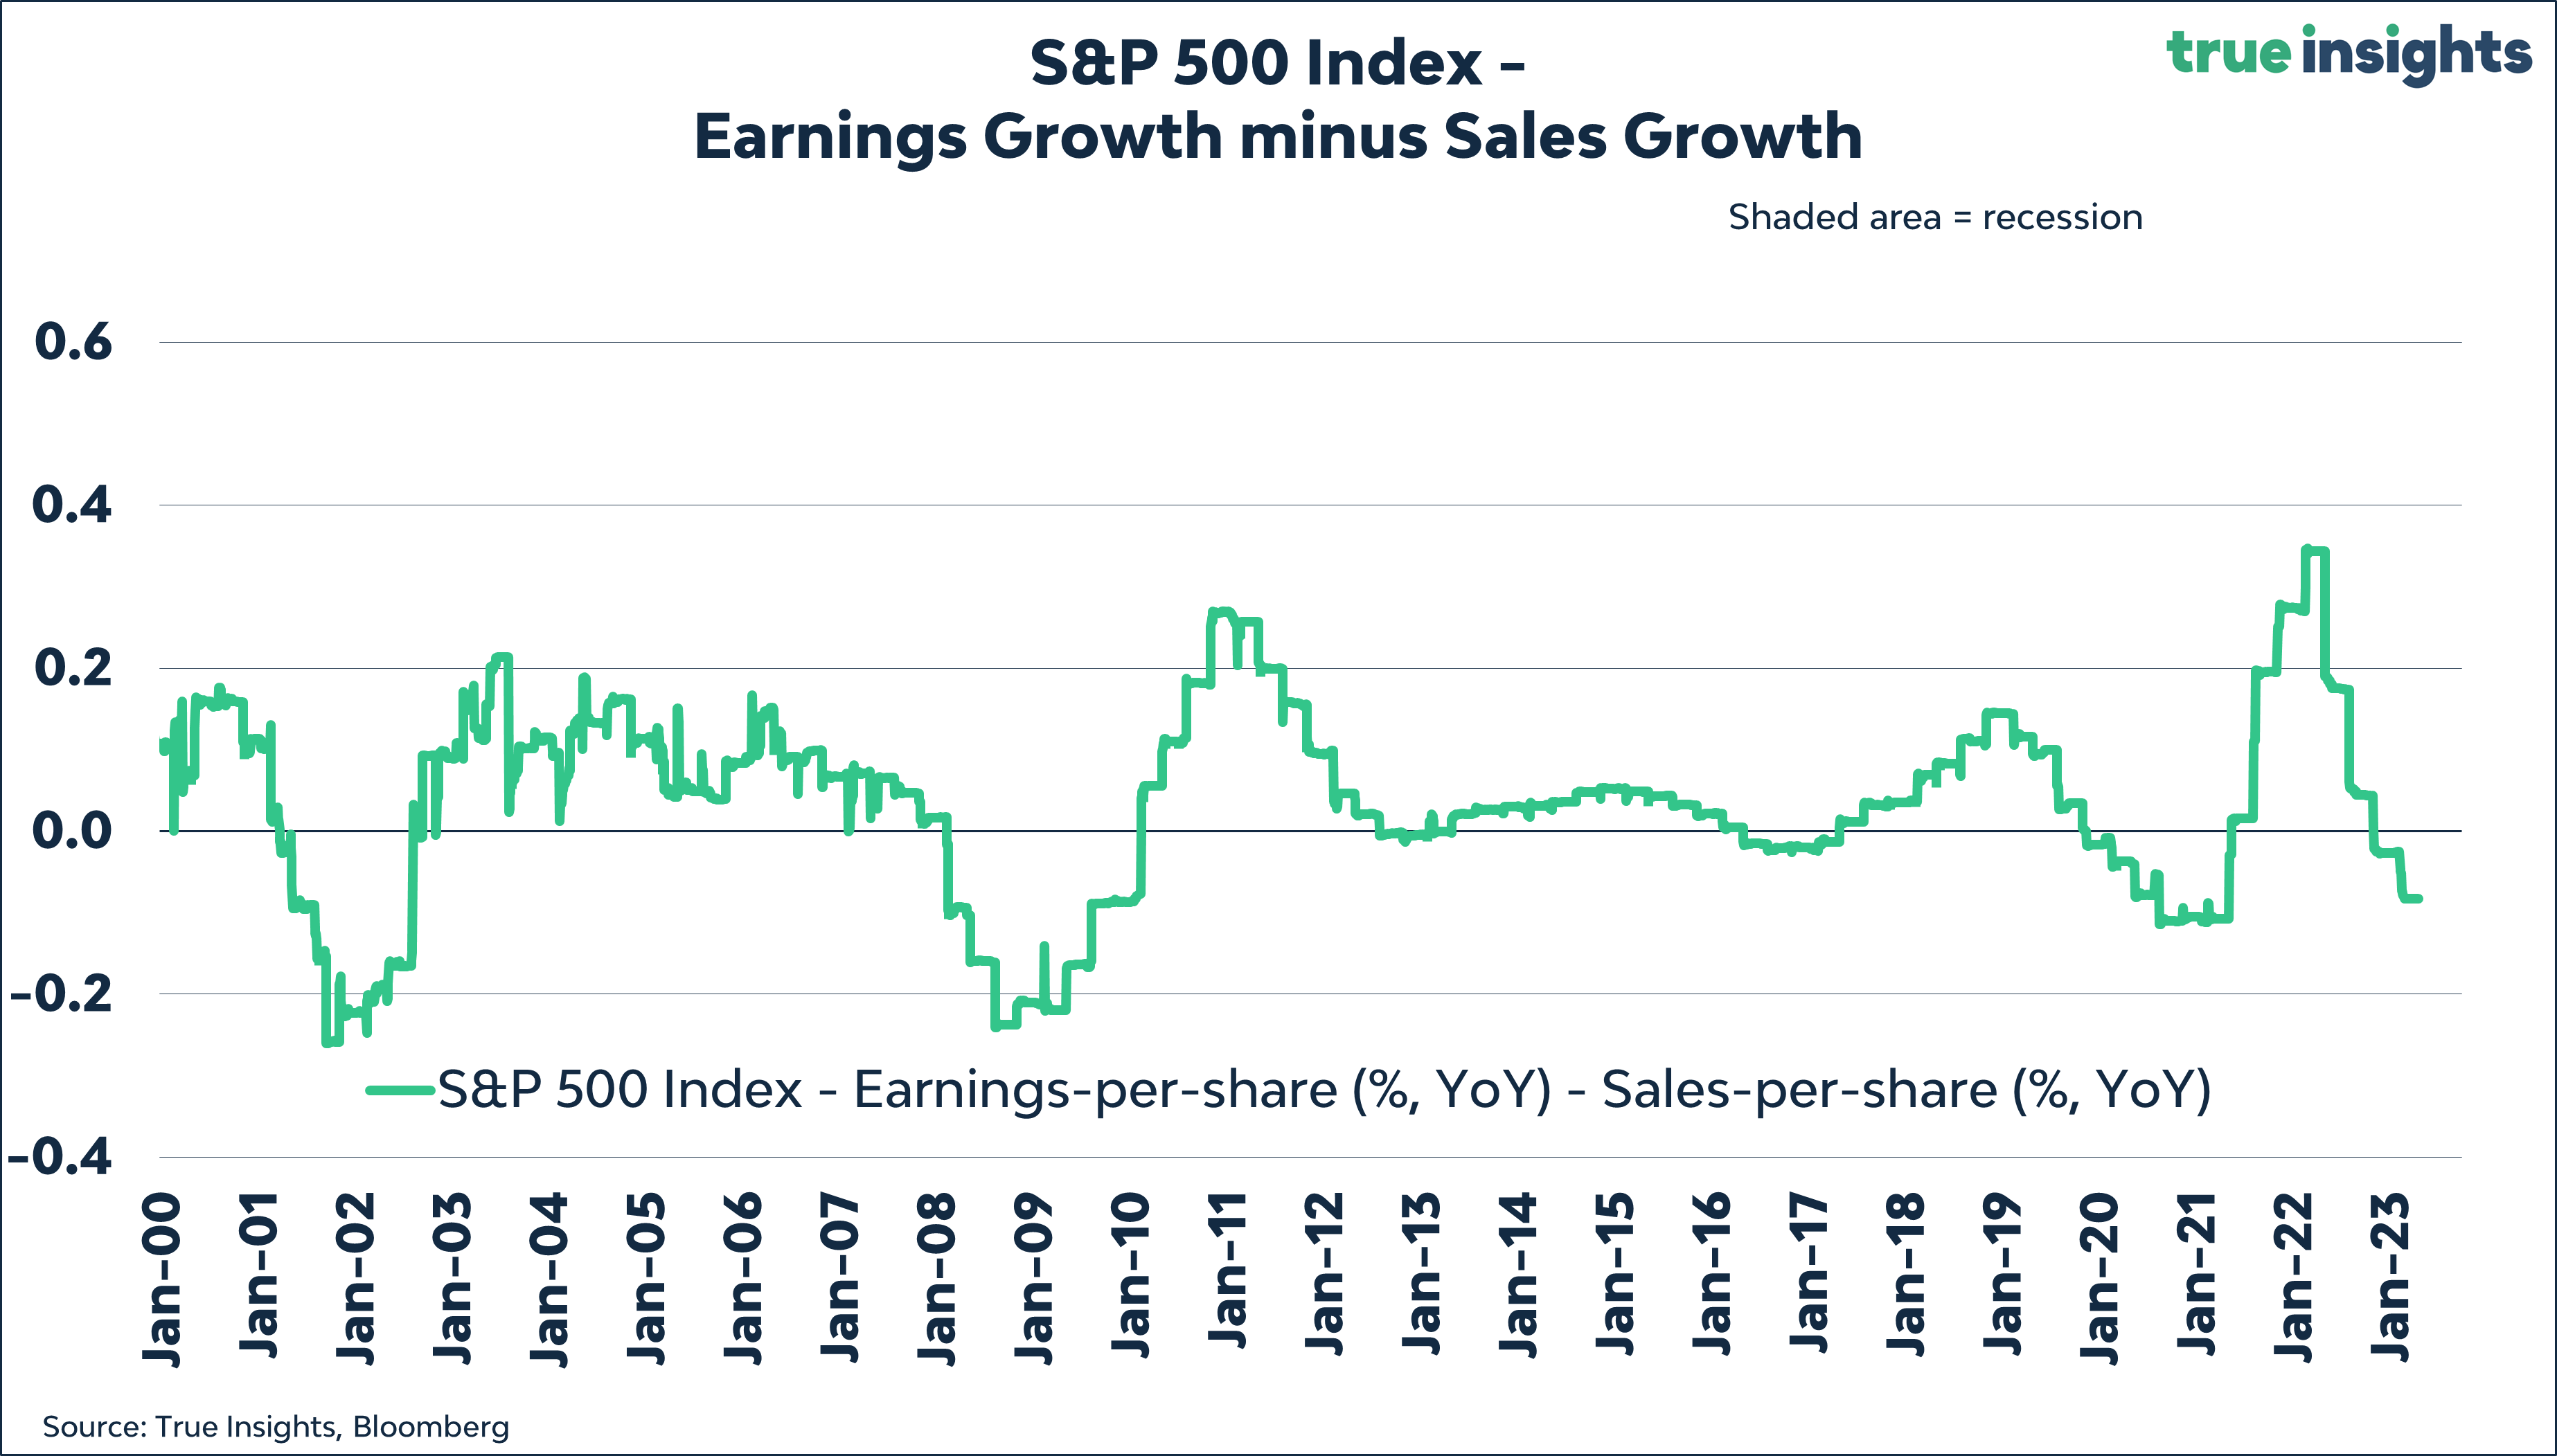
The chart above shows the year-on-year change in earnings-per-share minus the year-on-year change in sales-per-share for S&P 500 Index. The chart reveals that the gap between earnings and sales growth becomes very negative during recessions. As seen on the right end of the chart, the gap has now turned negative again.
Q1 earnings season
Reverse operating leverage continues for Q1. With 95 of 500 S&P 500 Index companies having reported, earnings are down from the previous quarter, while sales are up. The number of companies reported for other regions is too small to derive any conclusions from.

How bad for equities?
Obviously, reverse operating leverage is bad news for profitability and margins, but is it also for stock prices? We looked at all instances when sales growth topped earnings growth for the S&P 500 Index since 2000.
Analysis set-up:
We determine the start and end date when operating leverage (the gap between earnings growth minus sales growth) was negative.
Days with reverse operating leverage come in distinct clusters, making it straightforward to determine their return impact.
To mimic a tradable investment strategy, the return measurement period starts on the first day operating leverage becomes negative and ends when operating leverage turns positive. We removed February 07, 2007, from our sample, on which, according to Bloomberg, operating leverage turned negative for just one day.
To better understand stock market behavior, we also looked at the returns 180 prior to and after phases of reverse operating leverage.
To better understand market behavior, we also determined whether earnings and sales growth became negative during phases of reverse operating leverage. We believe this provides additional information, as reverse operating leverage may also occur when earnings and sales growth are positive, implying different GDP growth regimes.
Finally, to better understand market behavior, we also looked at whether reverse operating leverage occurred ‘in the proximity’ of a US recession.
We mainly focus on the results excluding Covid, characterized by an extremely rare economic sudden stop followed by unprecedented fiscal and monetary stimulus, resulting in the shortest US recession in history.
The results are shown in the table below:
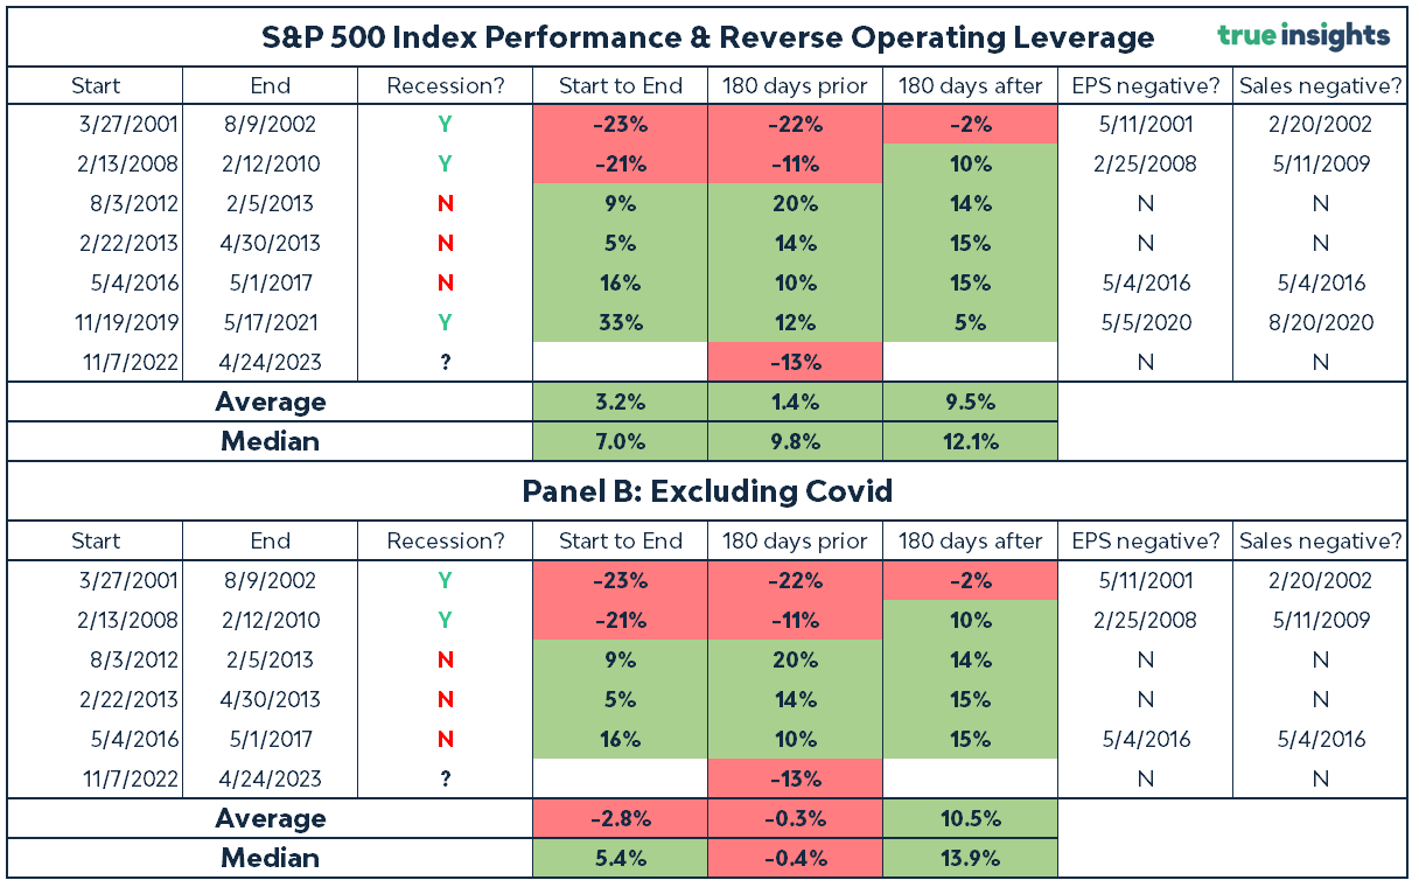
There have been seven phases of S&P 500 Index reverse operating leverage (negative gap between earnings growth and sales growth) since 2000.
Three periods (2001-2002, 2008-2010, and 2019-2021) involved a US recession.
Based on the results in Panel B, a US recession determines whether reverse operating leverage is bad for US equities.
During the recession periods 2001-2002 and 2008-2010, the S&P 500 Index realized significant negative returns both prior to and during the phase of reverse operating leverage.
The opposite is true for phases of negative operating leverage not attached to a recession (2012-2013, 2013, 2016-2017). The returns on the S&P 500 Index were positive prior to, during, and after phases in which sales growth topped earnings growth.
The table provides more evidence that the state of the economy determines the impact of reverse operating leverage. Earnings and sales growth turned outright negative during the two recessionary periods (2001-2002, 2008-2010) but only once during the three non-recessionary periods (2012-2013, 2013, 2016-2017). And a closer look reveals that the declines in earnings and sales were very shallow (maximum two percentage points) during 2016-2017.
Conclusion
The outcome of reverse operating leverage for US stocks depends on whether or not the US economy goes into recession. If it does – this is our base case – the downside risk for the S&P 500 Index looms large. Taking the two recessionary periods of 2001-2002 and 2008-2010 as a guide, US equities will go down. However, they are up more than 8% since operating leverage turned negative in November last year.
In addition, the negative return of 13% 180 days prior to the day operating leverage turned negative also matches that of a recessionary environment. Should earnings (and sales) growth turn negative – and we expect it to do so based on our earnings-per-share indicators – things will start to look even more recessionary. This analysis further strengthens our base case that (US) equities are ripe for a significant pullback. Hence, we remain underweight Developed Market Equities.
