The Corporate Interest Burden – It's all about Earnings!
It is not so much the maturity wall that causes debt servicing issues but earnings that are destined to decline in the coming quarters.
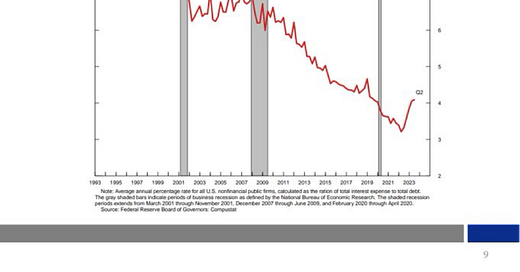
Today’s Insight is inspired by the Federal Reserve chart below, which illustrates that while the effective interest rate for US companies has risen, it remains relatively low at just around 4%. We expand on this analysis and conclude that although high interest rates may not immediately lead to debt servicing issues for higher-rate companies, each month that elevated yields prevail will significantly impact the ratio between profits and debt servicing costs.
Net Debt to EBITA
The chart below shows the Net Debt to EBITA ratio for the S&P 500 Index plotted against the US Corporate Bond Yield.
The key takeaways:
The Net Debt to EBITA ratio is roughly equal to the average of the Post-Great Financial Crisis period. This level is not an immediate concern.
The combination with the current US Corporate Bond Yield clouds the corporate outlook.
The US Corporate Bond Yield is at its highest level since 2010. Any debt refinancing will translate into a substantial increase in interest payments.
Free Cash Flow to Net Debt ratio
Free Cash Flow is likely the best metric for understanding a company’s earnings model.
The key takeaways:
Following the significant COVID-related spike in 2021, the Free Cash Flow to Net Debt ratio has fallen just below the average since the Great Financial Crisis.
Here too, the disparity with the Corporate Bond Yield is noticeable
Total Debt to Total Assets
Finally, we look at a key leverage metric, Total Debt to Total Assets.
For the S&P 500 Index, the leverage ratio is close to its highest point since the Great Financial Crisis.
However, extreme values are not reached.
Combined with spiking yields, this chart again suggests that every bit of refinancing will significantly increase interest payments.
The Good News – Maturity Wall
The good news is that the maturity wall, the ‘timetable’ for debt refinancing, is unlikely to cause much volatility. US companies are done with refinancing for this year, and next year refinancing will account for only 2% of the total outstanding debt. It’s not until the years after that that the maturity wall steepens. However, investors typically look no further than a year ahead.
The Bad News – Earnings
Yet, companies must continue generating enough income to cover the (higher) interest payments. And there lies a clear risk here. Our bellwether earnings indicator, despite improving, still points to a significant drop in profits in the coming quarters. If this materializes, as the chart below suggests, both EBITDA and Free Cash Flows in the charts above will see significant declines, making the outlook considerably more challenging.
Conclusion
Despite companies’ current relatively low interest payments, the recent spike in yields increases the risk of dwelling too much in the rearview mirror. Each refinancing operation entails a significant uptick in interest payments. That said, companies only need to refinance 2% of their outstanding loans in the coming year. The real risk lies in the development of cash flows and earnings that must offset the (higher) debt servicing costs. With weaker economic growth on the horizon and ongoing high wage growth, the focus on rising interest rates may intensify.


