
The Weekly Market Monitor – Fed doves have nowhere to fly, gold's fairytale continues
The Weekly Market Monitor – Fed doves have nowhere to fly, gold's fairytale continues
Will Powell destroy the equity market rally? And what is stopping gold? Do US small businesses signal a recession?

First things first! – Inflation strikes back
The 3-month annualized Core Services excluding Housing CPI hit a spectacular 8.2% in March. Year-on-year, the increase was 4.8%, more than a percentage point higher than in October. If the Federal Reserve were focused solely on inflation, a rate cut would be unjustifiable. But it isn’t.

MACRO
Awkward

March inflation figures put Powell in an awkward situation. While the PCE core remains the Federal Reserve’s key inflation measure, Powell must show his hand. After three disappointing CPI reports, ‘Jay’ has only a tiny platform left to perform his dovish act and sticking to three rate cuts this year. If he does, it will confirm once and for all that debt and debt sustainability is a true part of the central bank’s mandate.

Postpone
Since the Fed will not want to go down this road, at least not now, I expect Powell will reintroduce some of the hawkish rhetoric he used in 2022 and early 2023. This initially caused a lot of pain in the stock markets. Reasoning like ‘the latest inflation data obviously wasn’t good’ and ‘we need more data to have higher conviction inflation will return to target’ will be sufficient to signal to markets that a rate cut in June is not happening.

Managing expectations
The room Powell leaves to begin a series of rate cuts later this year will determine whether Powell derails the 20%+ rally since October. Current market expectations give Powell a little leeway. Fed futures indicate 1.8 expected rate cuts this year. Powell will certainly not drop from three to zero, so the market does not need to panic if he packages his hawkish message in a dovish wrap.
In my X polls, you see a shift after the latest CPI data, but even before that, the vast majority of respondents had already moved to expecting 1-2 or even no rate cuts this year.
In the poll after the CPI data, only 13% believe there will be three or more rate cuts.
As I wrote in this week’s CPI commentary, there are several reasons to assume that the Fed might still make three or more 0.25% steps. But as an investor, that’s not very helpful to you now.
Even though economists are now talking up the neutral rate after years of revising it down, I assume that with each significant rise in public or total debt, the neutral rate falls. Excessive fiscal stimulus during times of positive GDP growth masks this effect.

Wage pressures are easing, unlike in 2021-2022.

Excess savings have been depleted, making it unlikely that spending will remain as strong as in the past few years. Additionally, wage growth is moderating.

Big-ticket spending items are rising in price the most, increasing the chances of reduced spending growth.
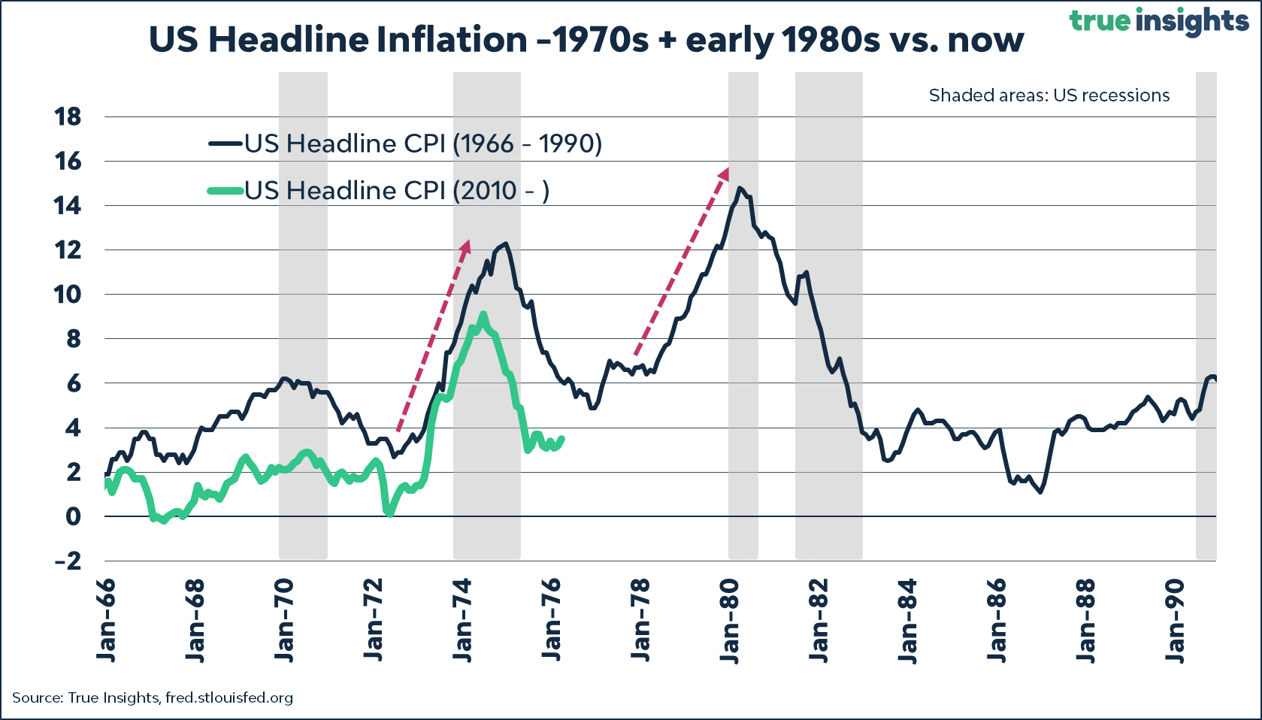
Of course, the figure below represents the most significant risk to my expectation. The comparison between now and the 1970s and early 1980s remains alive and well. The Federal Reserve will have a tremendous issue if inflation fails to return to target.
Even so, it’s not a foregone conclusion that we won’t see any rate cuts. As indicated, the Federal Reserve will have to choose. With yields around 5%, last year’s regional banking crisis confirmed that things start to break, and we’ve again seen a sharp decline in regional bank stocks after the CPI report.

Recession
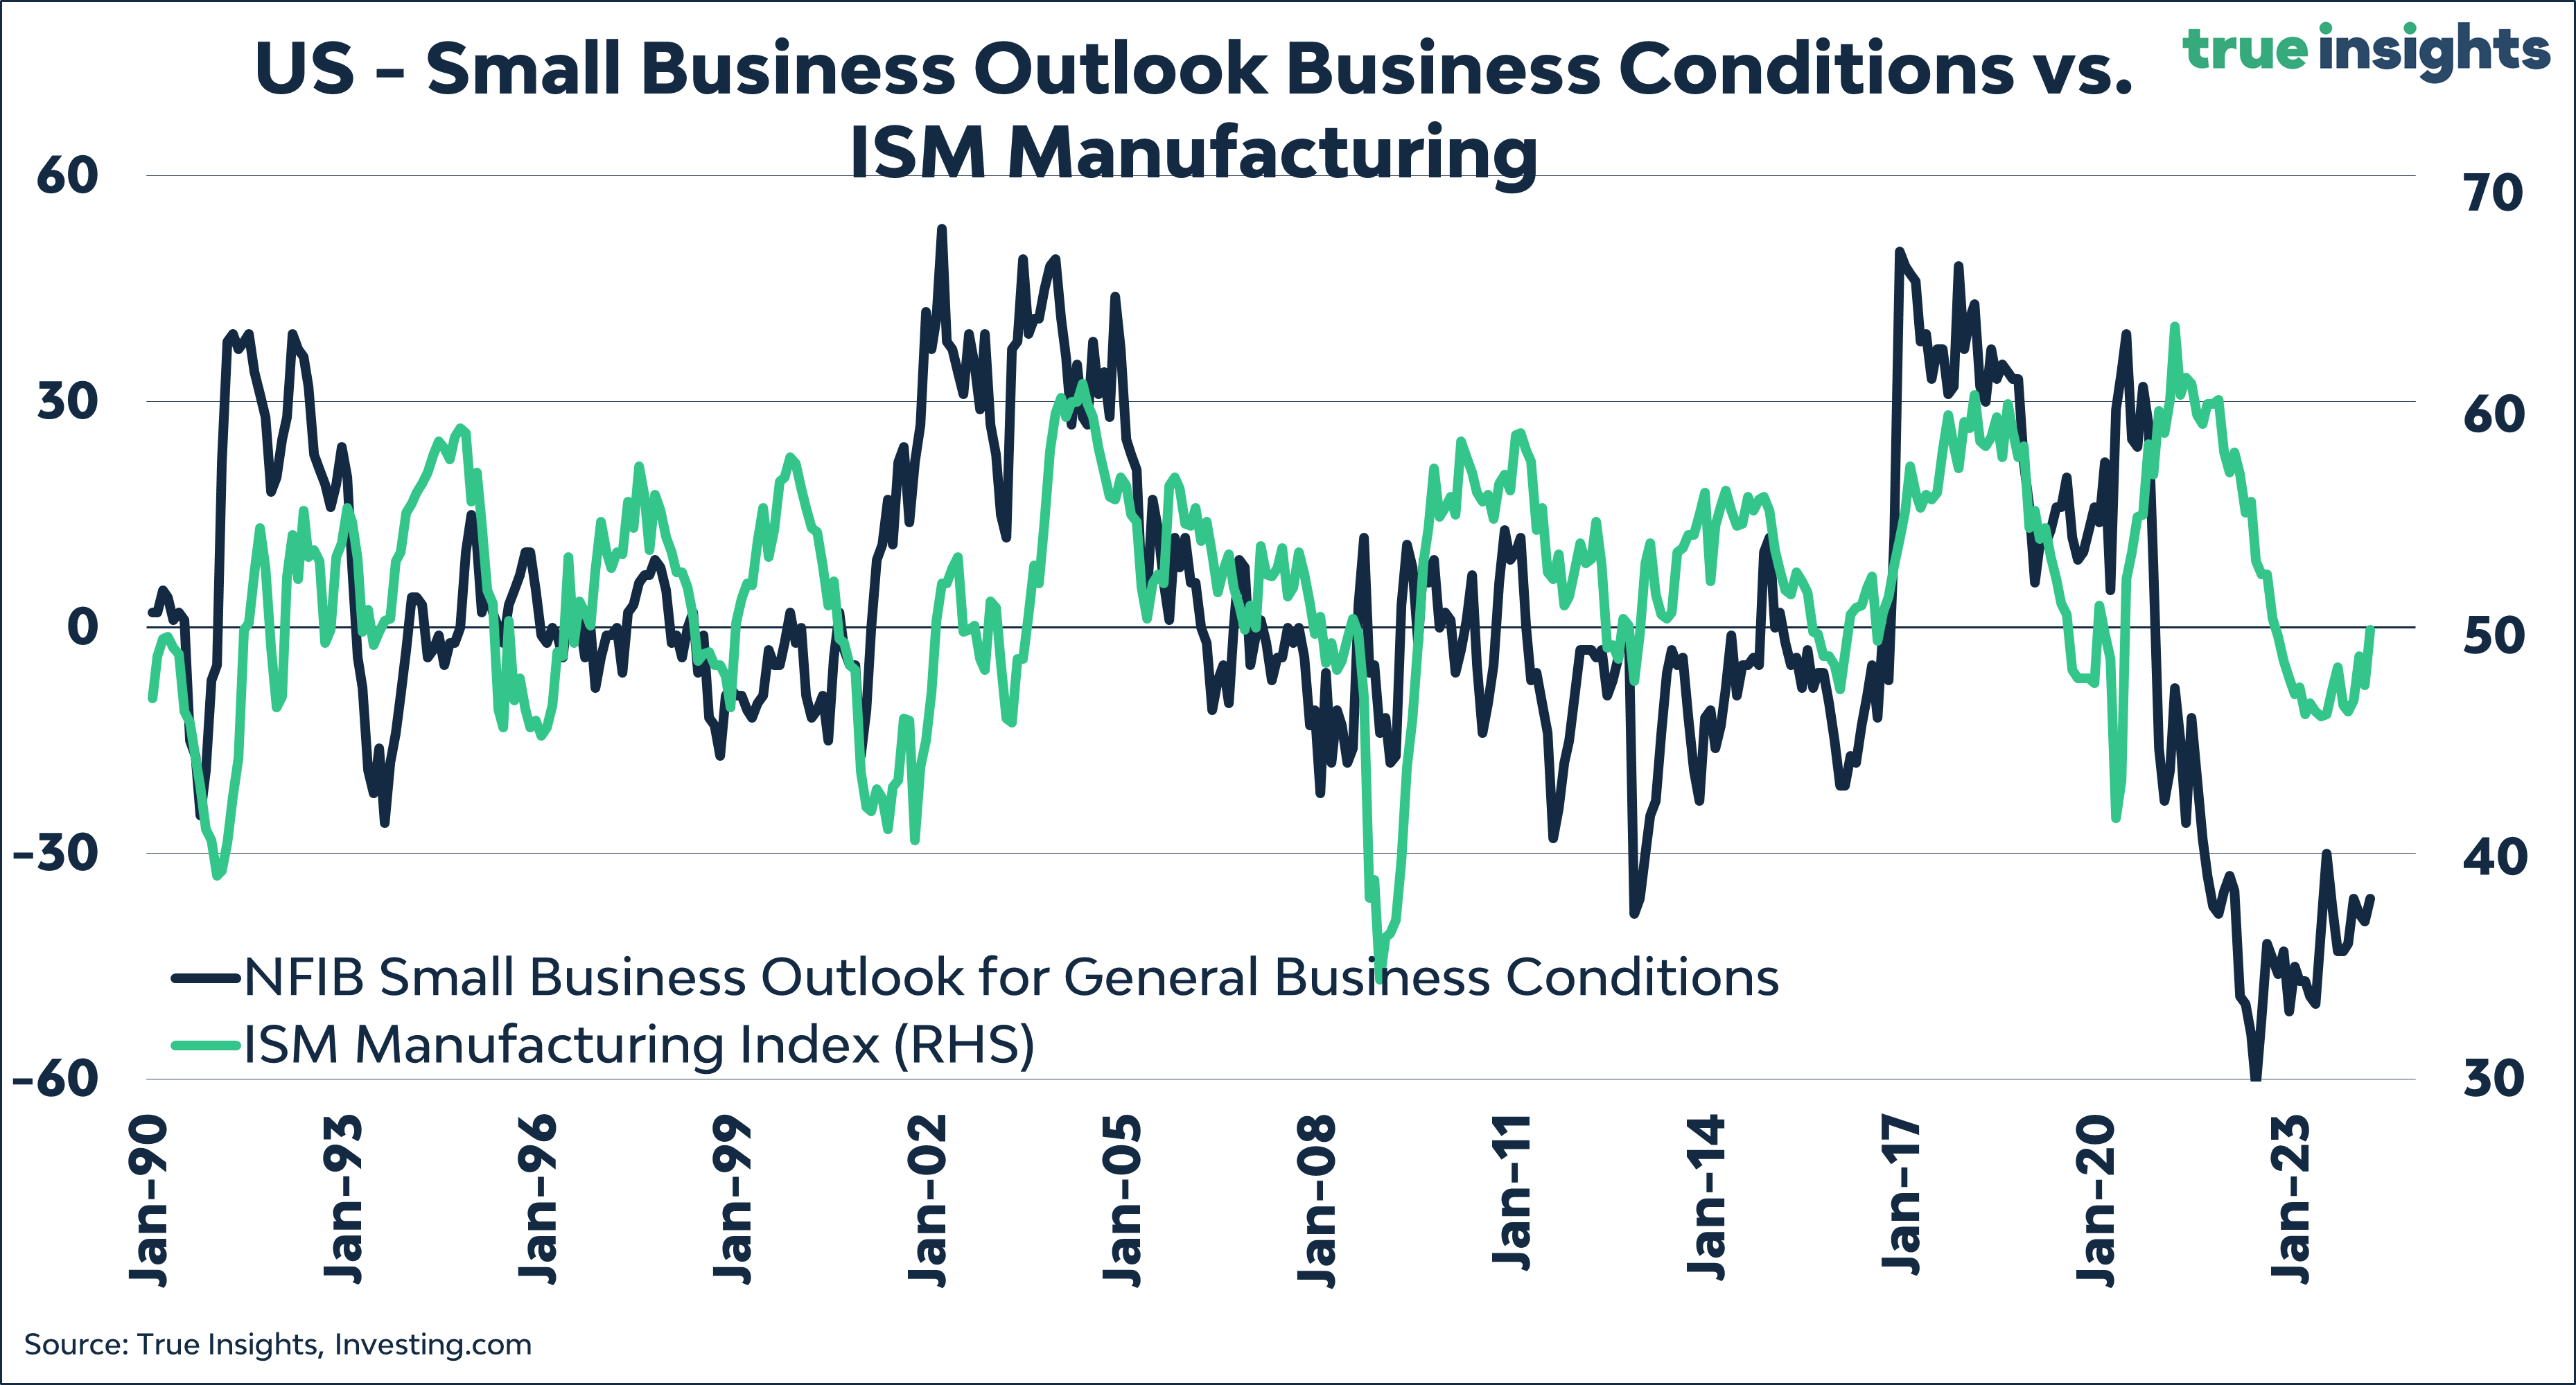
Of course, another factor that could prompt the Fed to make substantial rate cuts is a recession. As I nearly always mention in the Weekly Market Monitor, the likelihood of a US recession has decreased, but it’s definitely not zero.

And the confidence of US small businesses is a significant example of this. In March, US small businesses were the least upbeat since December 2012. That’s right; small businesses are more depressed now than during the COVID crisis. That’s remarkable, considering how severely small businesses suffered from the lockdowns and other mobility restrictions.
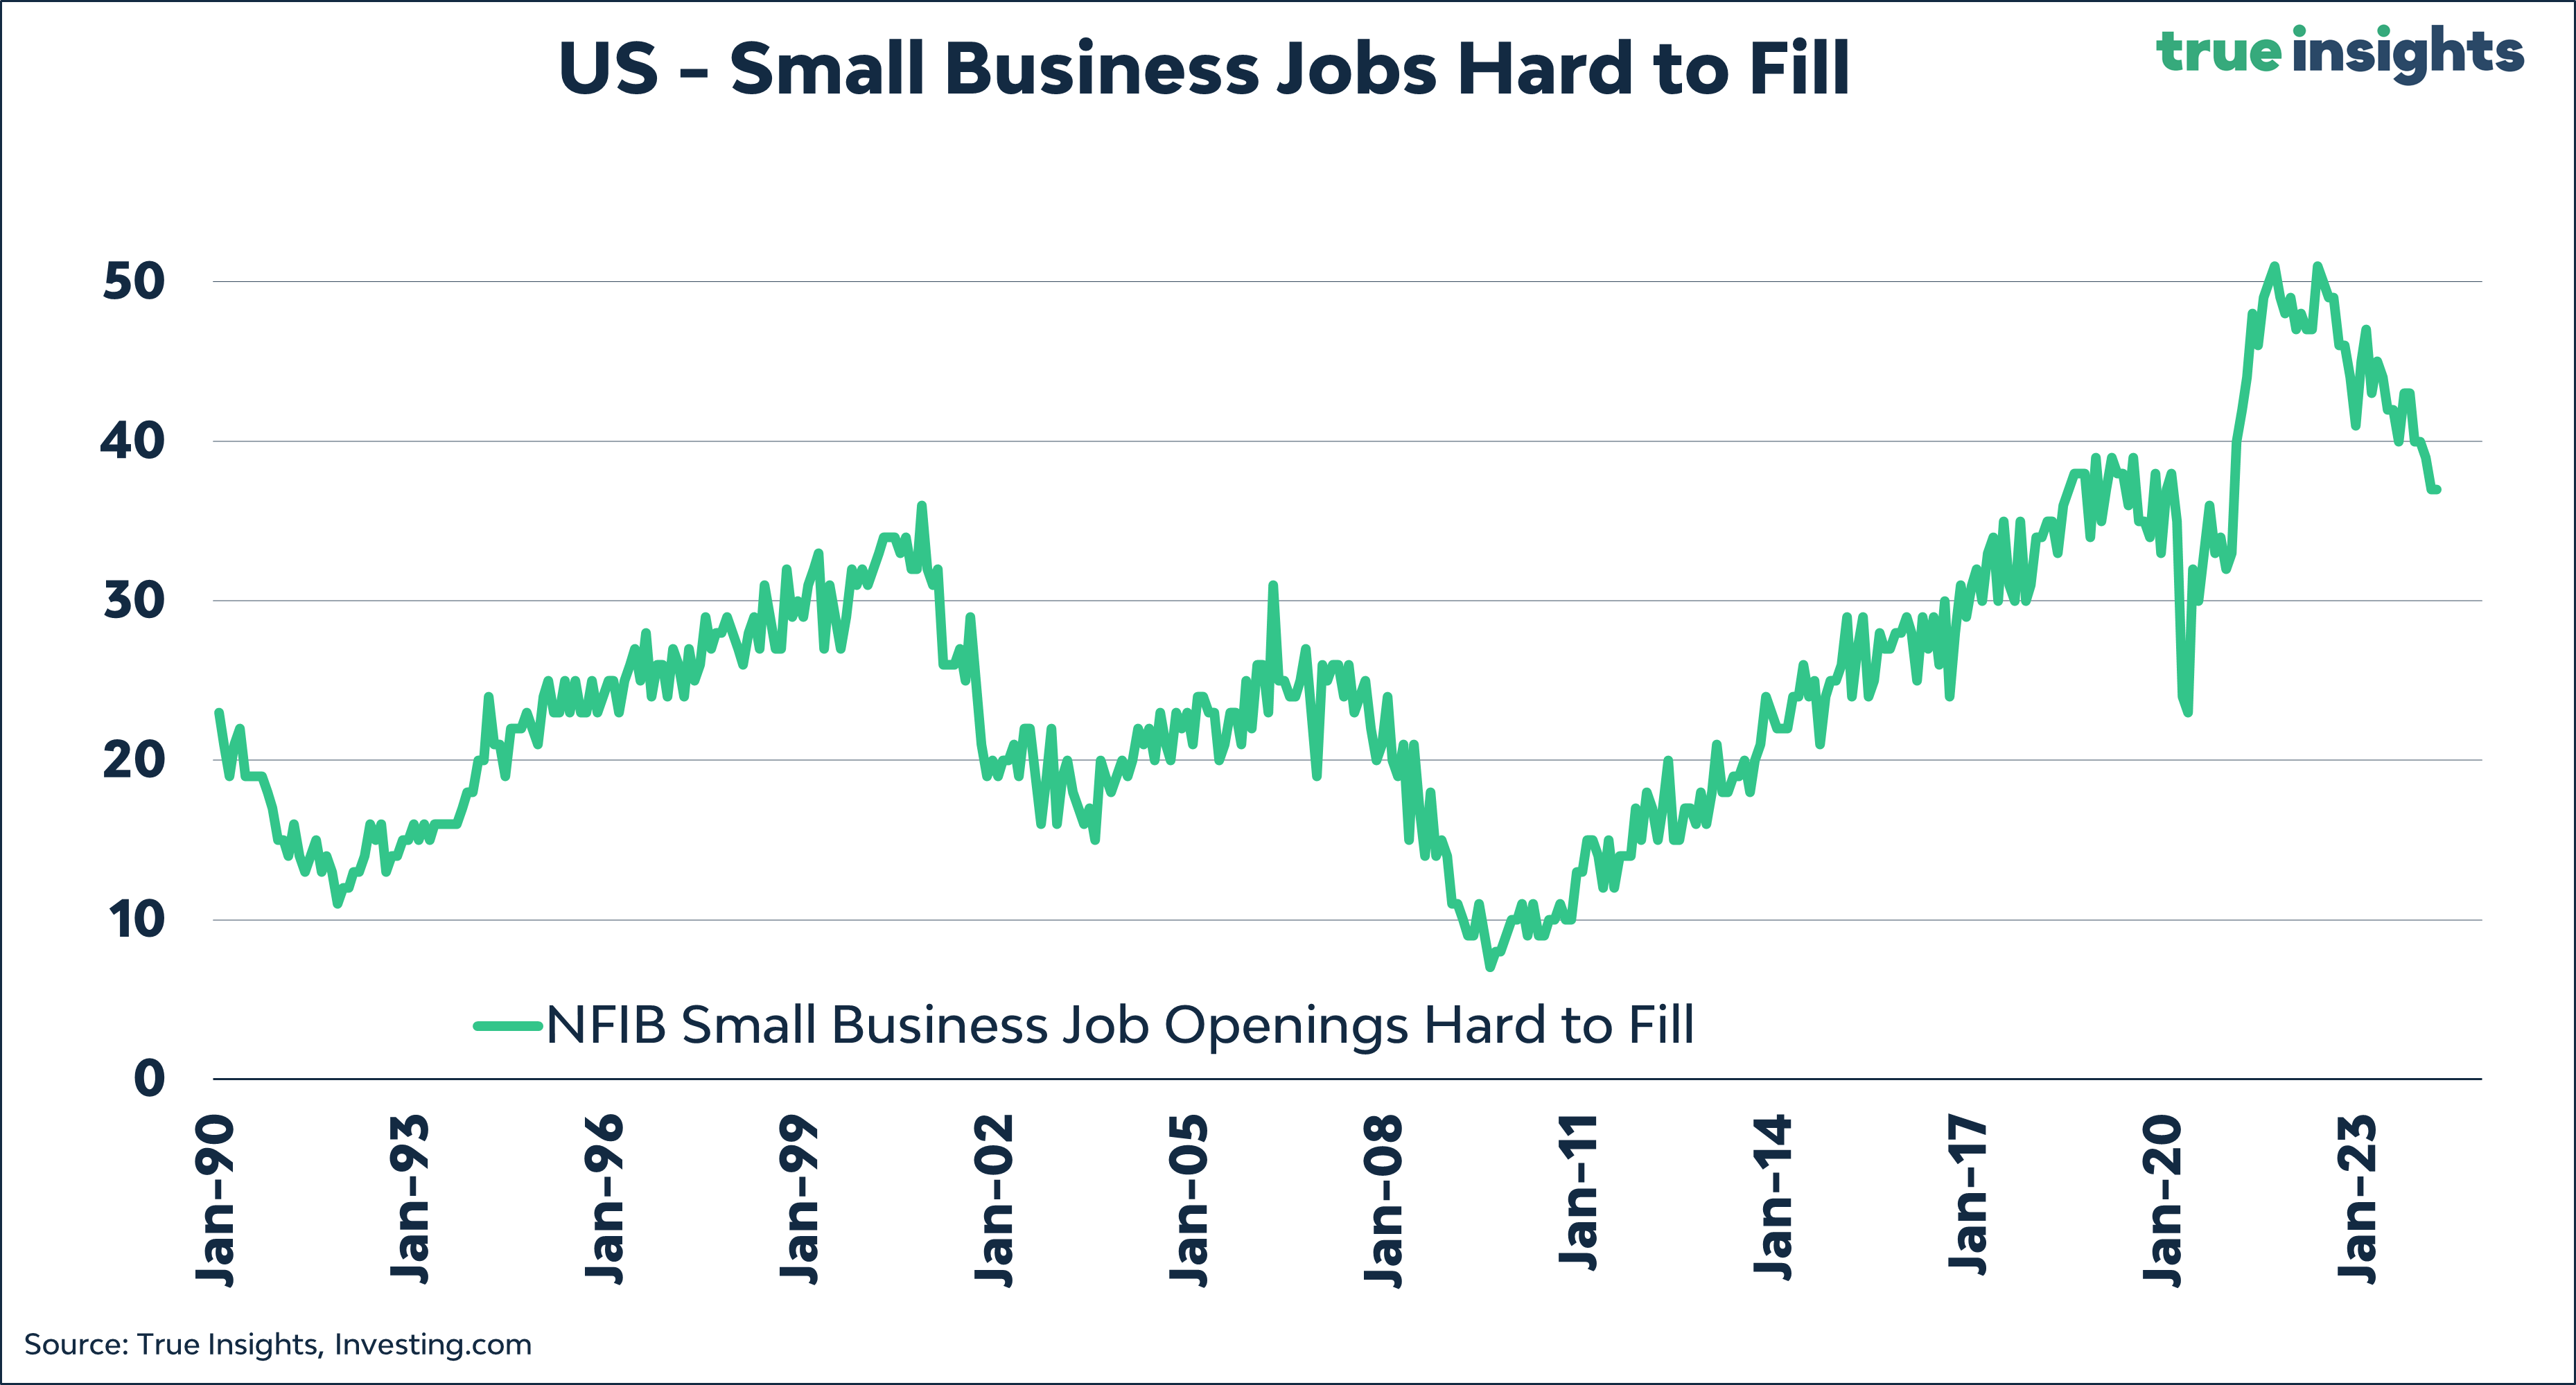
It remains difficult for small businesses to fill their vacancies.
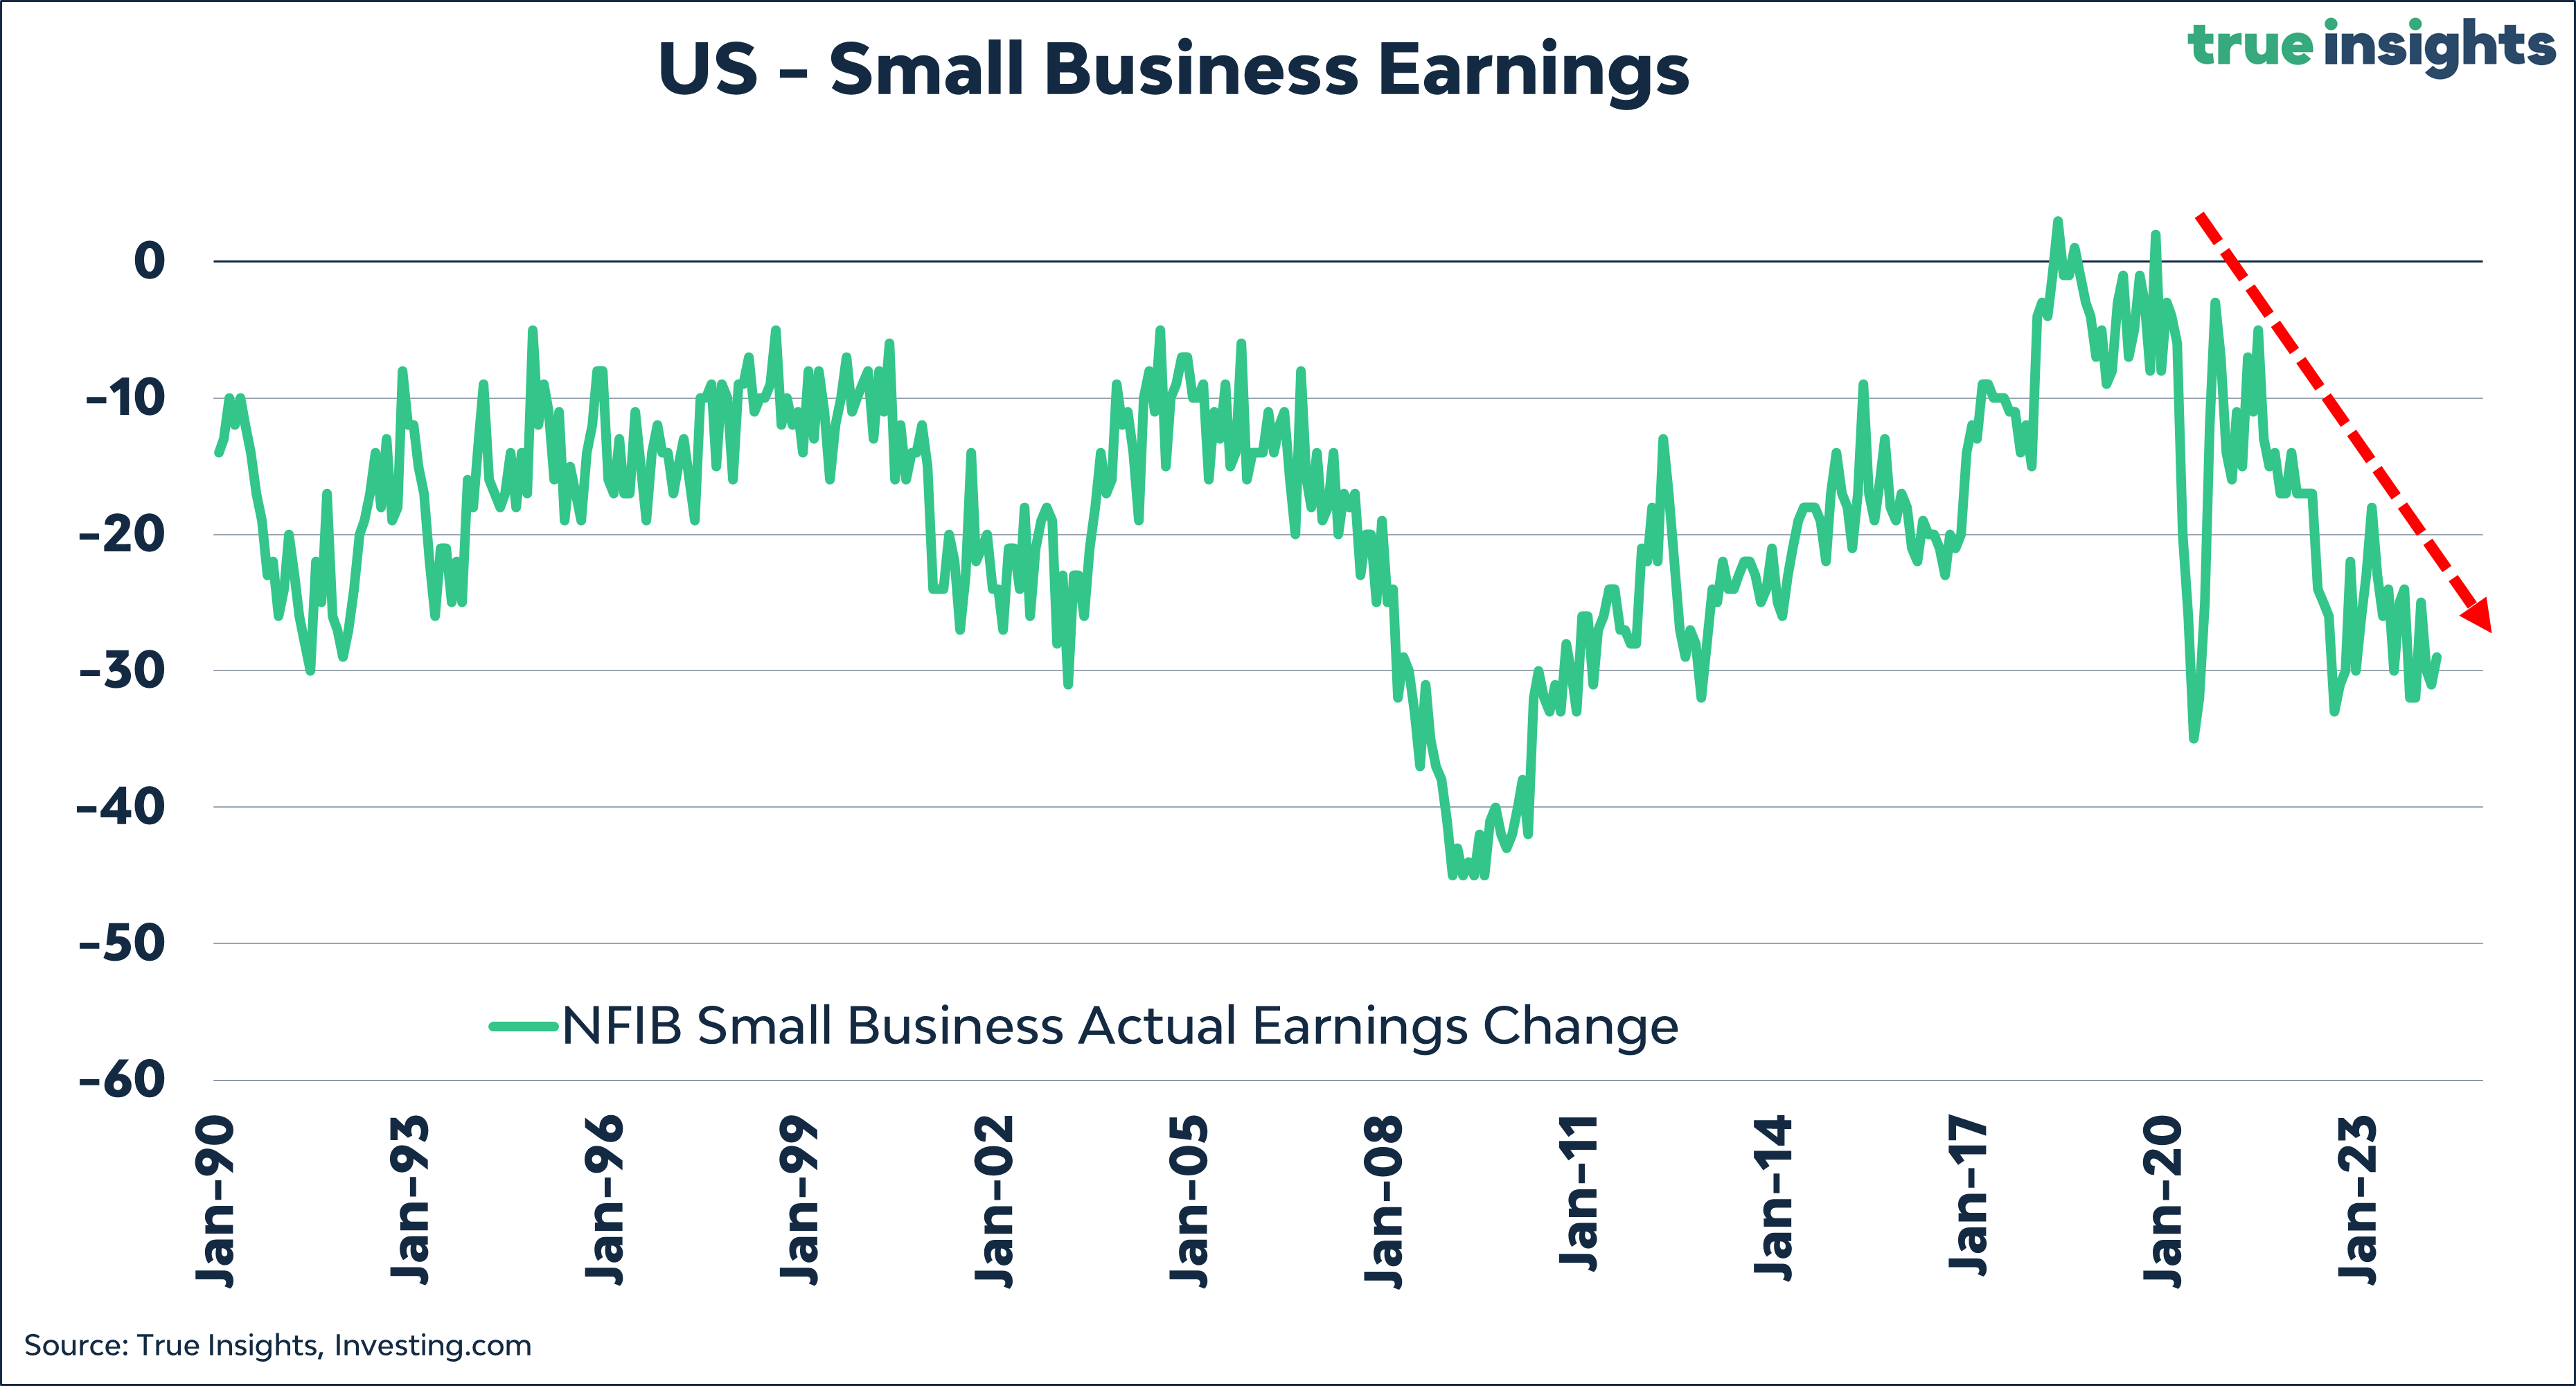
Small businesses are not enthusiastic about their profit outlook.
It’s also notable that more small businesses now expect price pressures, indicating the stickiness of inflation.

But perhaps the most important graph. It concerns the smaller businesses that struggle with finding skilled personnel, the high wages that must be paid, and profit pressure.
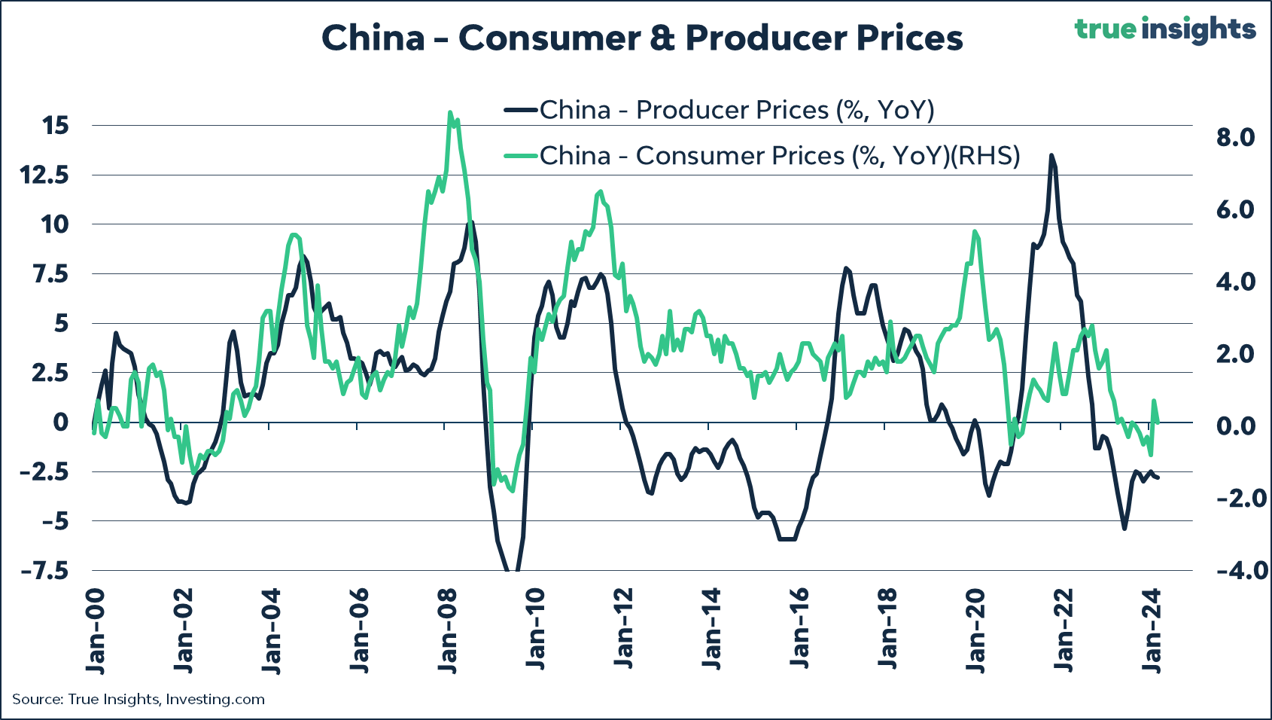
China – noflation
While the US and the Federal Reserve will have to deal with ‘sticky’ inflation, there is no inflation in China. Consumer prices rose by just 0.1% from a year ago, confirming structural demand issues due to the endless decline in house prices (one reason why China retail gold demand is on the rise) and downbeat consumer confidence. China used to combat economic and financial market issues by issuing more debt. But things are way less straightforward these days.
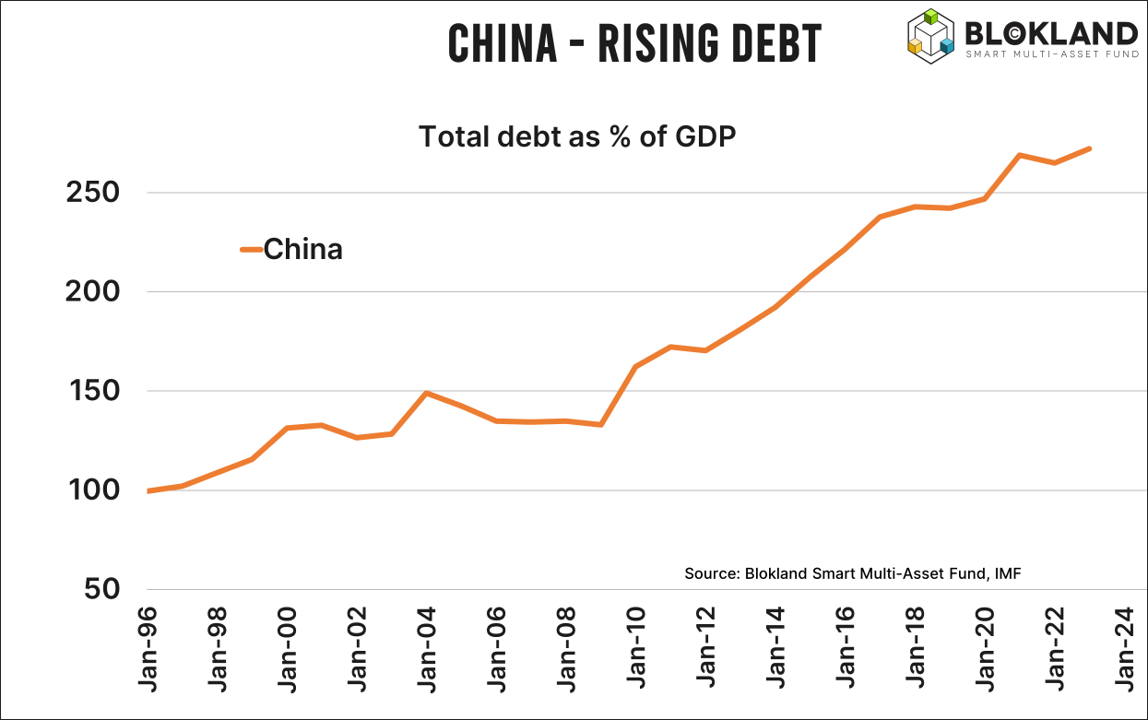
China – another downgrade
Following Moody’s in December, Fitch Ratings downgraded China’s debt outlook from negative to stable. China’s pace of debt accumulation is problematic. Public debt has more than doubled since the Great Financial Crisis and is heading to above 100% of GDP. More importantly, total debt has ballooned from 133% in 2008 to 272%(!) in 2022. It will have risen again in 2023. The current 10-year Chinese bond yield is at 2.30%, which is extremely low for a country that expects to grow by 5% annually. This is no coincidence, as China is experiencing the same debt sustainability issues as every other major economy, and rating agencies must act accordingly.
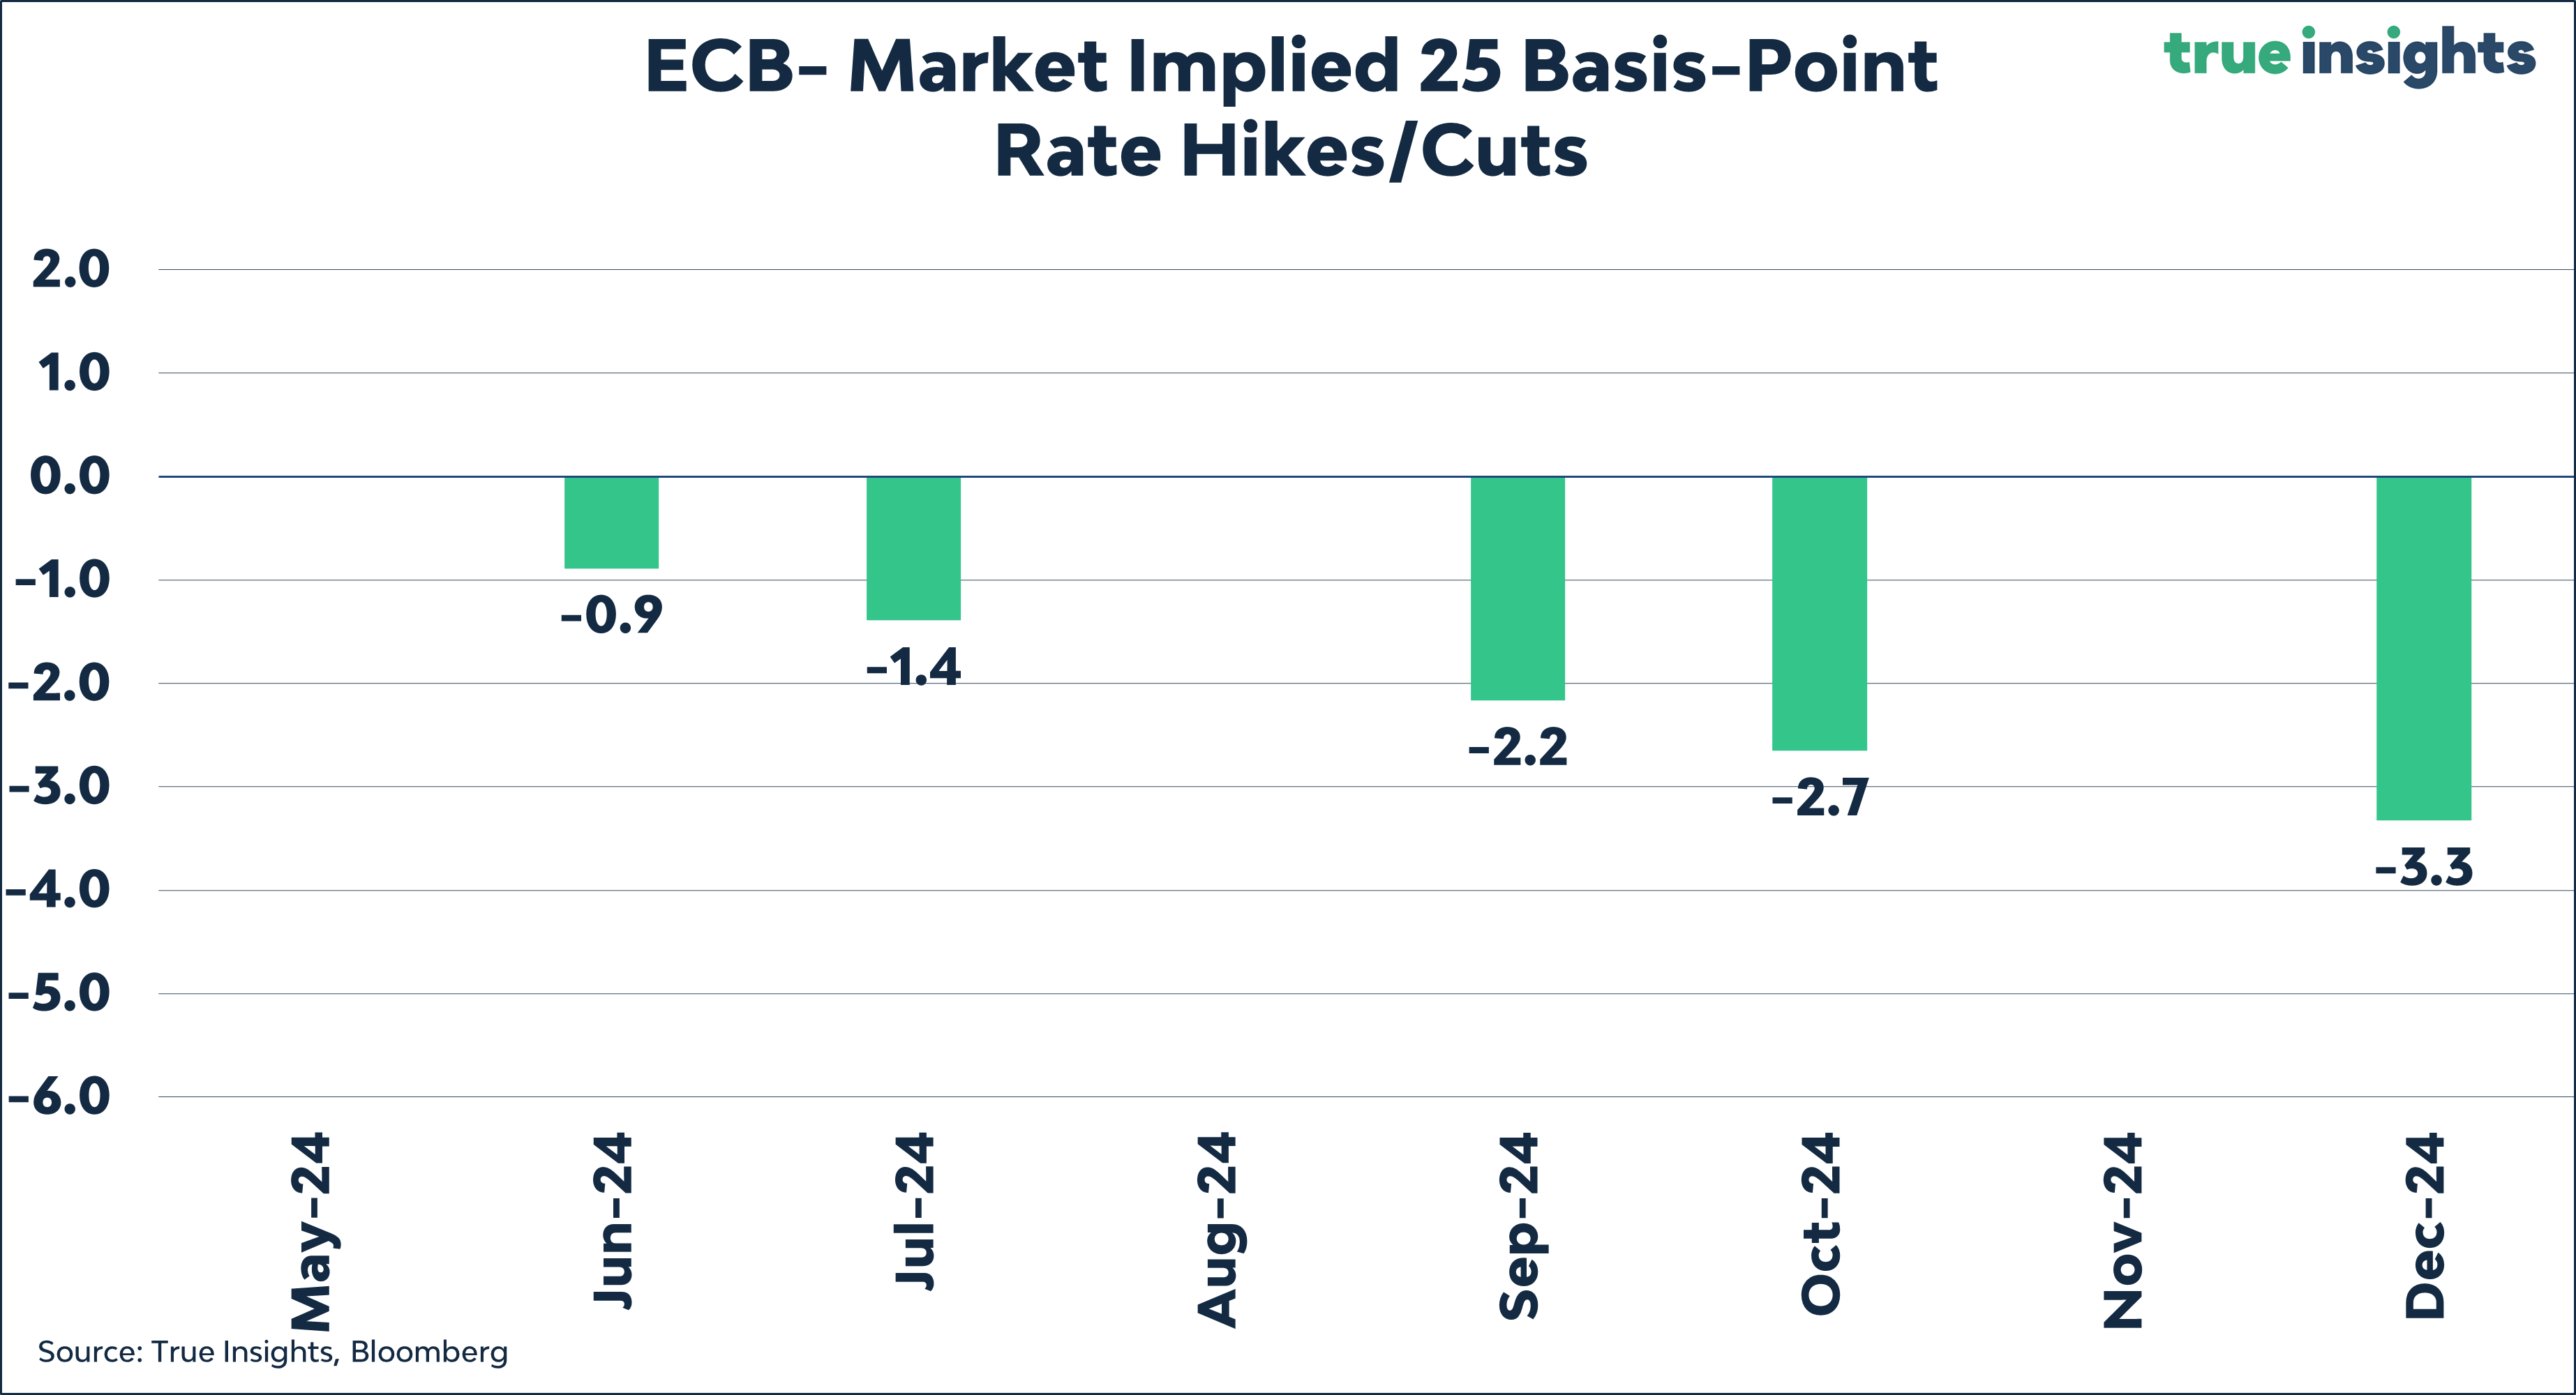
ECB – we are different!
ECB President Lagarde is keen on cutting rates in June. With a Eurozone economy significantly weaker than that in the US, the chances are high that it will happen. Not least because various ECB members, including Lagarde, especially wanted to make it clear that they operate independently of the Fed.

As the snippet below shows, Lagarde didn’t reveal much during the press conference. It was somewhat peculiar that she mentioned reviewing whether the ECB’s hopes will be fulfilled in June. I don’t know what does if that doesn’t indicate a direction. Moreover, the official statement from the ECB was enough to pencil in a rate cut for June.

The divergence between the ECB and the Fed has obvious repercussions for the euro, which has dropped to its lowest point against the US dollar in five months. For investors who are firmly expecting the Fed to cut only once or not at all, this might be a good time to short the euro. I’m in two minds and will take another good look at all the charts.
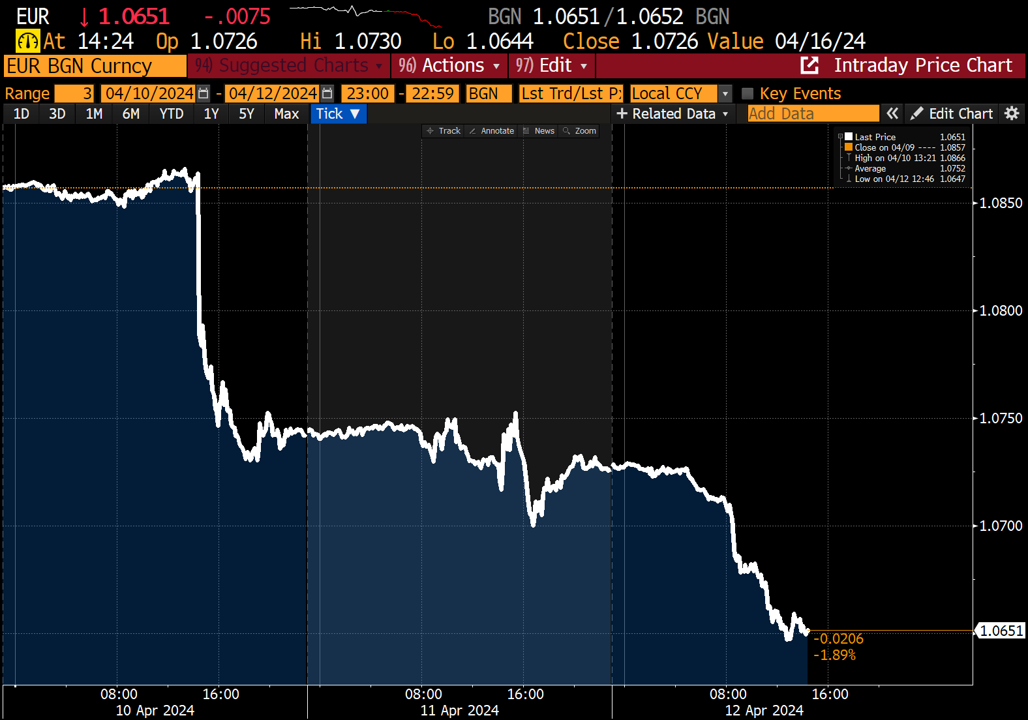
The market is definitely set on an ECB rate cut in June.
Gold is Great!
Gold hit another new all-time high this week. It just keeps going. Below is a brief overview of the driving factors:

A secular trend of adding gold as a hedge against debt monetization (fiscal dominance, if you will) and potential inflation because of that. As Michael Howell recently pointed out, it’s no coincidence that gold started rallying after Fed Governor Waller said he wanted the Fed to buy more Bills instead of Treasuries. This coincides with a massive issuance of Bills by the US government. If you want proof of debt monetization, here it is.
Additionally, the following factors are at play:
A secular trend of China boosting foreign gold reserves at the expense of the US dollar.
A medium-term trend of Chinese consumers buying gold because their house prices—the primary source of Chinese consumer wealth—continue to decline.
A short-term trend of increasing geopolitical tensions at a time when Treasuries offer less of a hedge because inflation is sticky.
Short- and medium-term factors may eventually turn and potentially cause headwinds for the gold price. However, the secular trends have only become stronger, and the next crisis could trigger a major shift from bonds to gold.
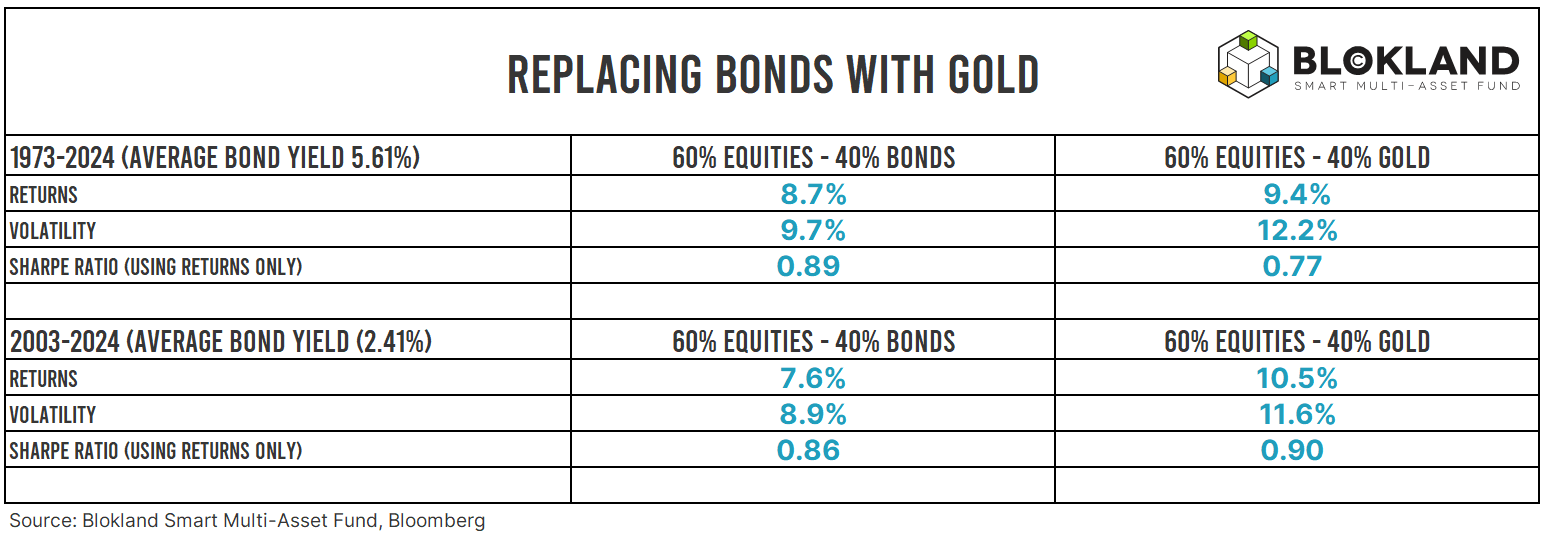
In addition, Meb Faber recently calculated that it wouldn’t have made much difference if you had filled a 60-40 portfolio. This should be a significant eye-opener for many investors since, on a stand-alone basis, gold is riskier than bonds.
But it doesn’t stop there. I’ve taken the liberty of doing a similar analysis based on Bloomberg data for the US (MSCI USA, Bloomberg US Aggregate Treasury Index) over a shorter period. Normally, you’d want to make the research period as long as possible. Still, with debt monetization and fiscal dominance getting ever more important, a shorter period also gives useful information. Since 2003, the risk-return trade-off for the 60-40 portfolio with gold has been better. What if the interest rate drops to 2% and inflation stays structurally at 3%?
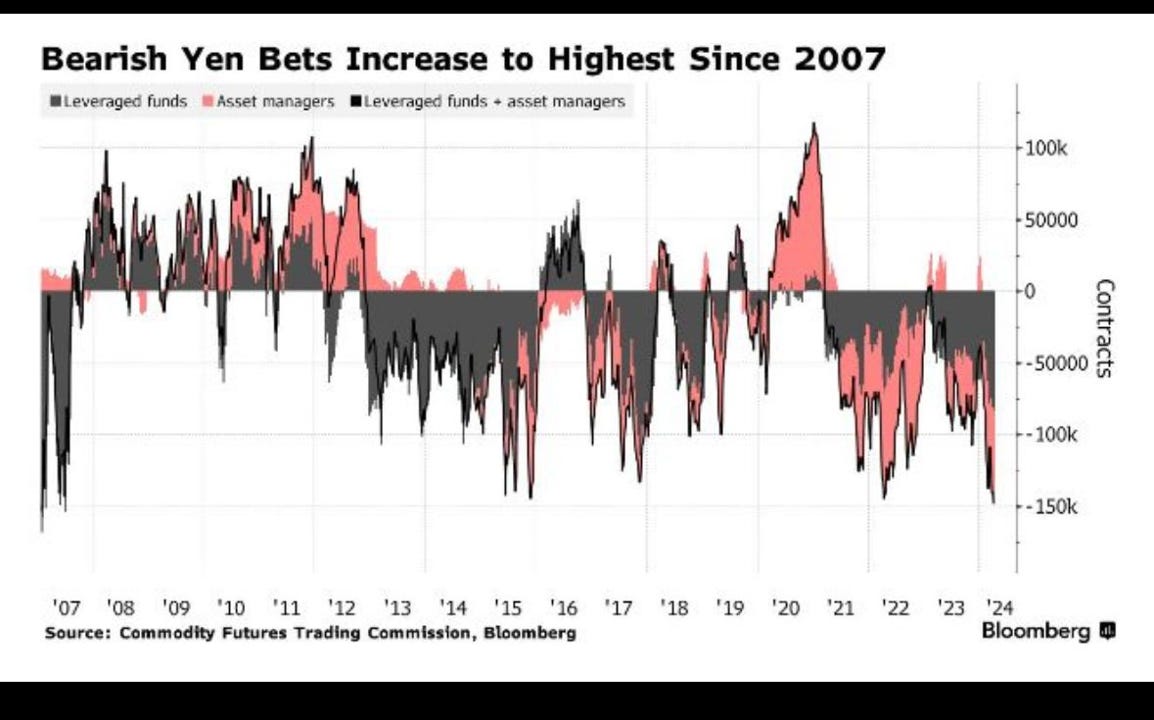
Yen Closing
It was a minor trade, and I exited with a small loss. The yen has broken through the USD 153 barrier, which triggered the stop-loss. Yet, the positioning imbalance keeps growing.
Sentiment
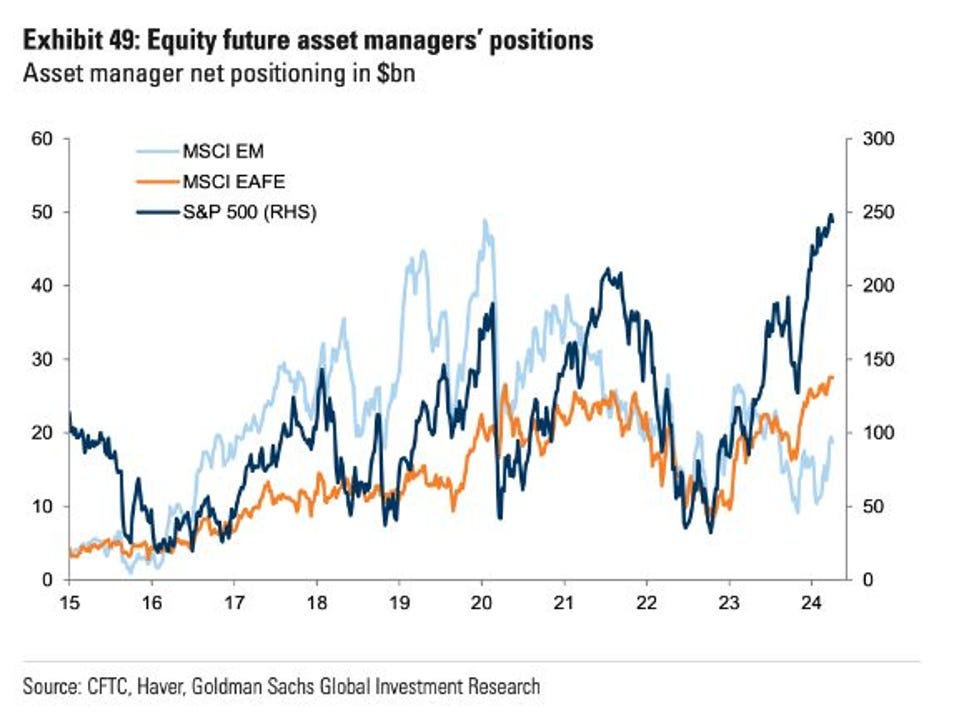
Futures Positioning
Futures investors are very enthusiastic about the US.
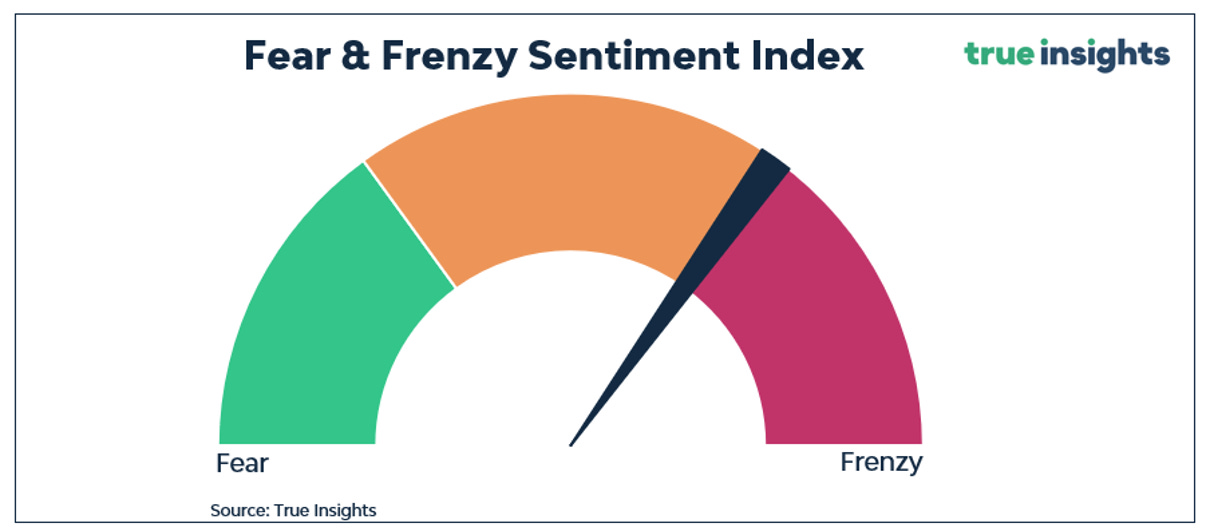
Fear & Frenzy
The Fear & Frenzy Index stands right between Neutral and Frenzy.
Valuation

It’s still very early, with only 23 of the 499 companies in the S&P 500 Index reporting their earnings. But these were much better than expected. The big question for this earnings season is whether companies indicate that the outlook has improved, as my bellwether earnings indicator suggests. If so, there is a solid floor under the stock markets.
ENJOY YOUR WEEKEND!
JEROEN
MARKETS
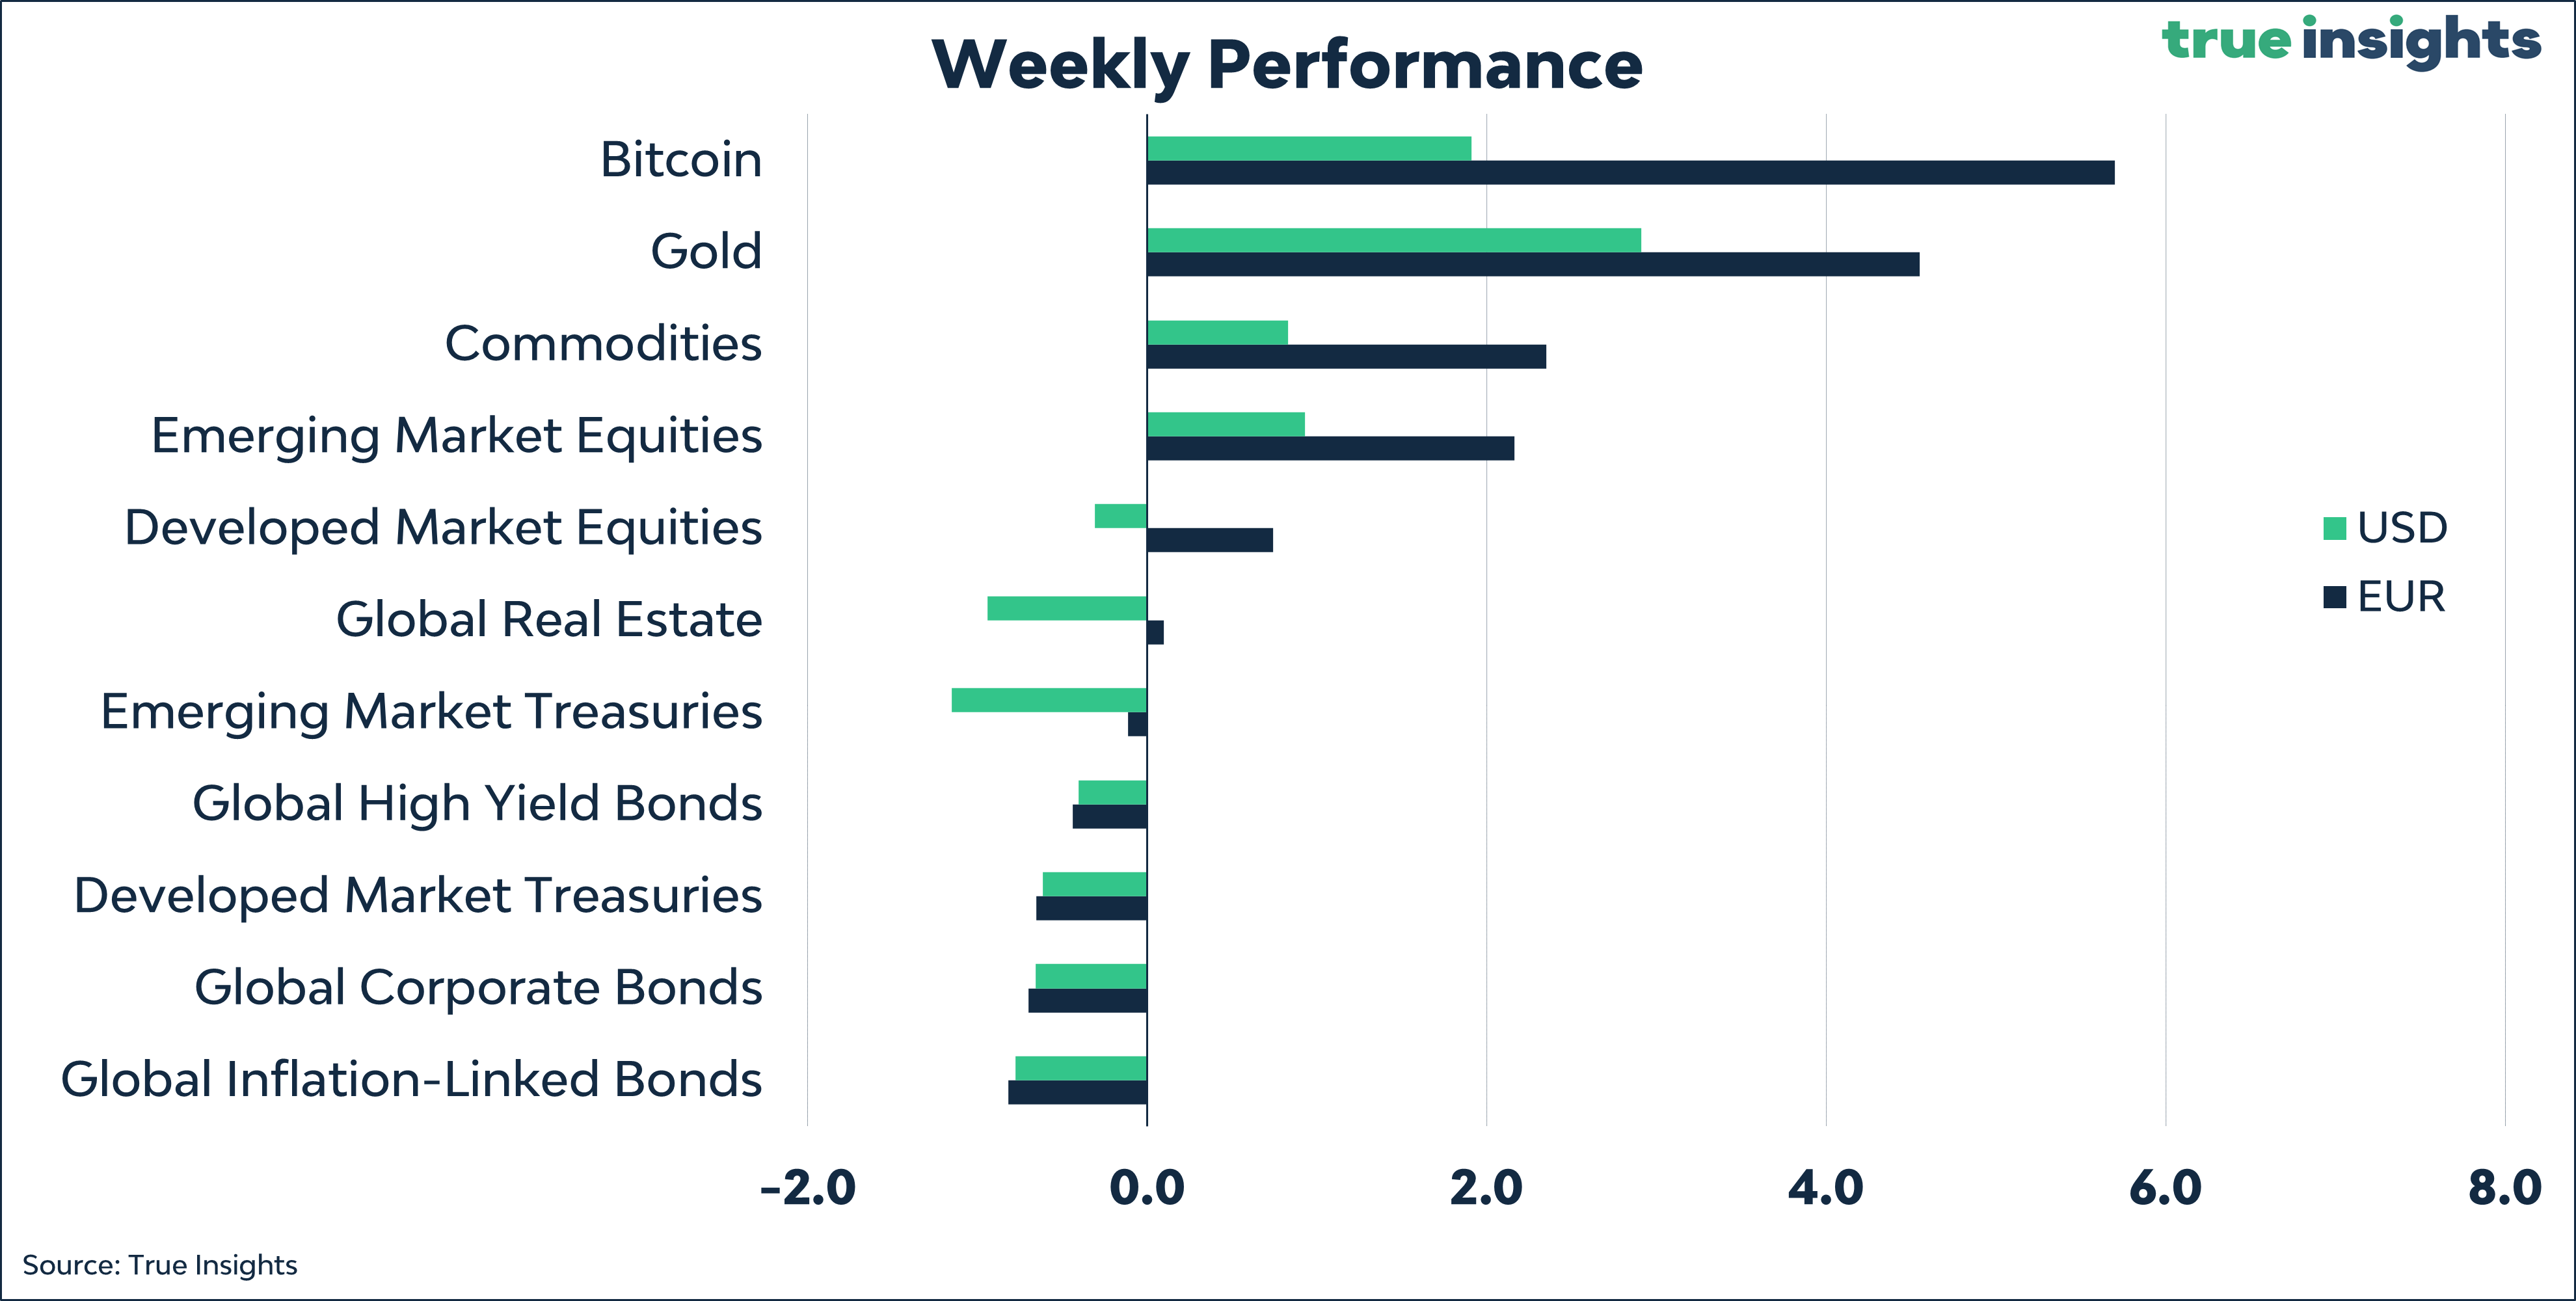
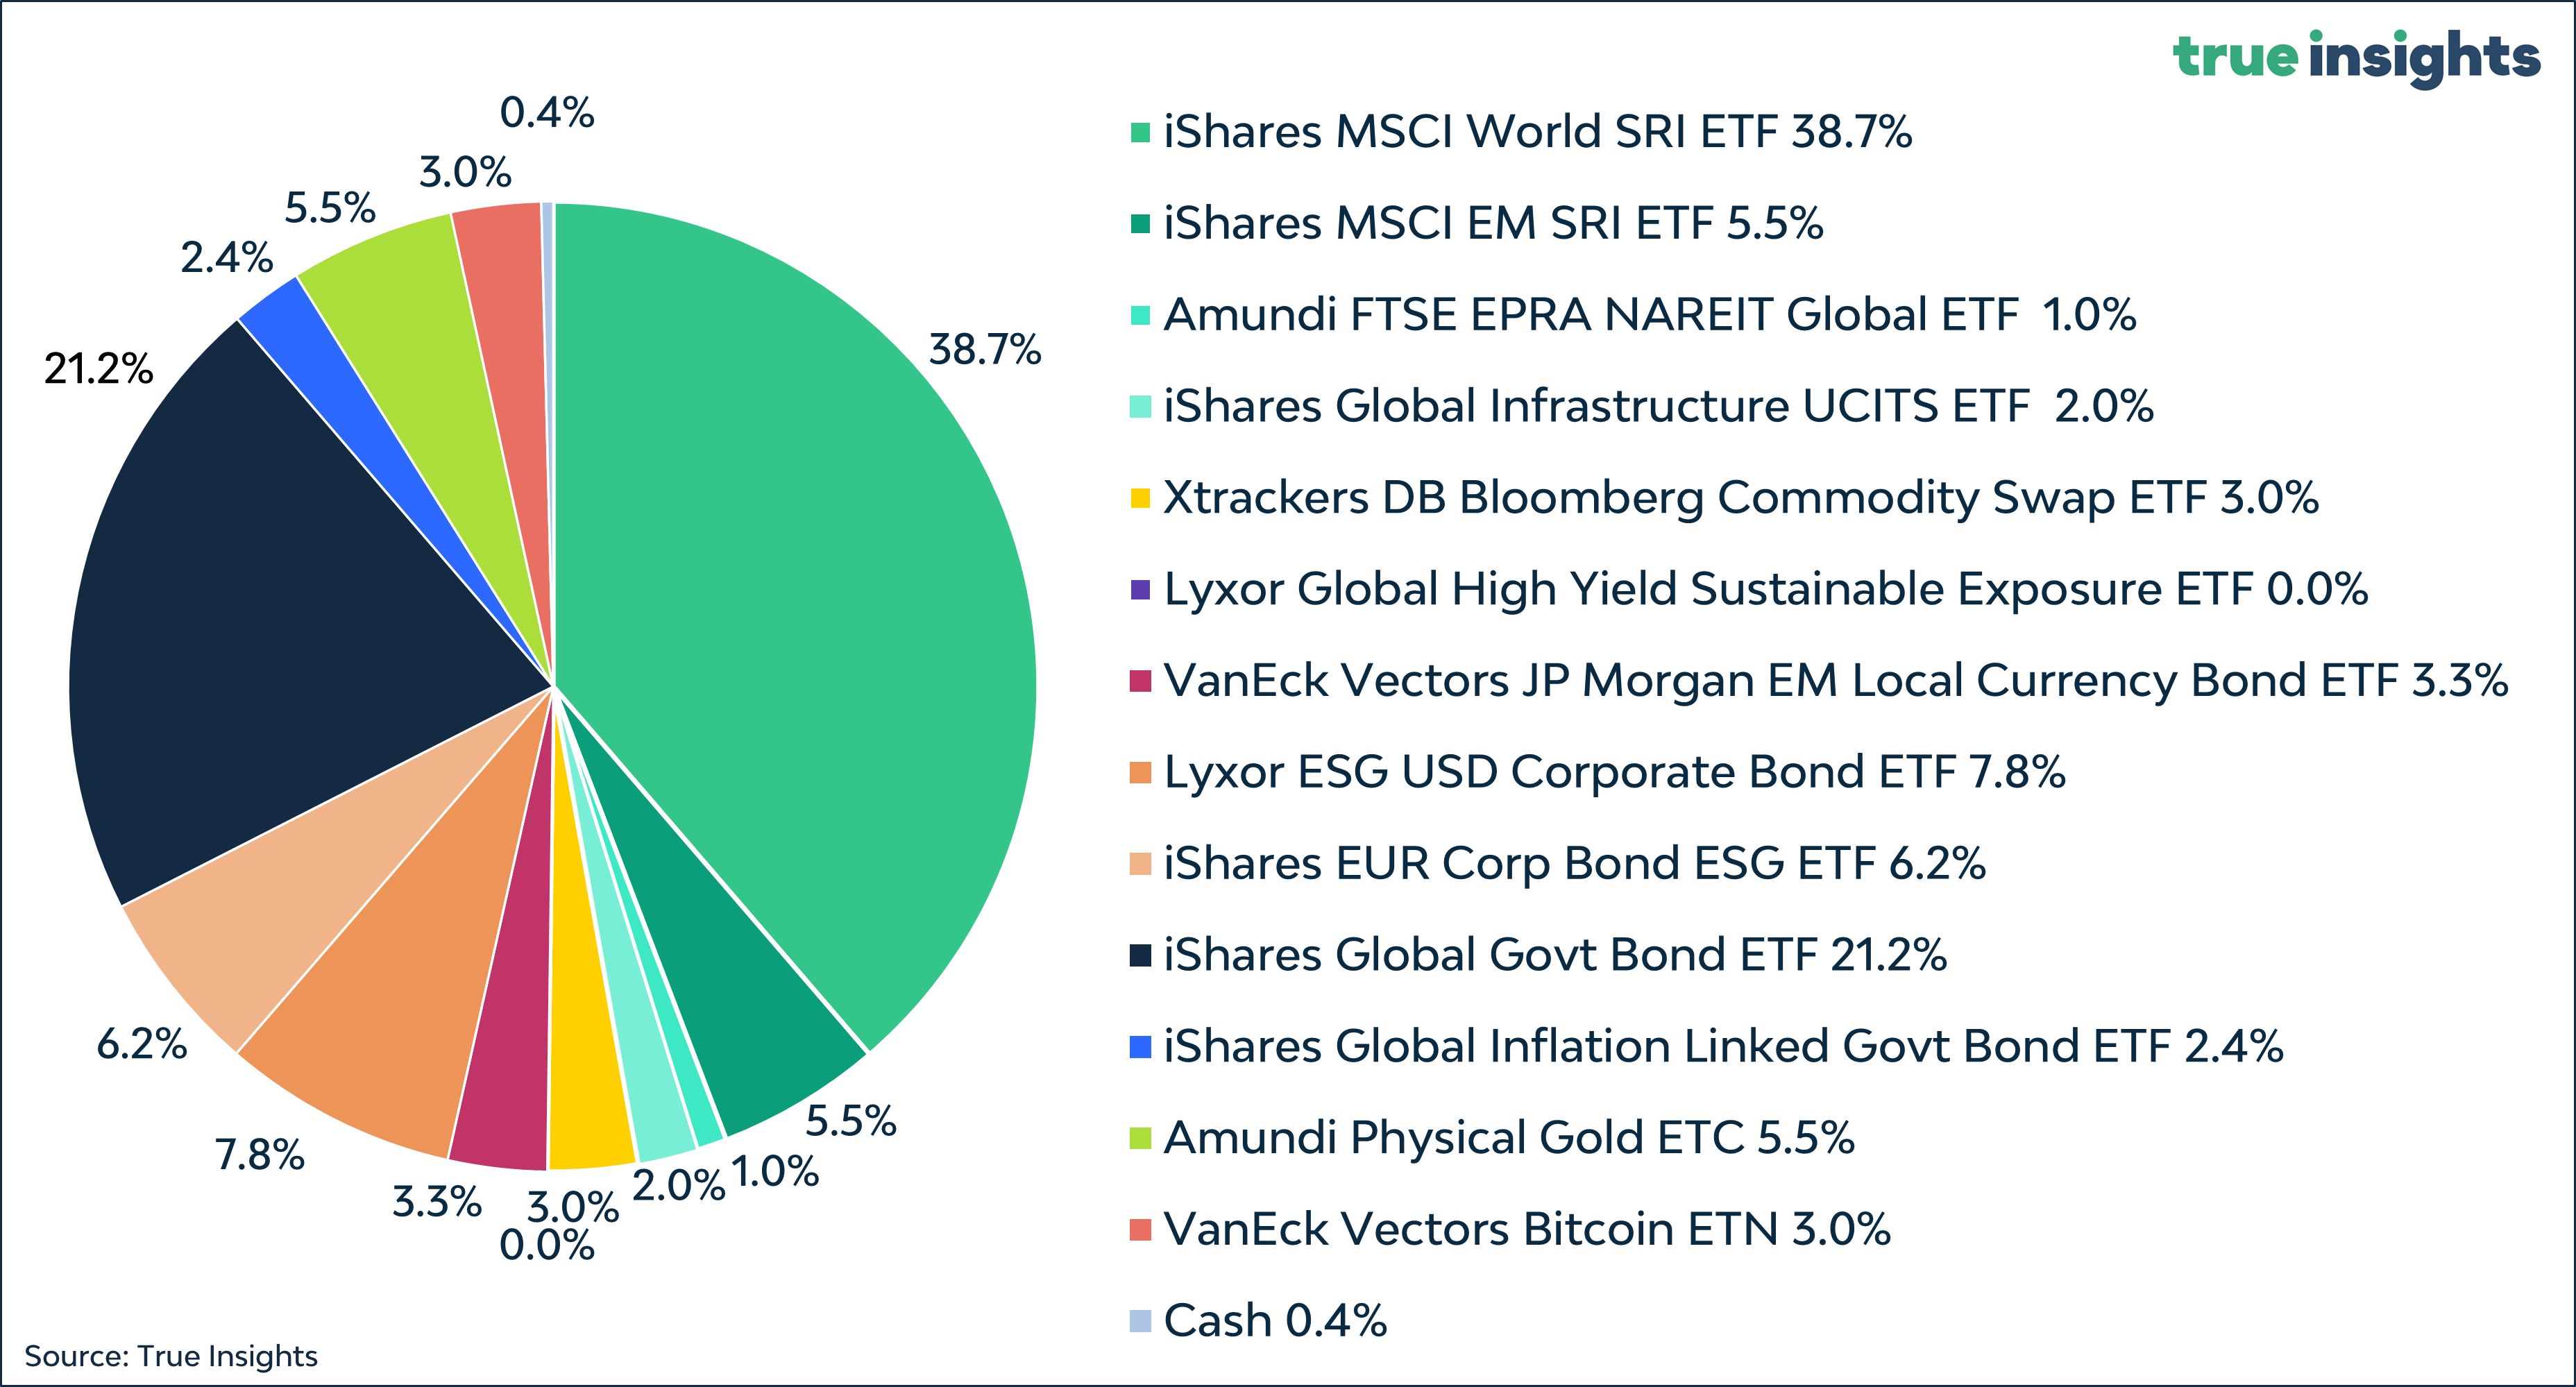
Active Weights

Balanced Portfolio