
The Weekly Market Monitor – Rockets roar while Hawks take off
The Weekly Market Monitor – Rockets roar while Hawks take off
Missiles and drones fired, and Powell adjusting forward guidance hit sentiment.

First things first! – When things collide!
Risk assets have been under pressure in recent weeks. Escalating tensions between Israel and Iran, which are now directly targeting each other, is one key reason. While this may turn out to be a case of “flexing muscles,” it’s not surprising that risk premiums must at least temporarily rise. Typically, investors struggle to deal with political issues because their binary nature makes them difficult to incorporate into an investment framework. However, that doesn’t mean the risks should be overlooked.

Where did it all go wrong
The headline above is a bit of clickbait, as things are not that bad, but it’s clear that sentiment is turning. The previous euphoria over rate cuts gives way to concerns about persistently high interest rates squeezing the economy. More on this below.

Retail sales – too bullish
US retail sales increased by 0.7% in March, significantly more than expected. Additionally, the growth figure for the previous month was revised upwards to 0.9%.

Even more spectacular is the control group retail sales growth, excluding volatile components like food services, auto dealers, building materials, and gas stations. Based on the last three months, these rose by 5.6%. Just after I so candidly drew that red arrow downward two months ago.

Pivot Powell
In a previous insight, ‘Running out of Runway,’ I indicated that the stage for Powell to perform his dovish act had become remarkably small.

At an event this week, Powell provided a preview of what we can expect at the next FOMC press conference. Powell mentioned that there is “a lack of progress on inflation” and that policymakers “can maintain the current level of restriction” for as long as it is needed. This represents a 180-degree turn from Powell’s earlier comments that the January and February CPI figures were a possible disruption of a further positive trend.

Nevertheless, Powell still has plenty of room to cut rates even if inflation remains around 3%. The Fed can push the narrative that interest rates are restrictive and above the neutral rate for a long time.
Yield is good?
And then there’s a narrative currently emerging—and uncritically adopted by many—that higher interest rates are, in fact, the reason the economy is doing so well.
Apart from the fact that European economies are not performing well, US data does not indicate that interest income is the main reason the American economy continues to shine. Why market pundits are largely echoing each other is unclear to me.
Changes in US household net worth, representing the asset side of the household balance sheet, are dominated by stocks and real estate, not by fixed income.

Since 2020, the increased value in stocks and real estate accounts for 80% of the total US household net worth increase.

The findings above are supported by the fact that debt securities comprise only 6% of US household assets. The percentage of money market funds (excluding cash at the bank) is roughly half of that. In contrast, stocks make up about 40% of US household assets.
Other perspectives, such as inflation-adjusted interest income, do not indicate a significant boost that can explain the resilience of the US consumer.

Mortgages represent about 62% of the liabilities side of the US household balance sheet. In other words, the interest rate sensitivity of the liability side of the balance sheet is much greater than that of the asset side.

Of course, if people stay in their homes and do not refinance, the impact of higher interest rates does not need to be felt. However, the impact of higher interest rates on the asset side of the balance sheet—aside from the fact that every bond with any duration is underwater—is simply too small to explain the strong performance of the US economy.
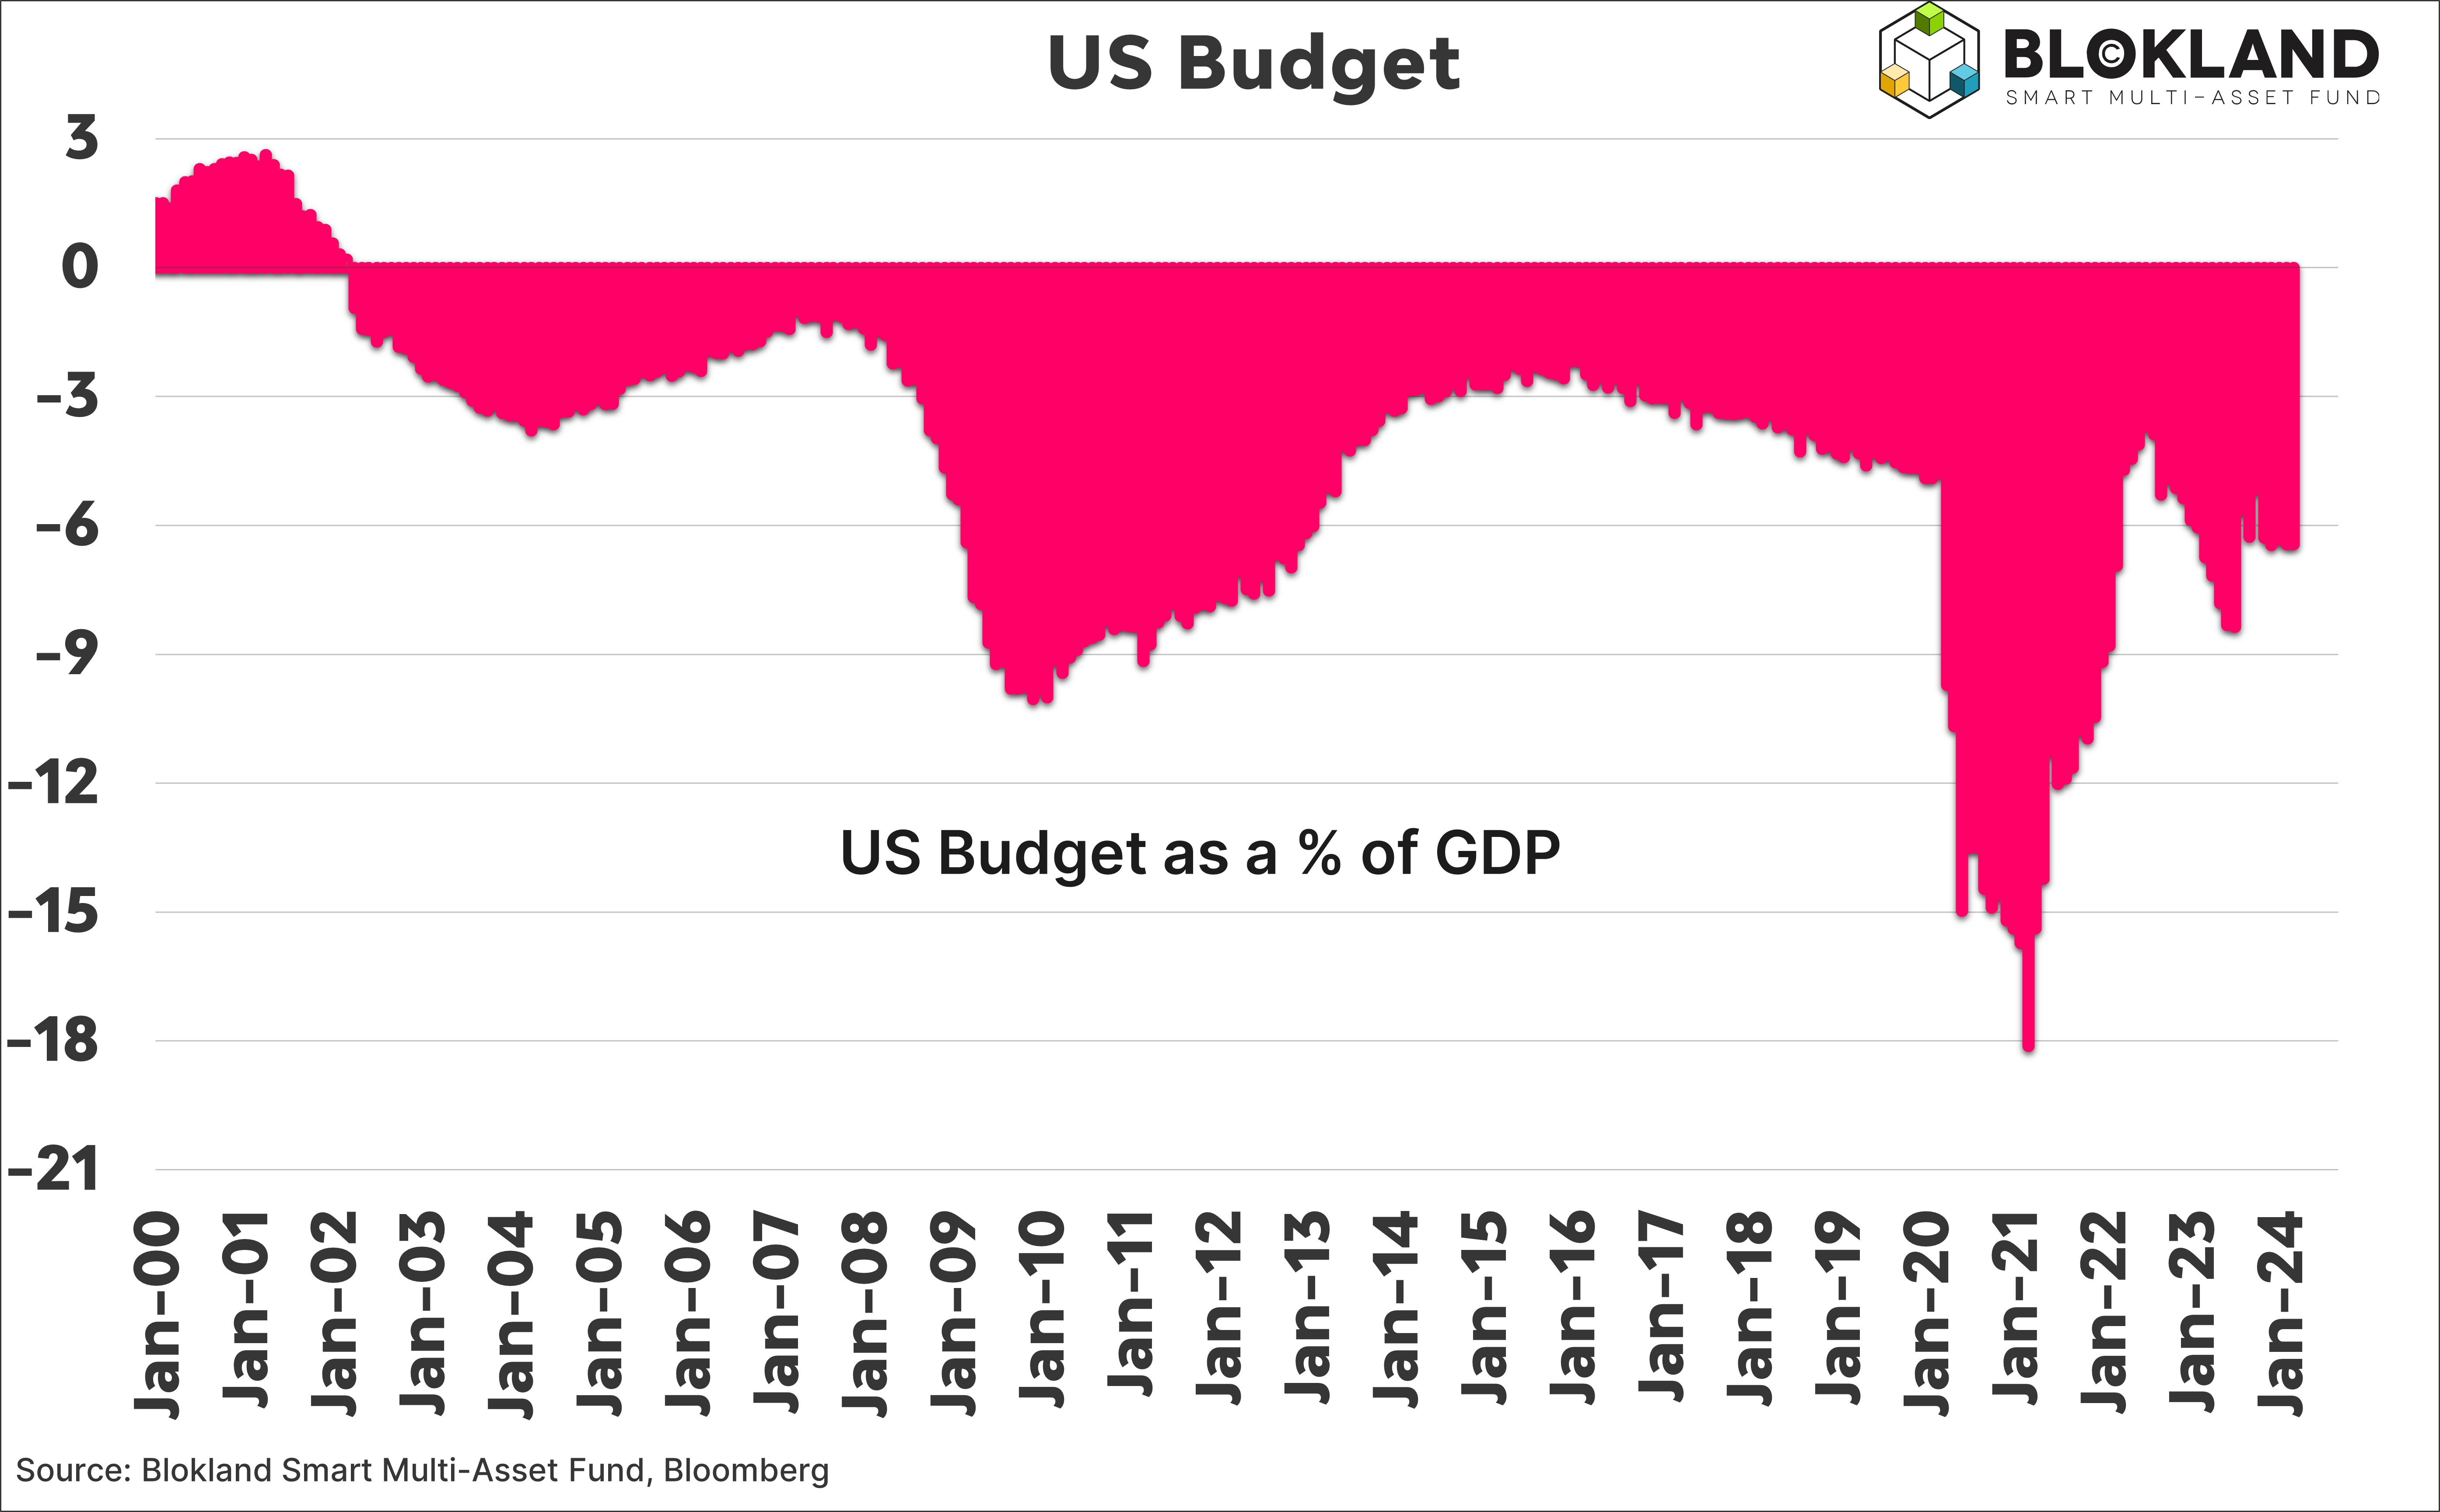
If you want an additional explanation beyond equities and real estate, look at the US government. It is on track for another 6%+ budget deficit when GDP growth is above average.
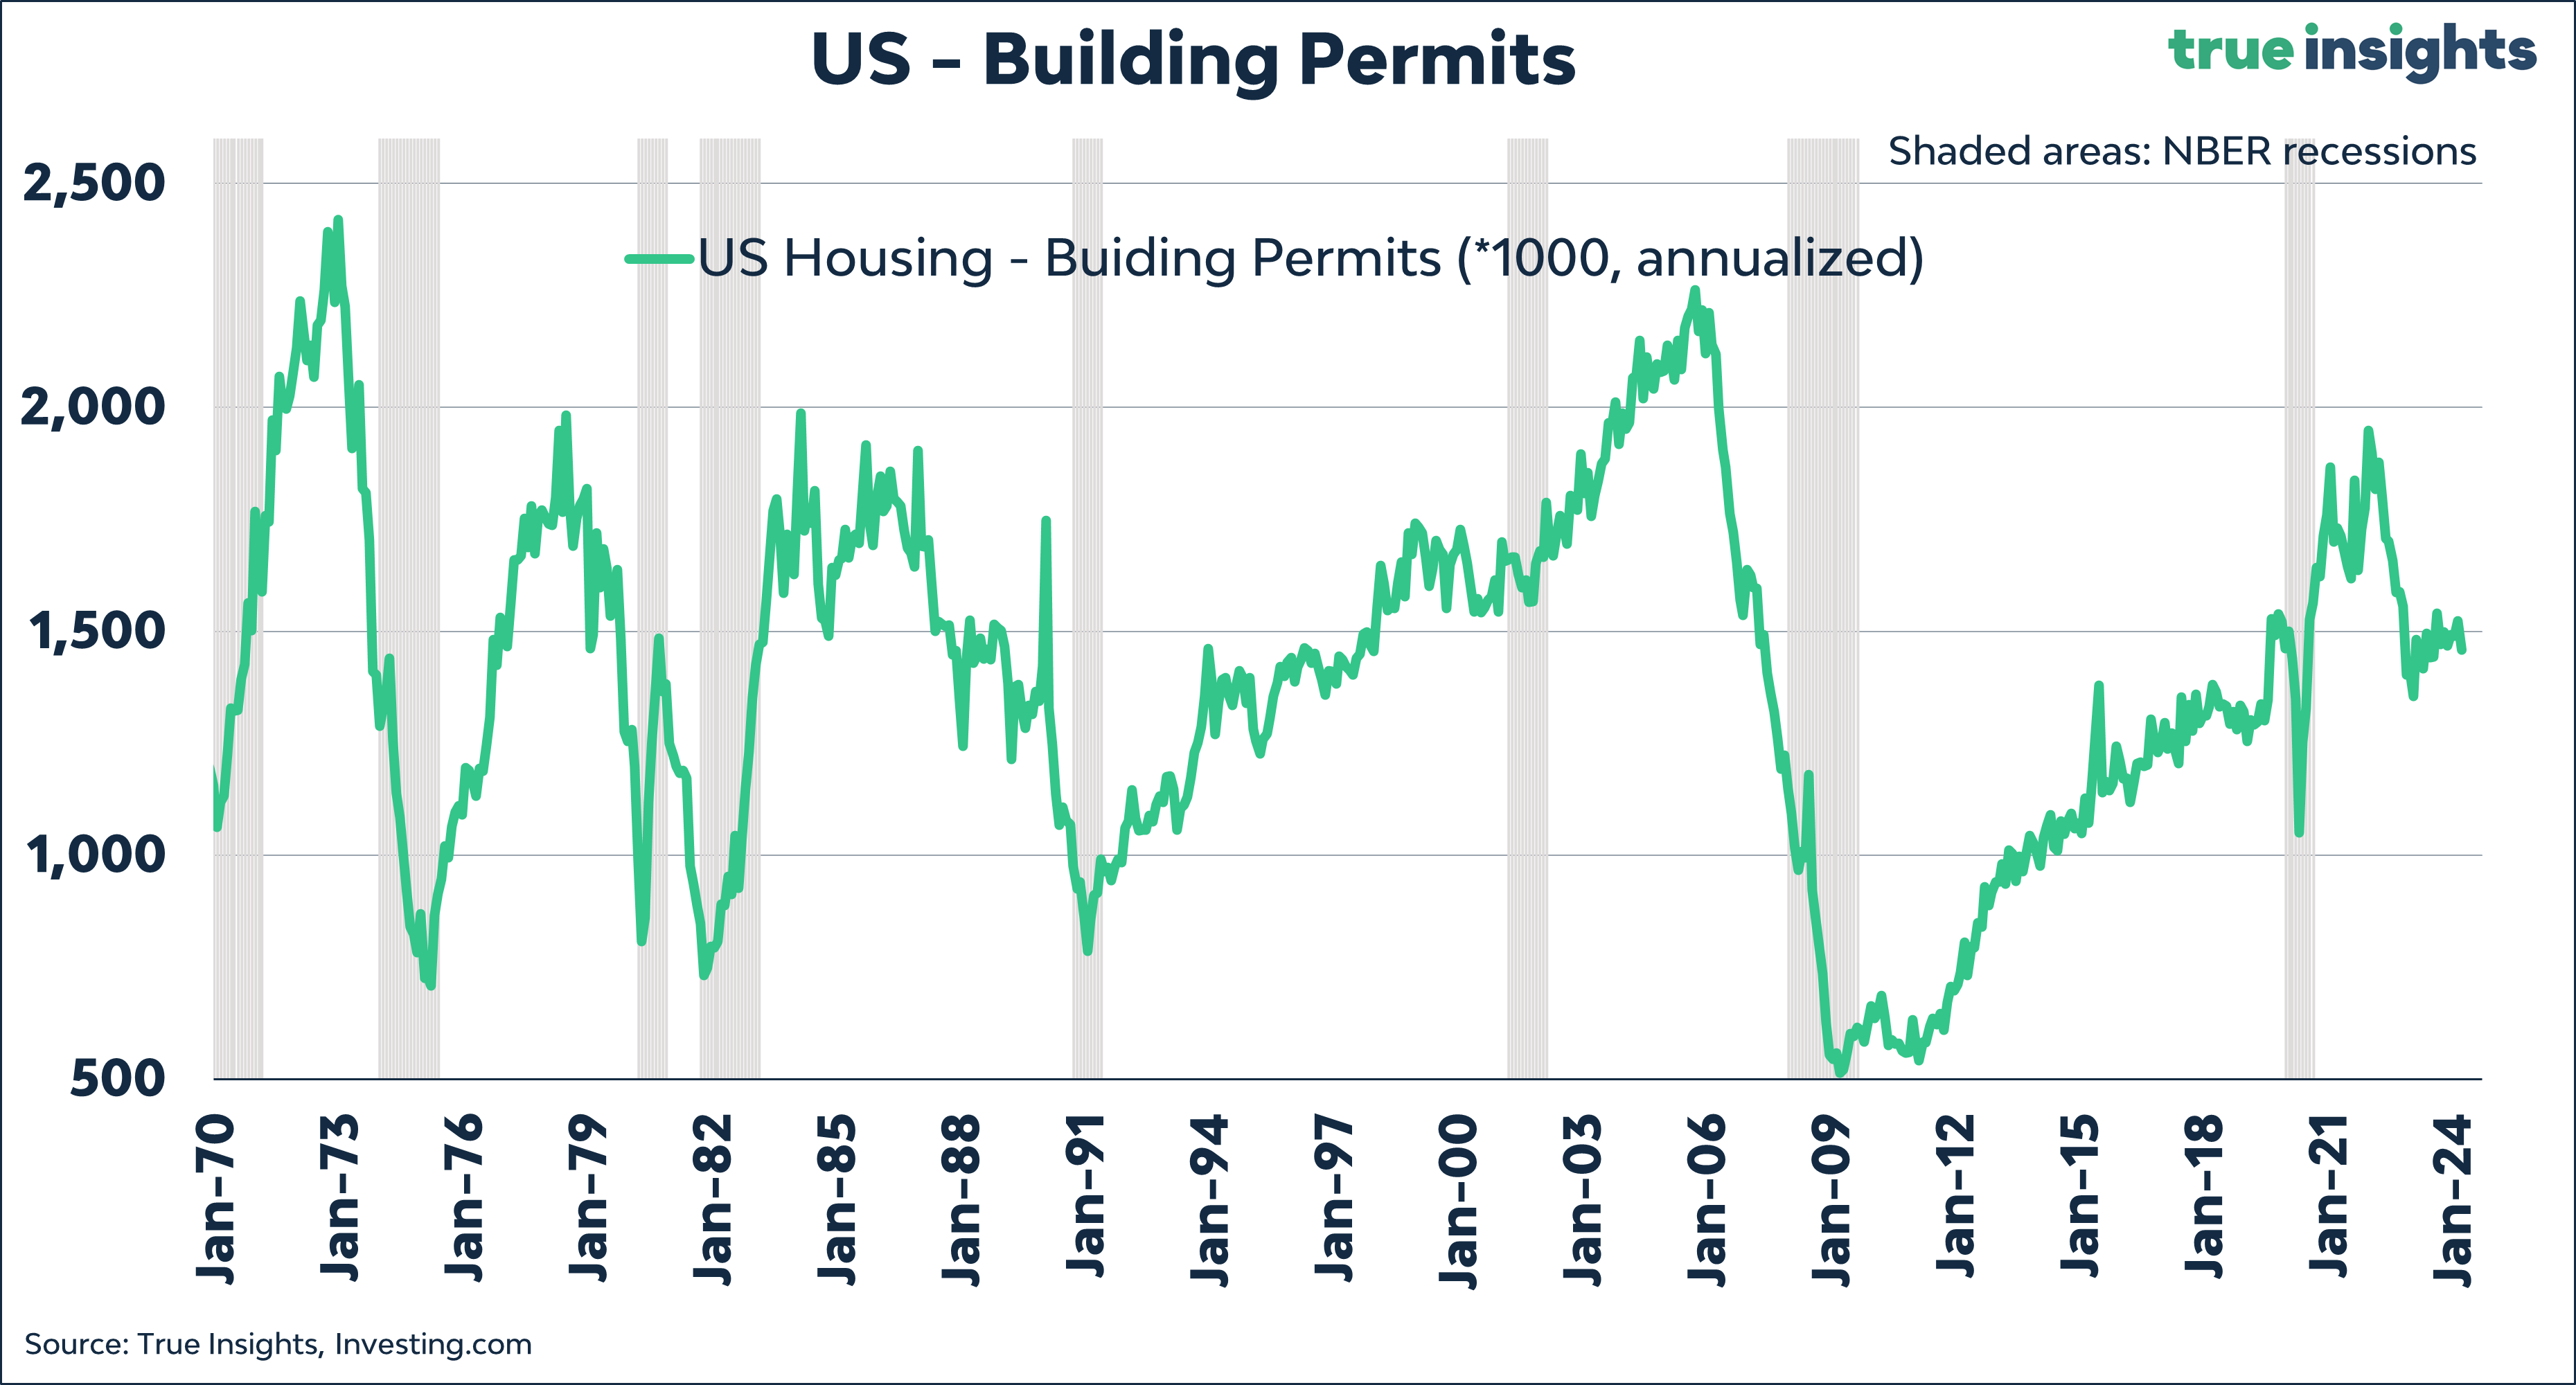
Building less
US building permits, one of my key recession indicators, fell significantly in March, suggesting the upward trend is at least temporarily broken. Housing starts fell even faster, which means the chance of a recession is not zero.
Empire State of mind
New York State manufacturers remained subdued for another month, suggesting a reversal of the ISM Manufacturing Index. As highlighted in previous posts, the ISM Manufacturing is one of the main risks for the US economy and the equity bull market.

China magic!
Wow! China’s economy performed much better than expected in the first quarter of this year. Instead of cooling down, GDP growth slightly increased to 5.3%.
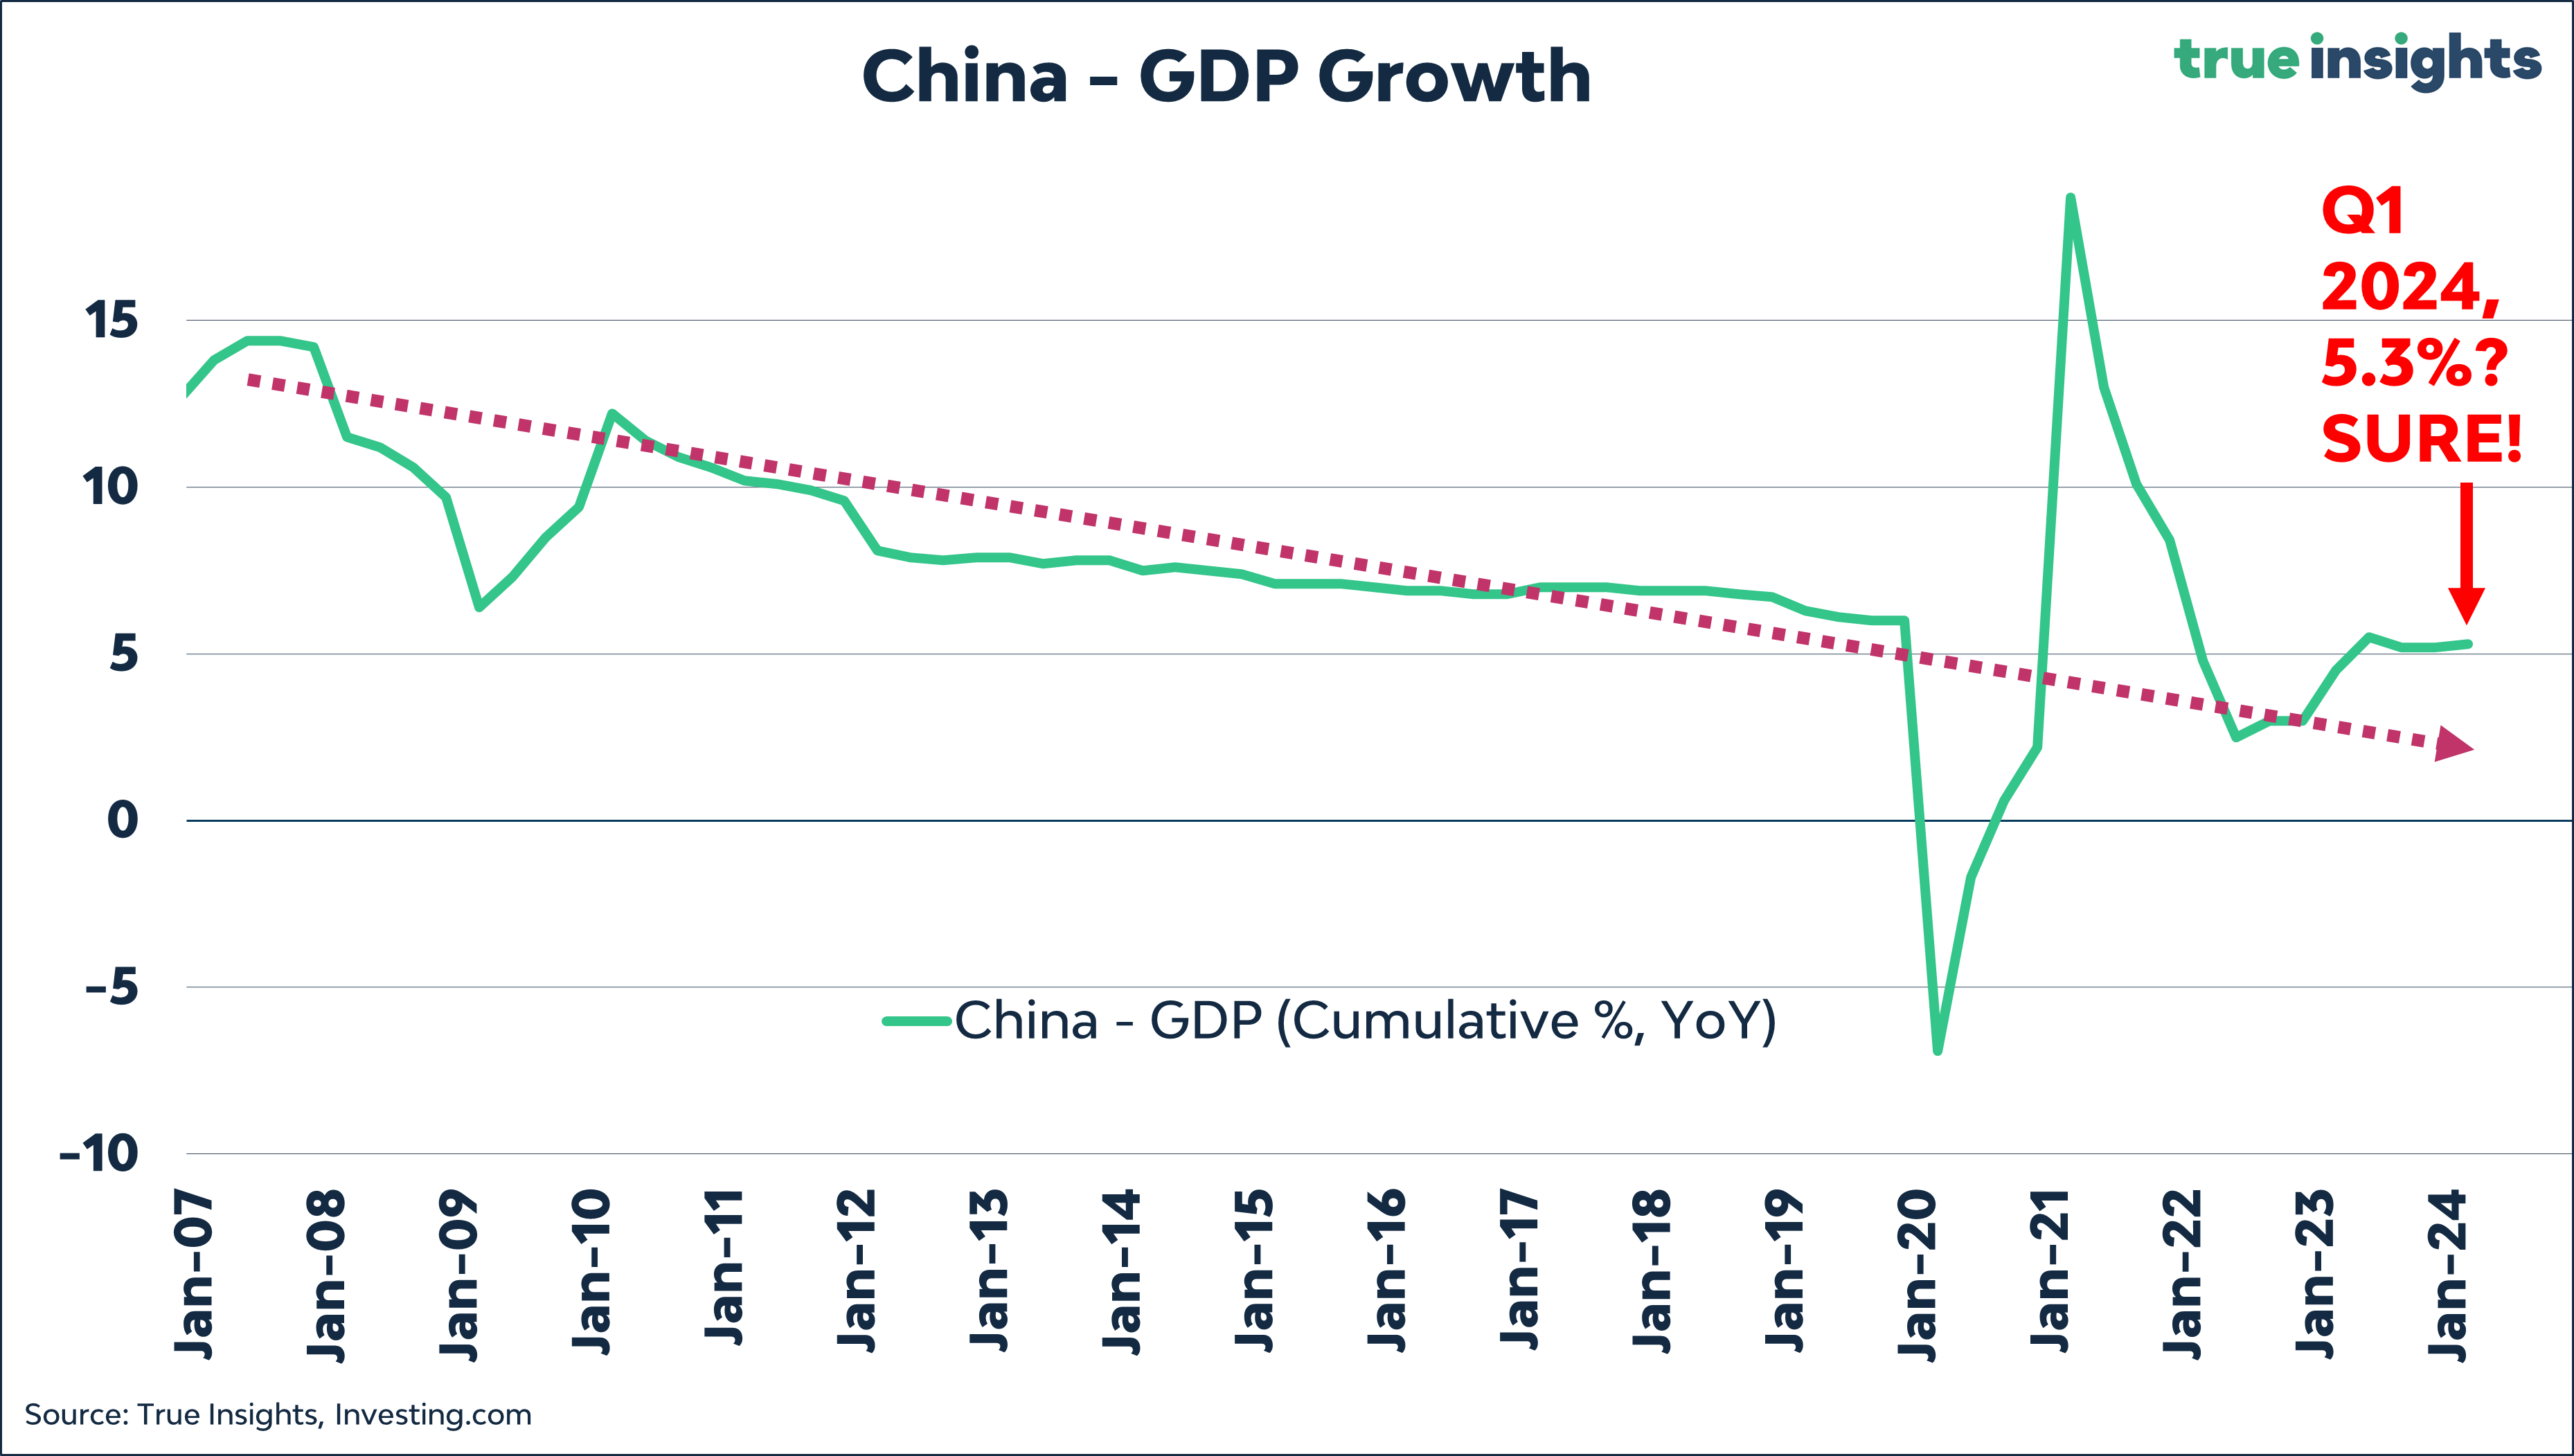
Now, I’m not a fan of continuous conspiracy thinking and not of labeling every macro figure published as ‘rigged,’ but the latest GDP data does appear somewhat strange.
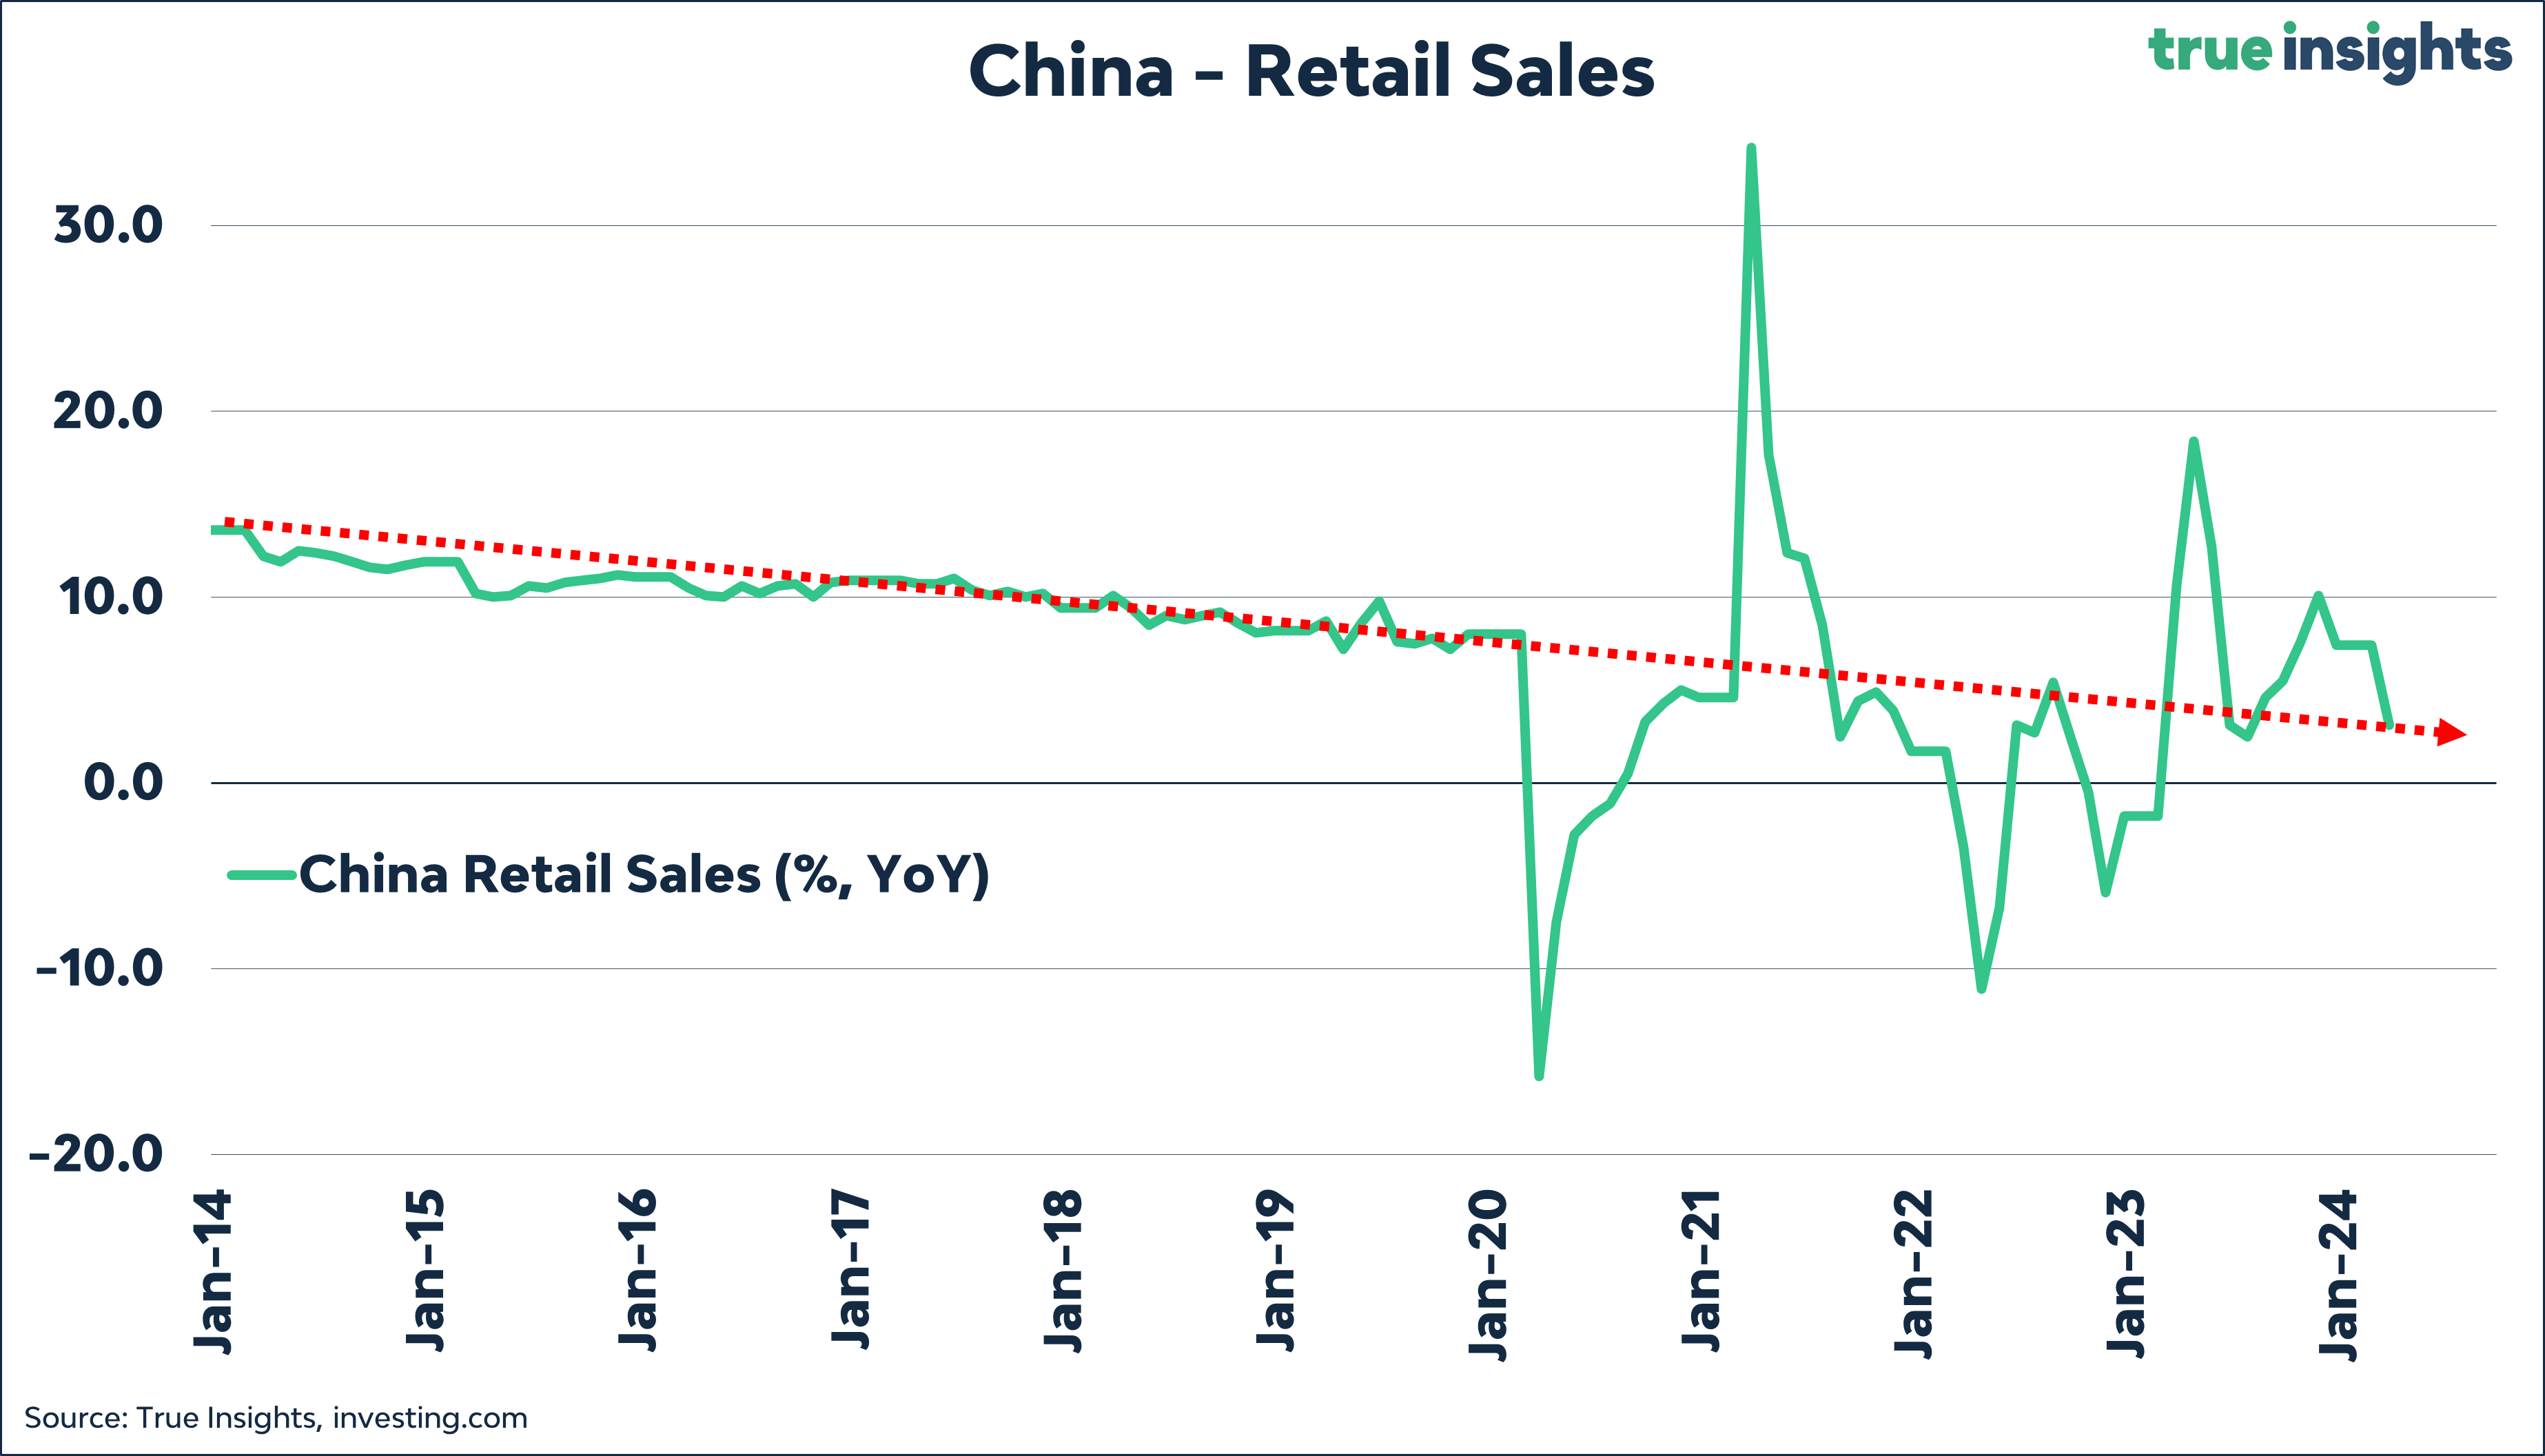
In March, retail sales grew by only 3.1% compared to last year, where growth of 4.8% was expected.
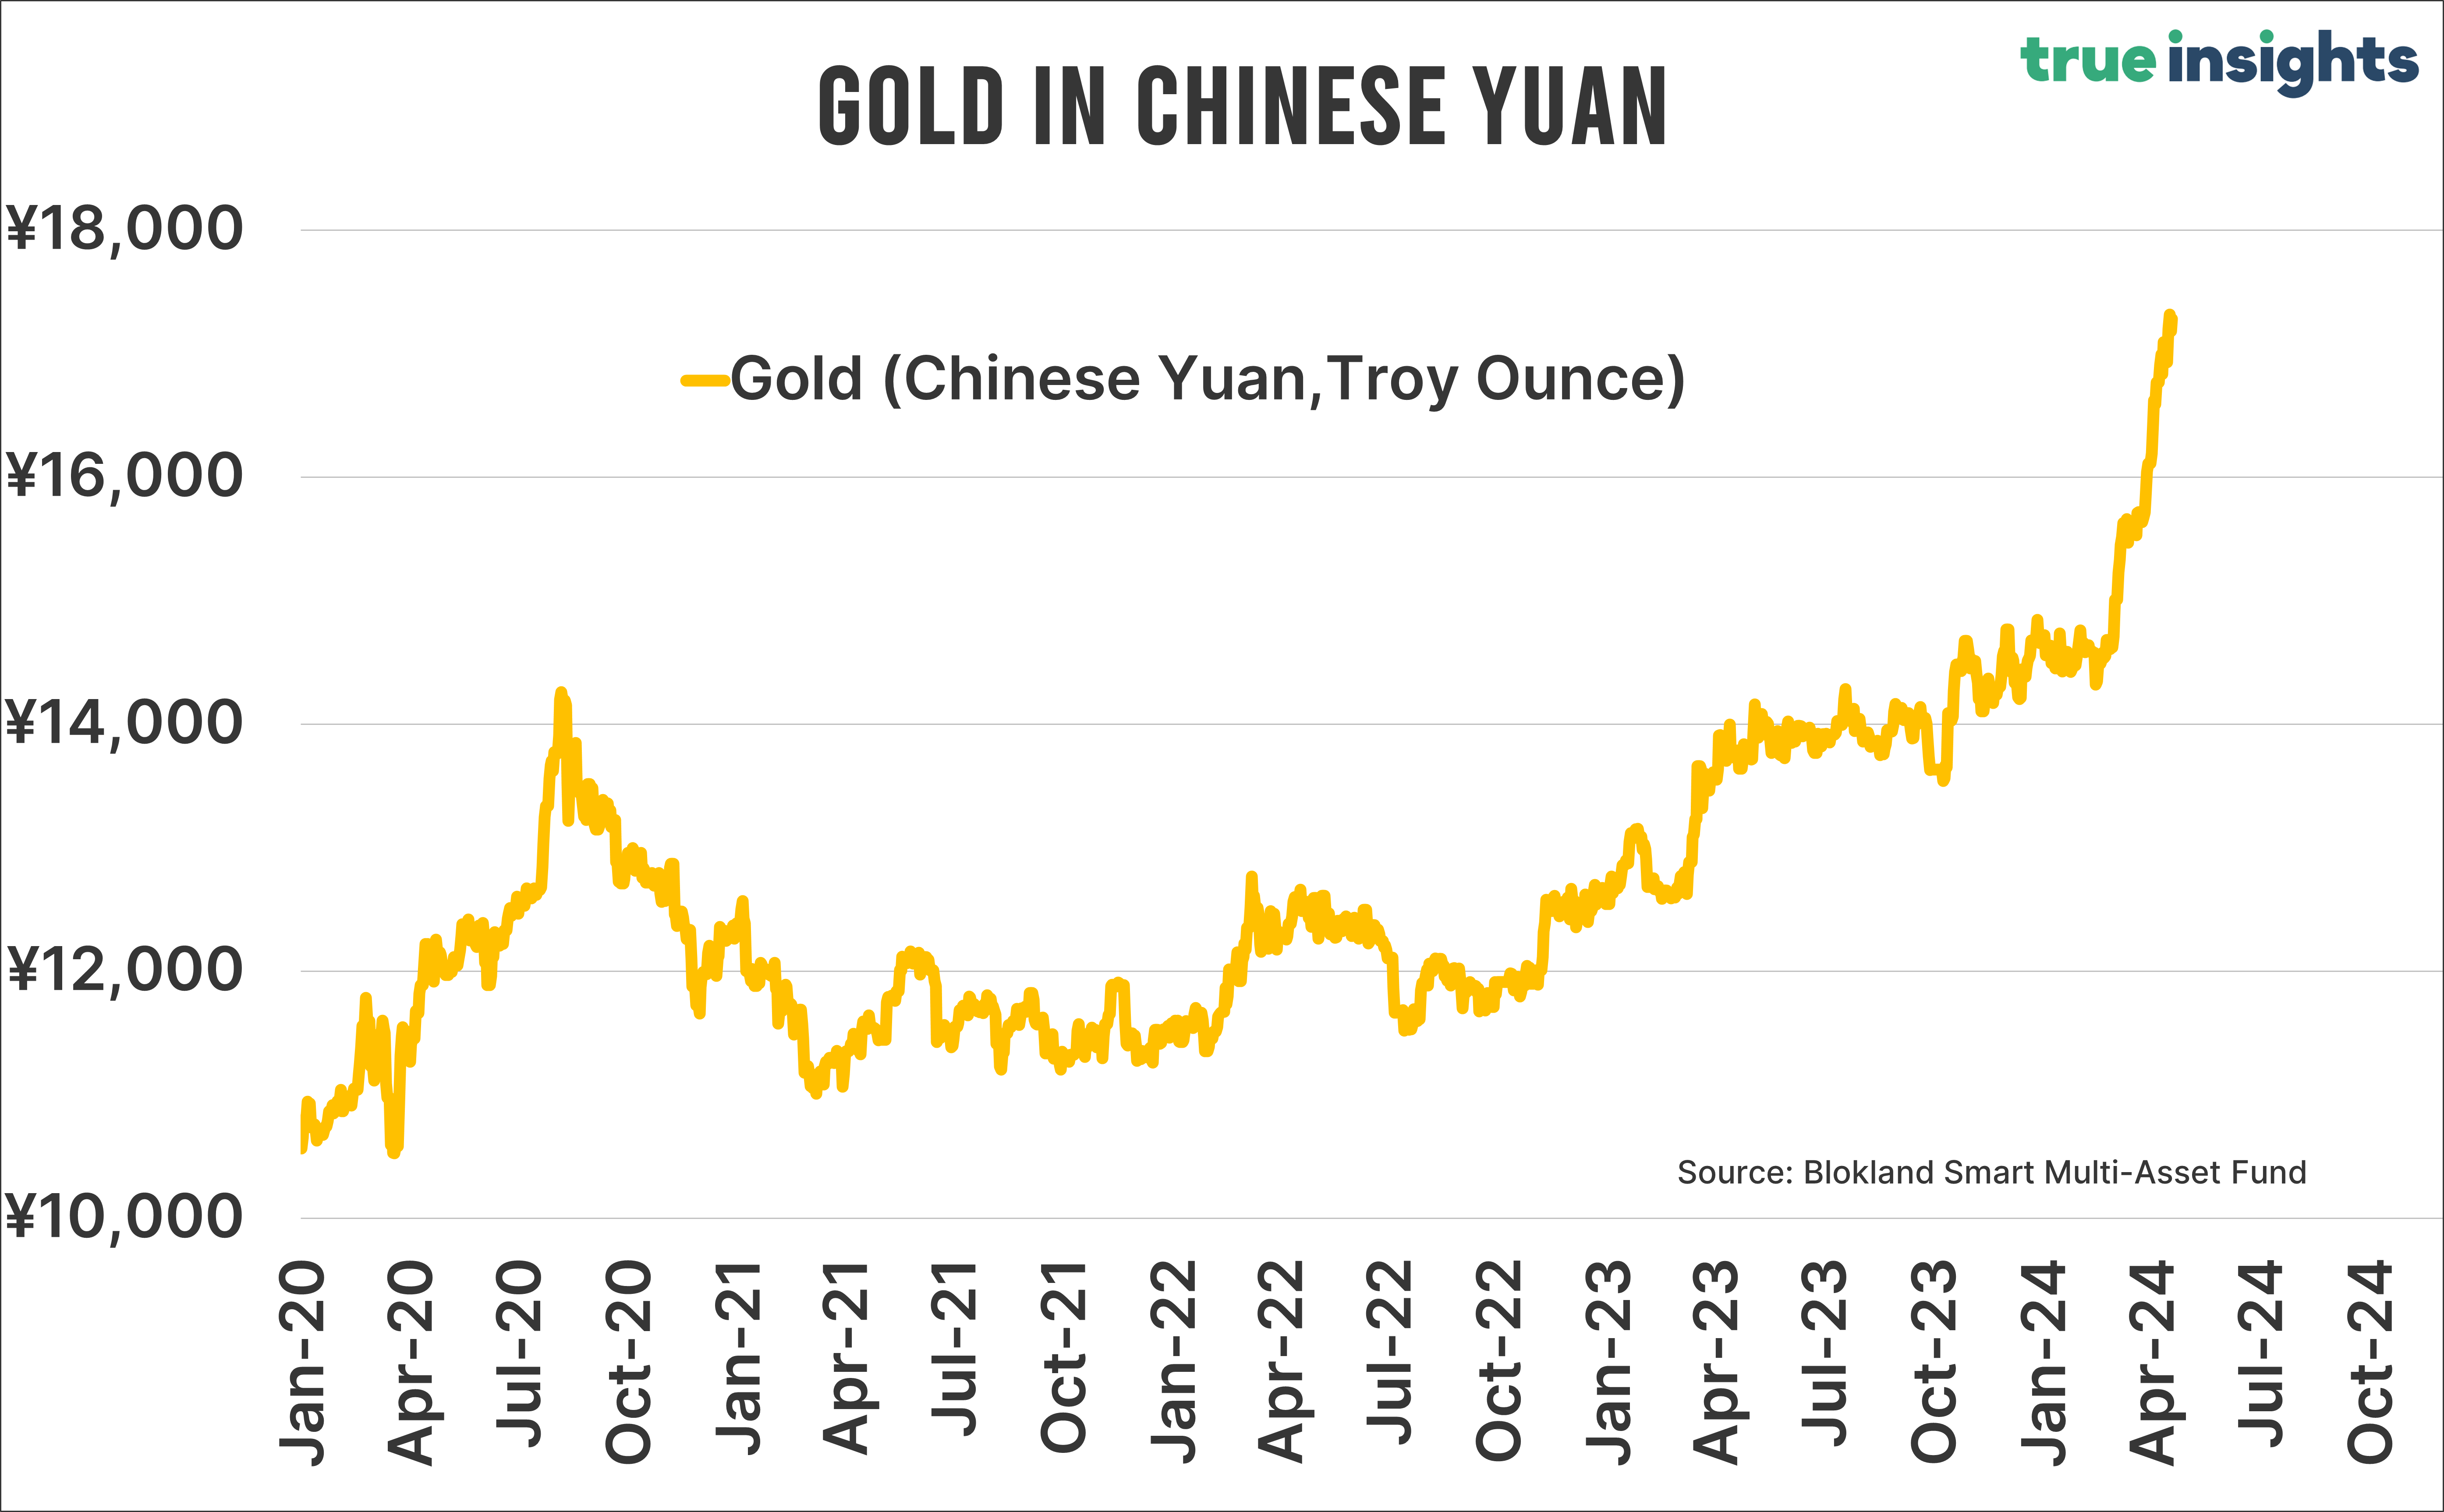
The malaise in the Chinese housing market continues unabated. In March, house prices fell sharply. Only three of the last 32 months have house prices increased. According to official statistics, Chinese house prices have fallen more than 10% since July 2021.

During that period, the price of gold in Chinese Yuan increased by 46%. It is no surprise that Chinese people are turning to gold these days.
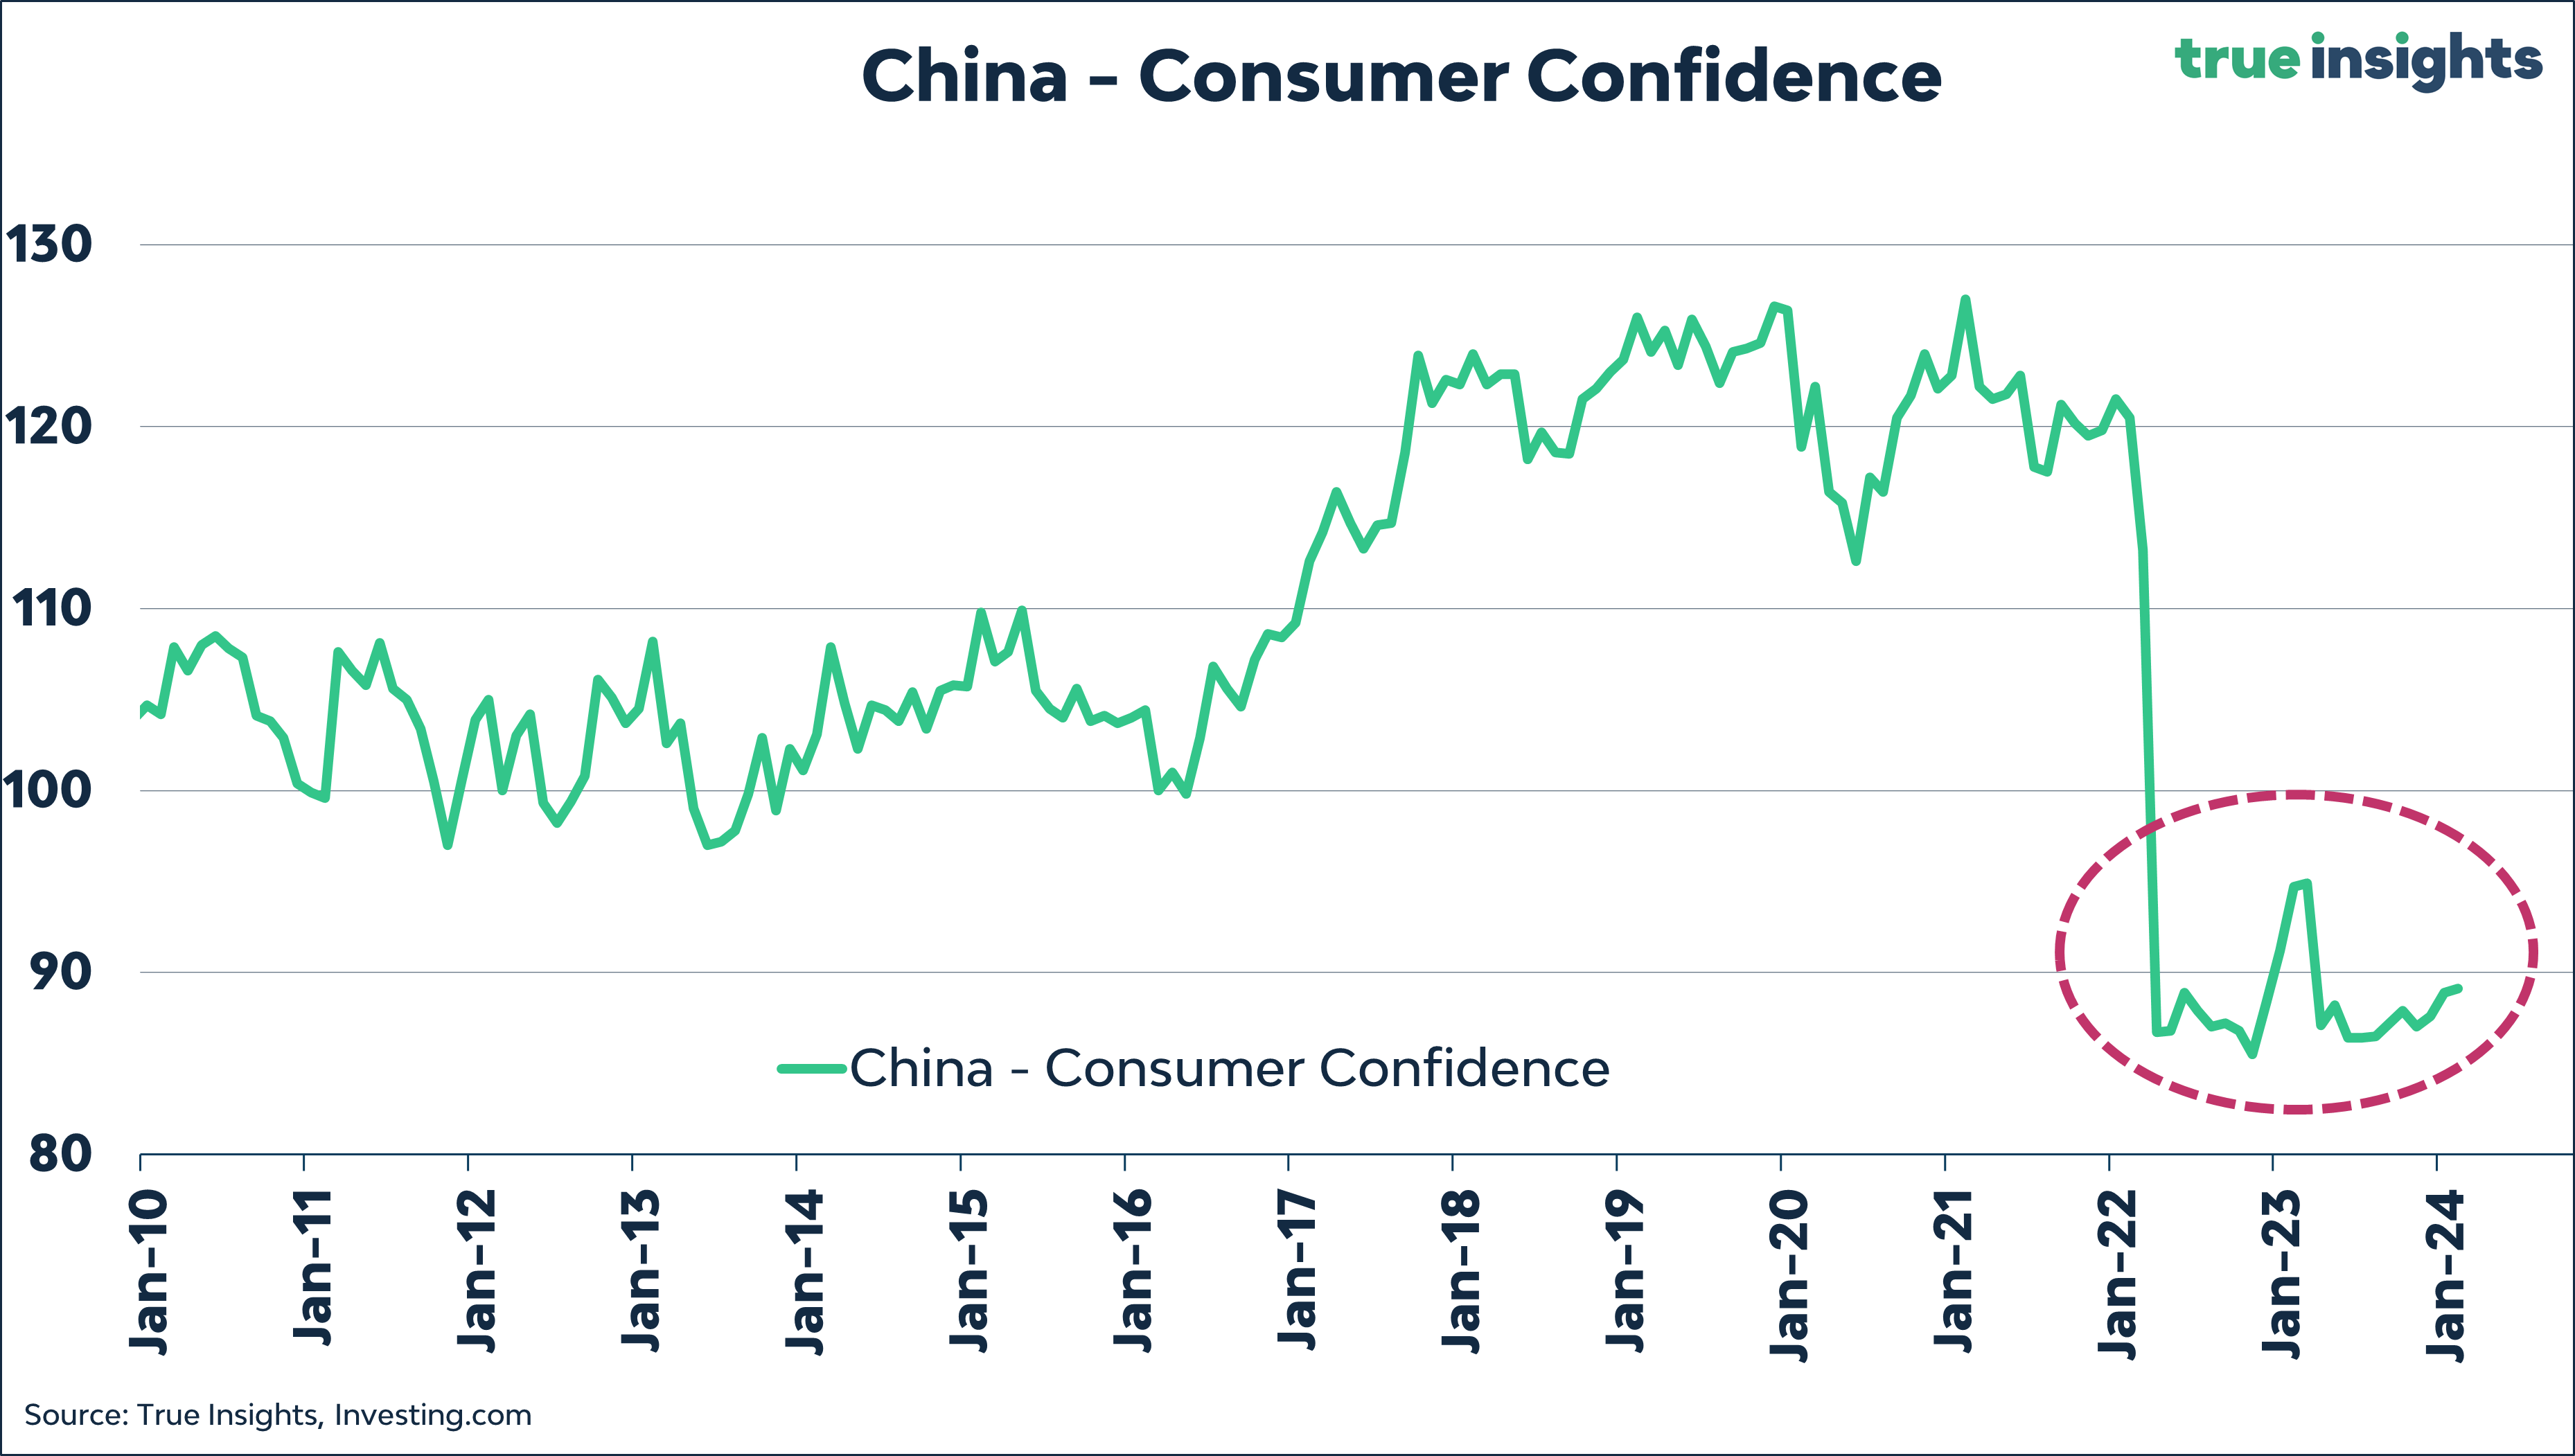
Moreover, the sentiment among Chinese consumers remains very poor.
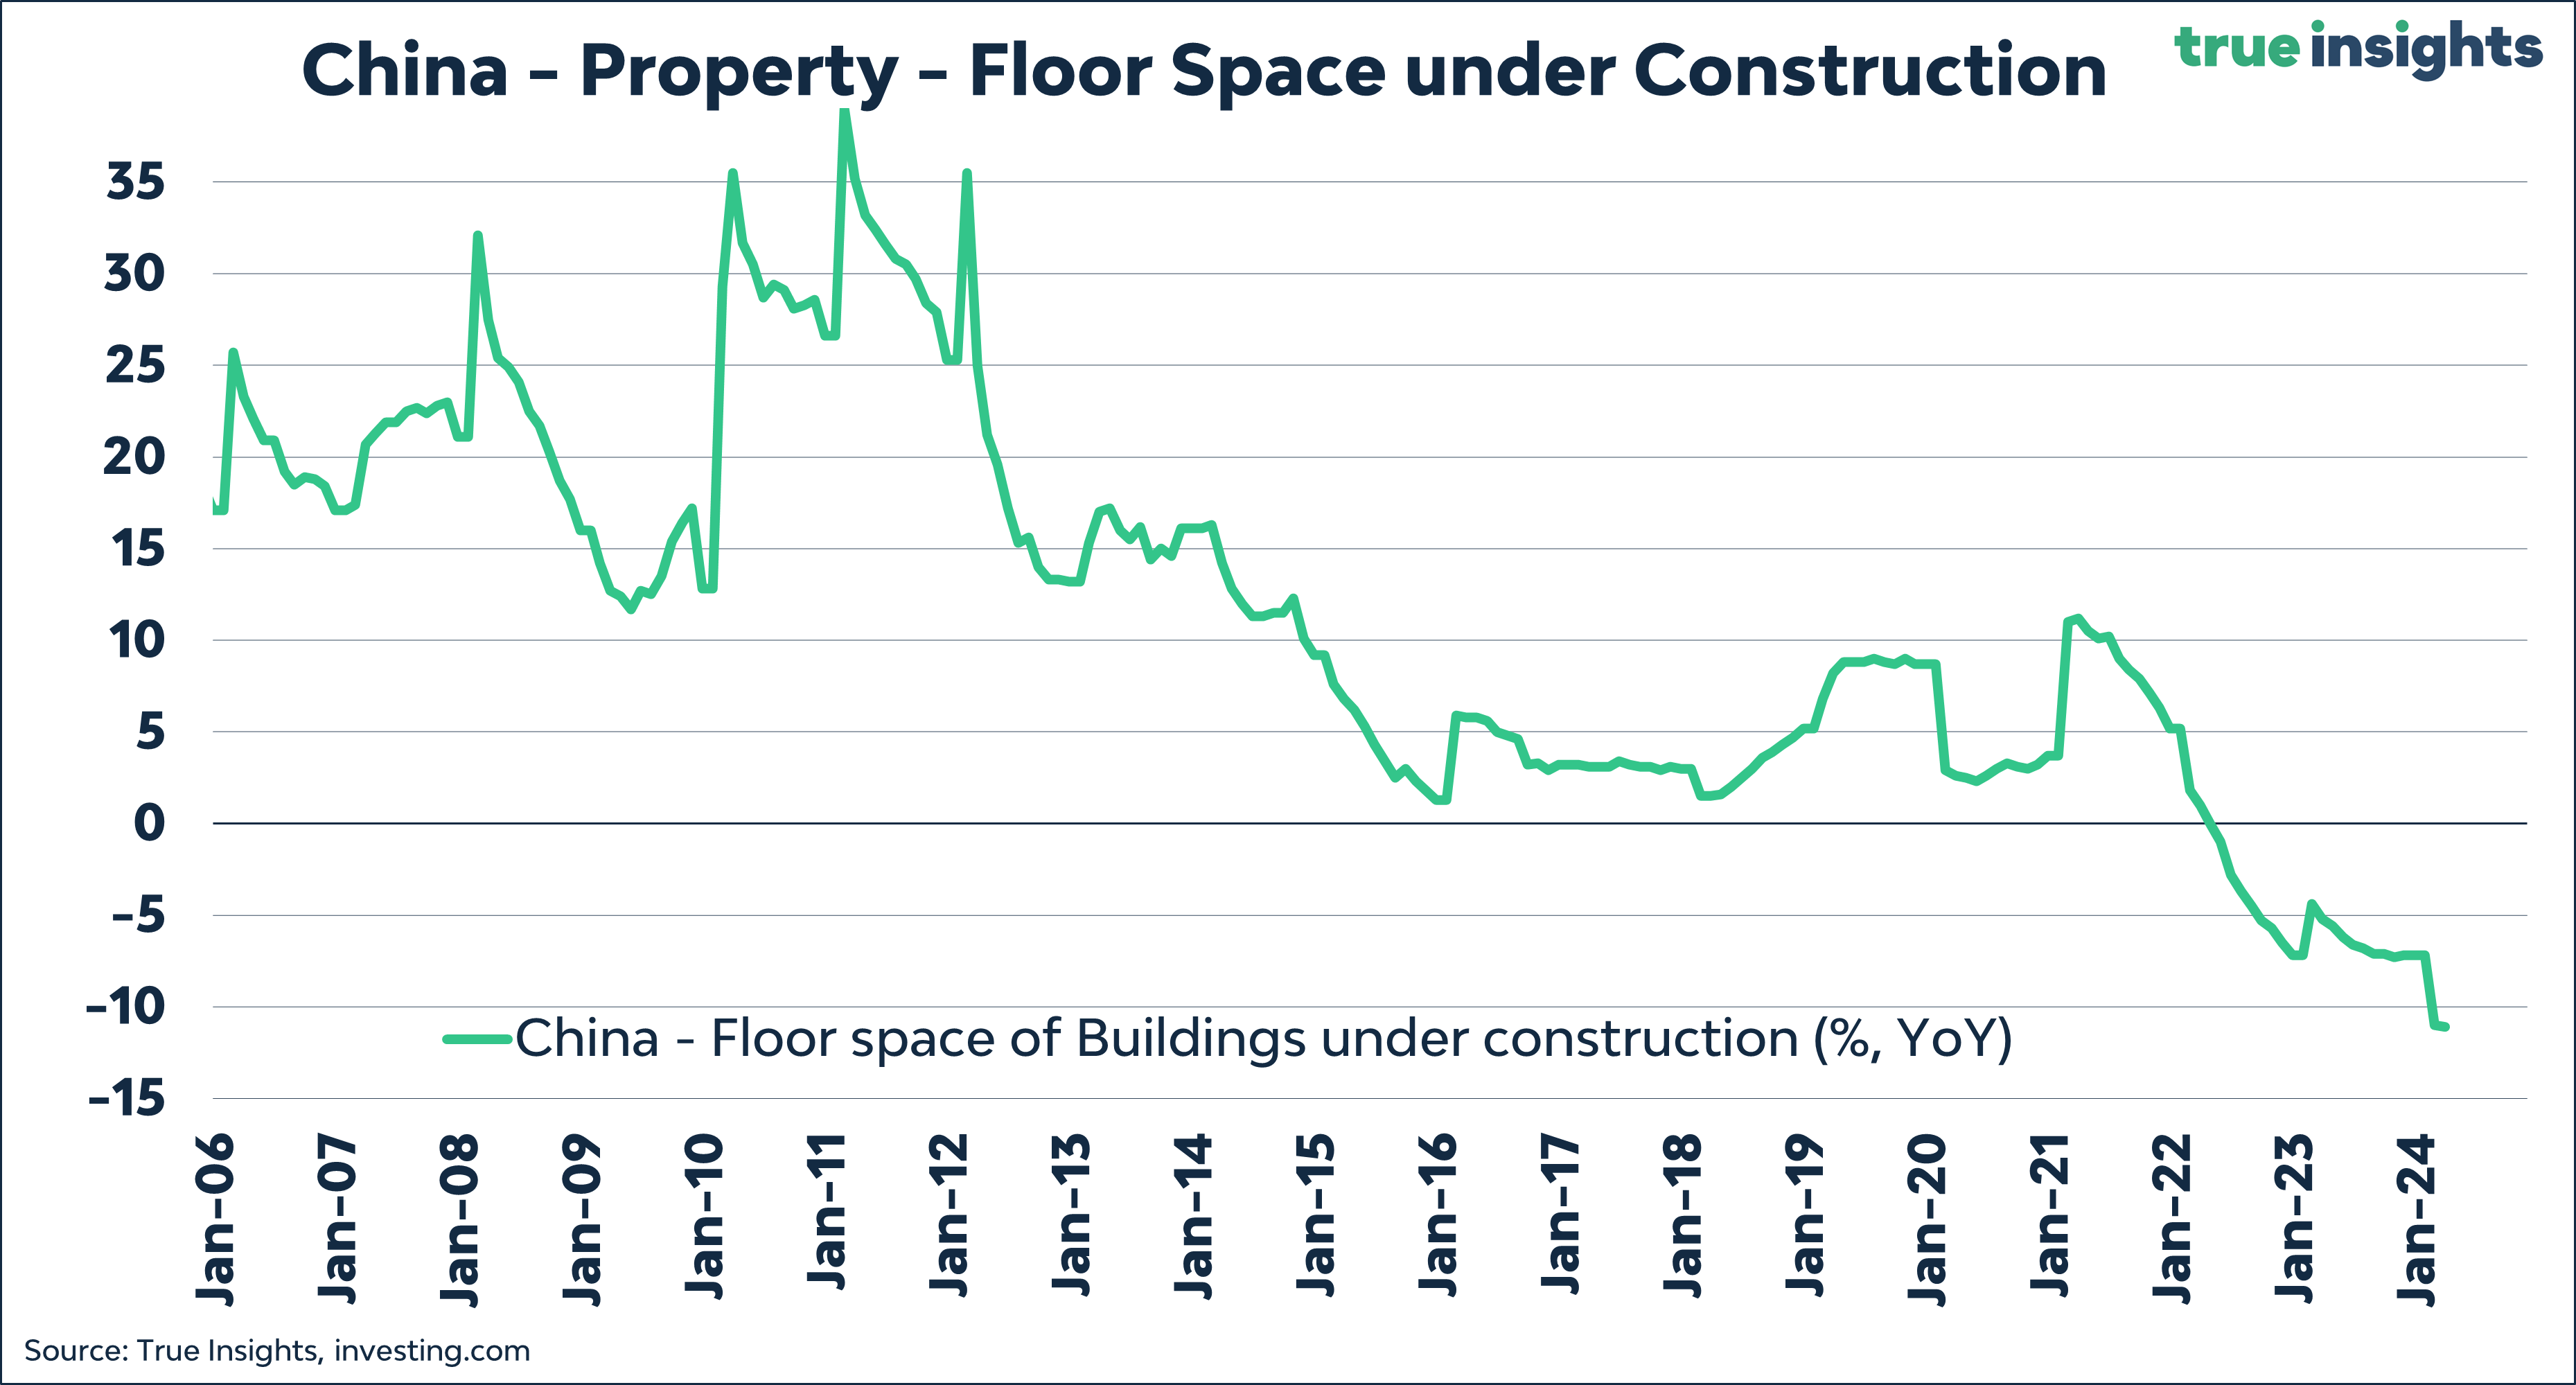
Alongside disappointing retail sales, March industrial production also fell short of expectations (4.5% vs. 6.0% expected). And the real estate sector also showed little signs of life last month. Property investment declined 9.5% compared to the previous year.

Floor space under construction fell even more, a desperate sign for Local Government Financing Vehicles that must derive a large portion of their revenue from land sales for construction.
Unlike ‘before,’ China can no longer stimulate its way out of trouble by issuing large amounts of debt. Last week’s downgrade from Fitch was a vivid example of this. As a reminder, public debt has more than doubled since the Great Financial Crisis and is heading to above 100% of GDP. More importantly, total debt has ballooned from 133% in 2008 to 272%(!) in 2022. It will have risen again in 2023.
Geopolitical implications
The IMF added more debt struggles in its Fiscal Monitor. Below is the estimate of public debt-to-GDP up to 2053. According to the IMF, China will then be at 250%.

Please explain to me again how this is a blessing for Chinese households, corporates, pension funds, banks, and so on, which must hold this asset on their balance sheets against an expected very low interest rate. While the US can still boast about representing the deepest and most liquid bond market linked to what is now the world’s reserve currency, China has little to offer on that front.
The IMF concludes the following:
How these two economies manage their fiscal policies could therefore have profound effects on the global economy and pose significant risks for baseline fiscal projections in other economies. As examples of these effects, the IMF cites spillover effects from higher interest rates, a stronger dollar leading to higher commodity prices (inflation), and higher USD debts in emerging countries. As for China, the impact is reflected in global trade (deglobalization) and external financing.
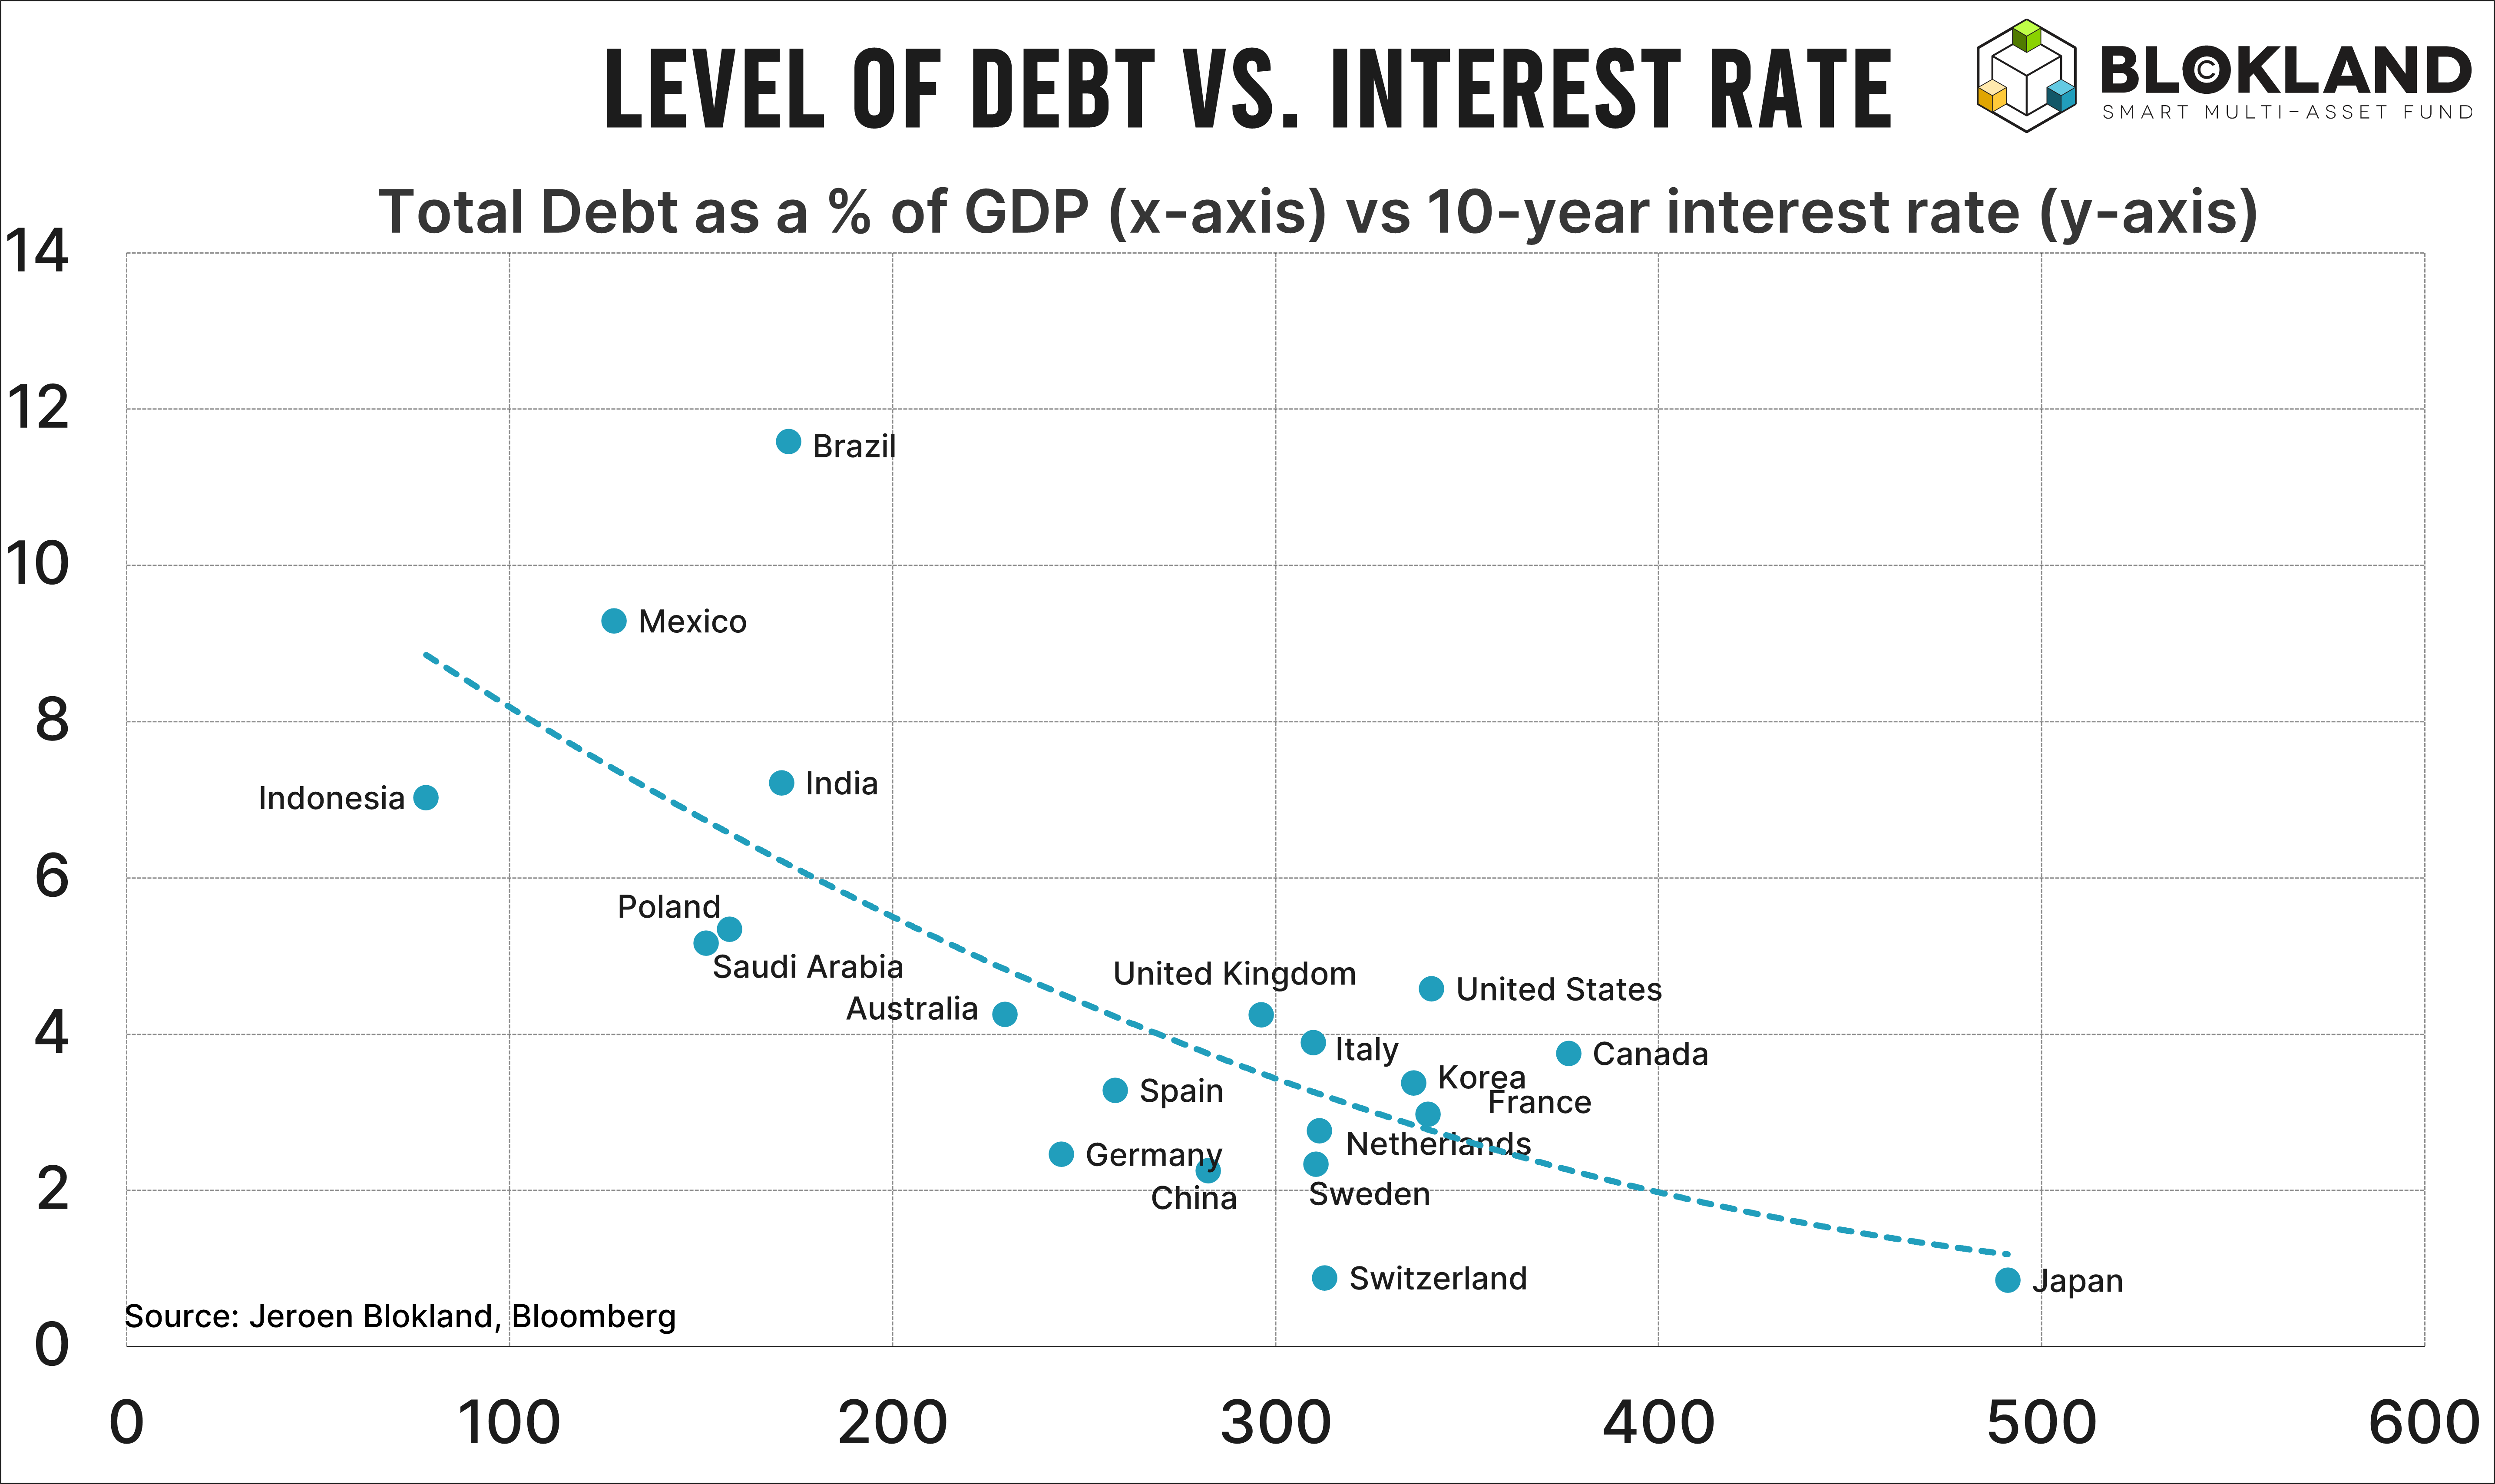
What the IMF forgets, however, is that the relationship between debt and interest has become and will remain negative. After all, with low yields, many of the above problems will be avoided.
What’s up with Bitcoin
Bitcoin is being tossed back and forth by a cacophony of conflicting emotions.
Today, we have the halving. Is this a sell-the-fact event or the start of a new rally?

With a sample of three, we know little. After the previous three halvings, it took a while for Bitcoin to get going. A significant difference is that Bitcoin had not reached an all-time high before the previous halvings.
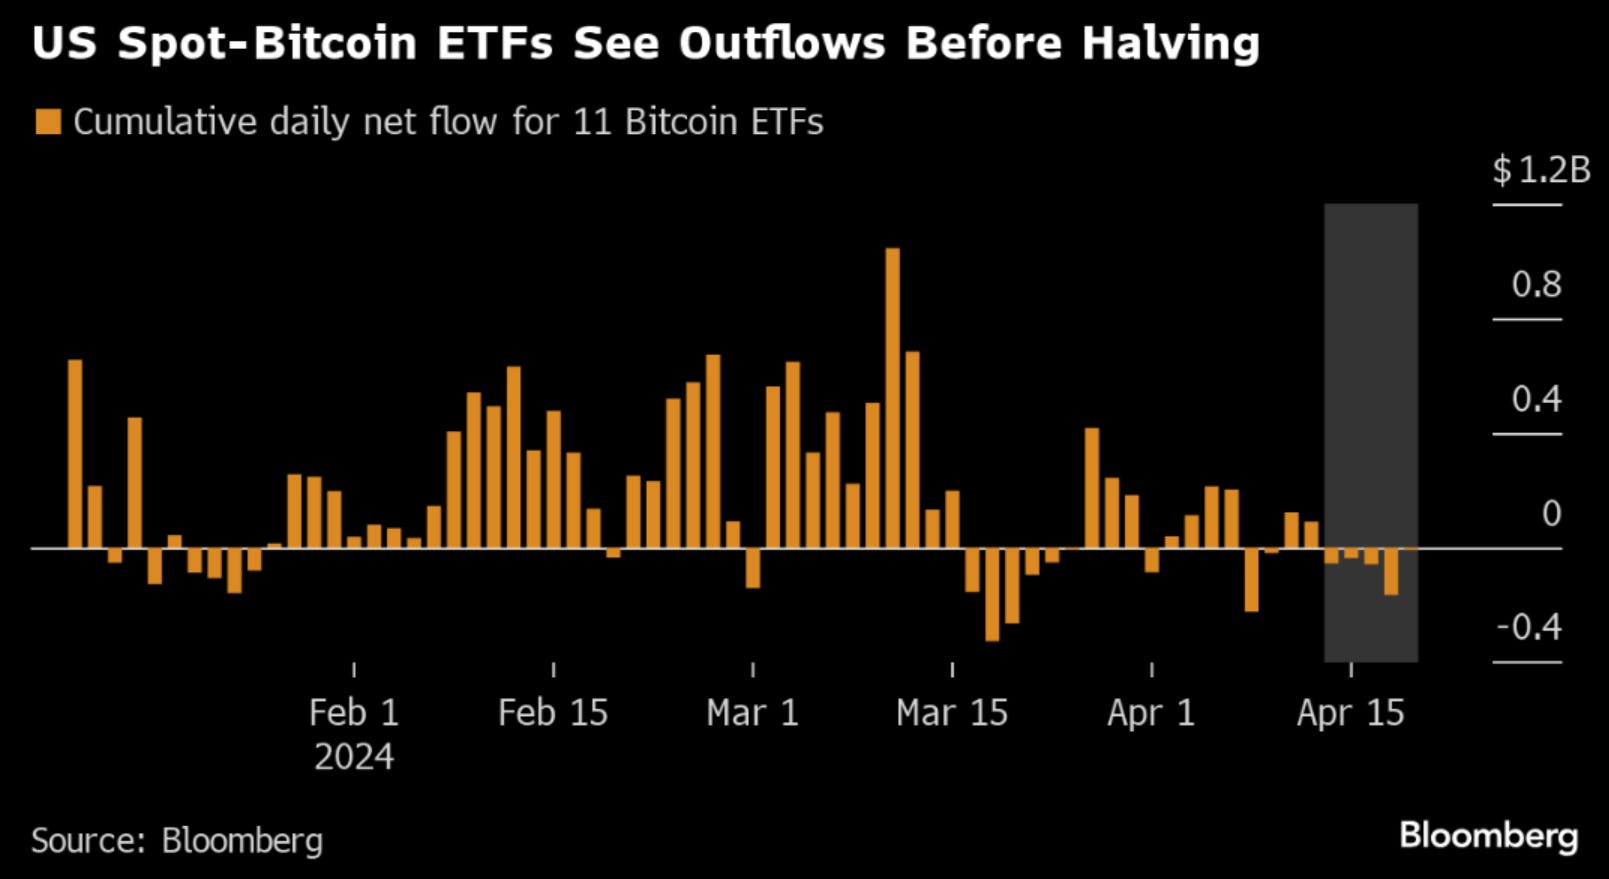
US spot Bitcoin ETFs are experiencing outflows.

Geopolitical tensions show that Bitcoin is still a risky asset, although the recovery is remarkable after news hit that the degree of Israel retaliation seems muted.
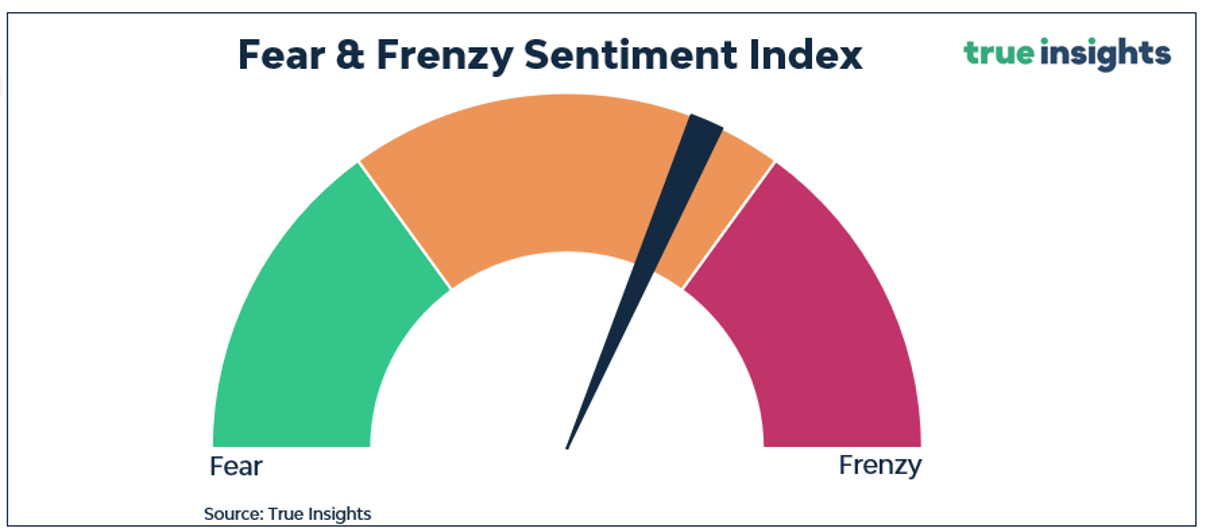
Sentiment
Fear & Frenzy
The Fear & Frenzy has (finally) moved out of Frenzy. Hence, no immediate sell-off risk from a sentiment perspective.
The gap between implied volatility (VIX Index) and realized volatility has increased to above 8 points. Historically, the S&P 500 Index realized above-average returns in the month after that.

Momentum
Below is a chart of the Ishares 20+ Year Treasury Bond ETF (TLT). It is down 48% since April 2020 (not including inflation.) This means investors have realized a negative return of 15% annually on long-duration bonds over the last four years. Moreover, this ‘return’ was realized with structurally higher volatility and, on average, a positive correlation with stocks.
It also means the long-duration bond market must double(!) to erase losses.

Yes, nominal returns will be great when yields turn, but this damage will take years, or a crisis, to be recouped, and even then, the question arises as to the quality of that return.

Valuation
The Federal Reserve and tensions in the Middle East completely overshadow the earnings season. With about 13% of the companies in the S&P 500 Index having reported, the profits and earnings outlooks are generally quite decent. This should provide a floor under the market.
ENJOY YOUR WEEKEND!
JEROEN
MARKETS

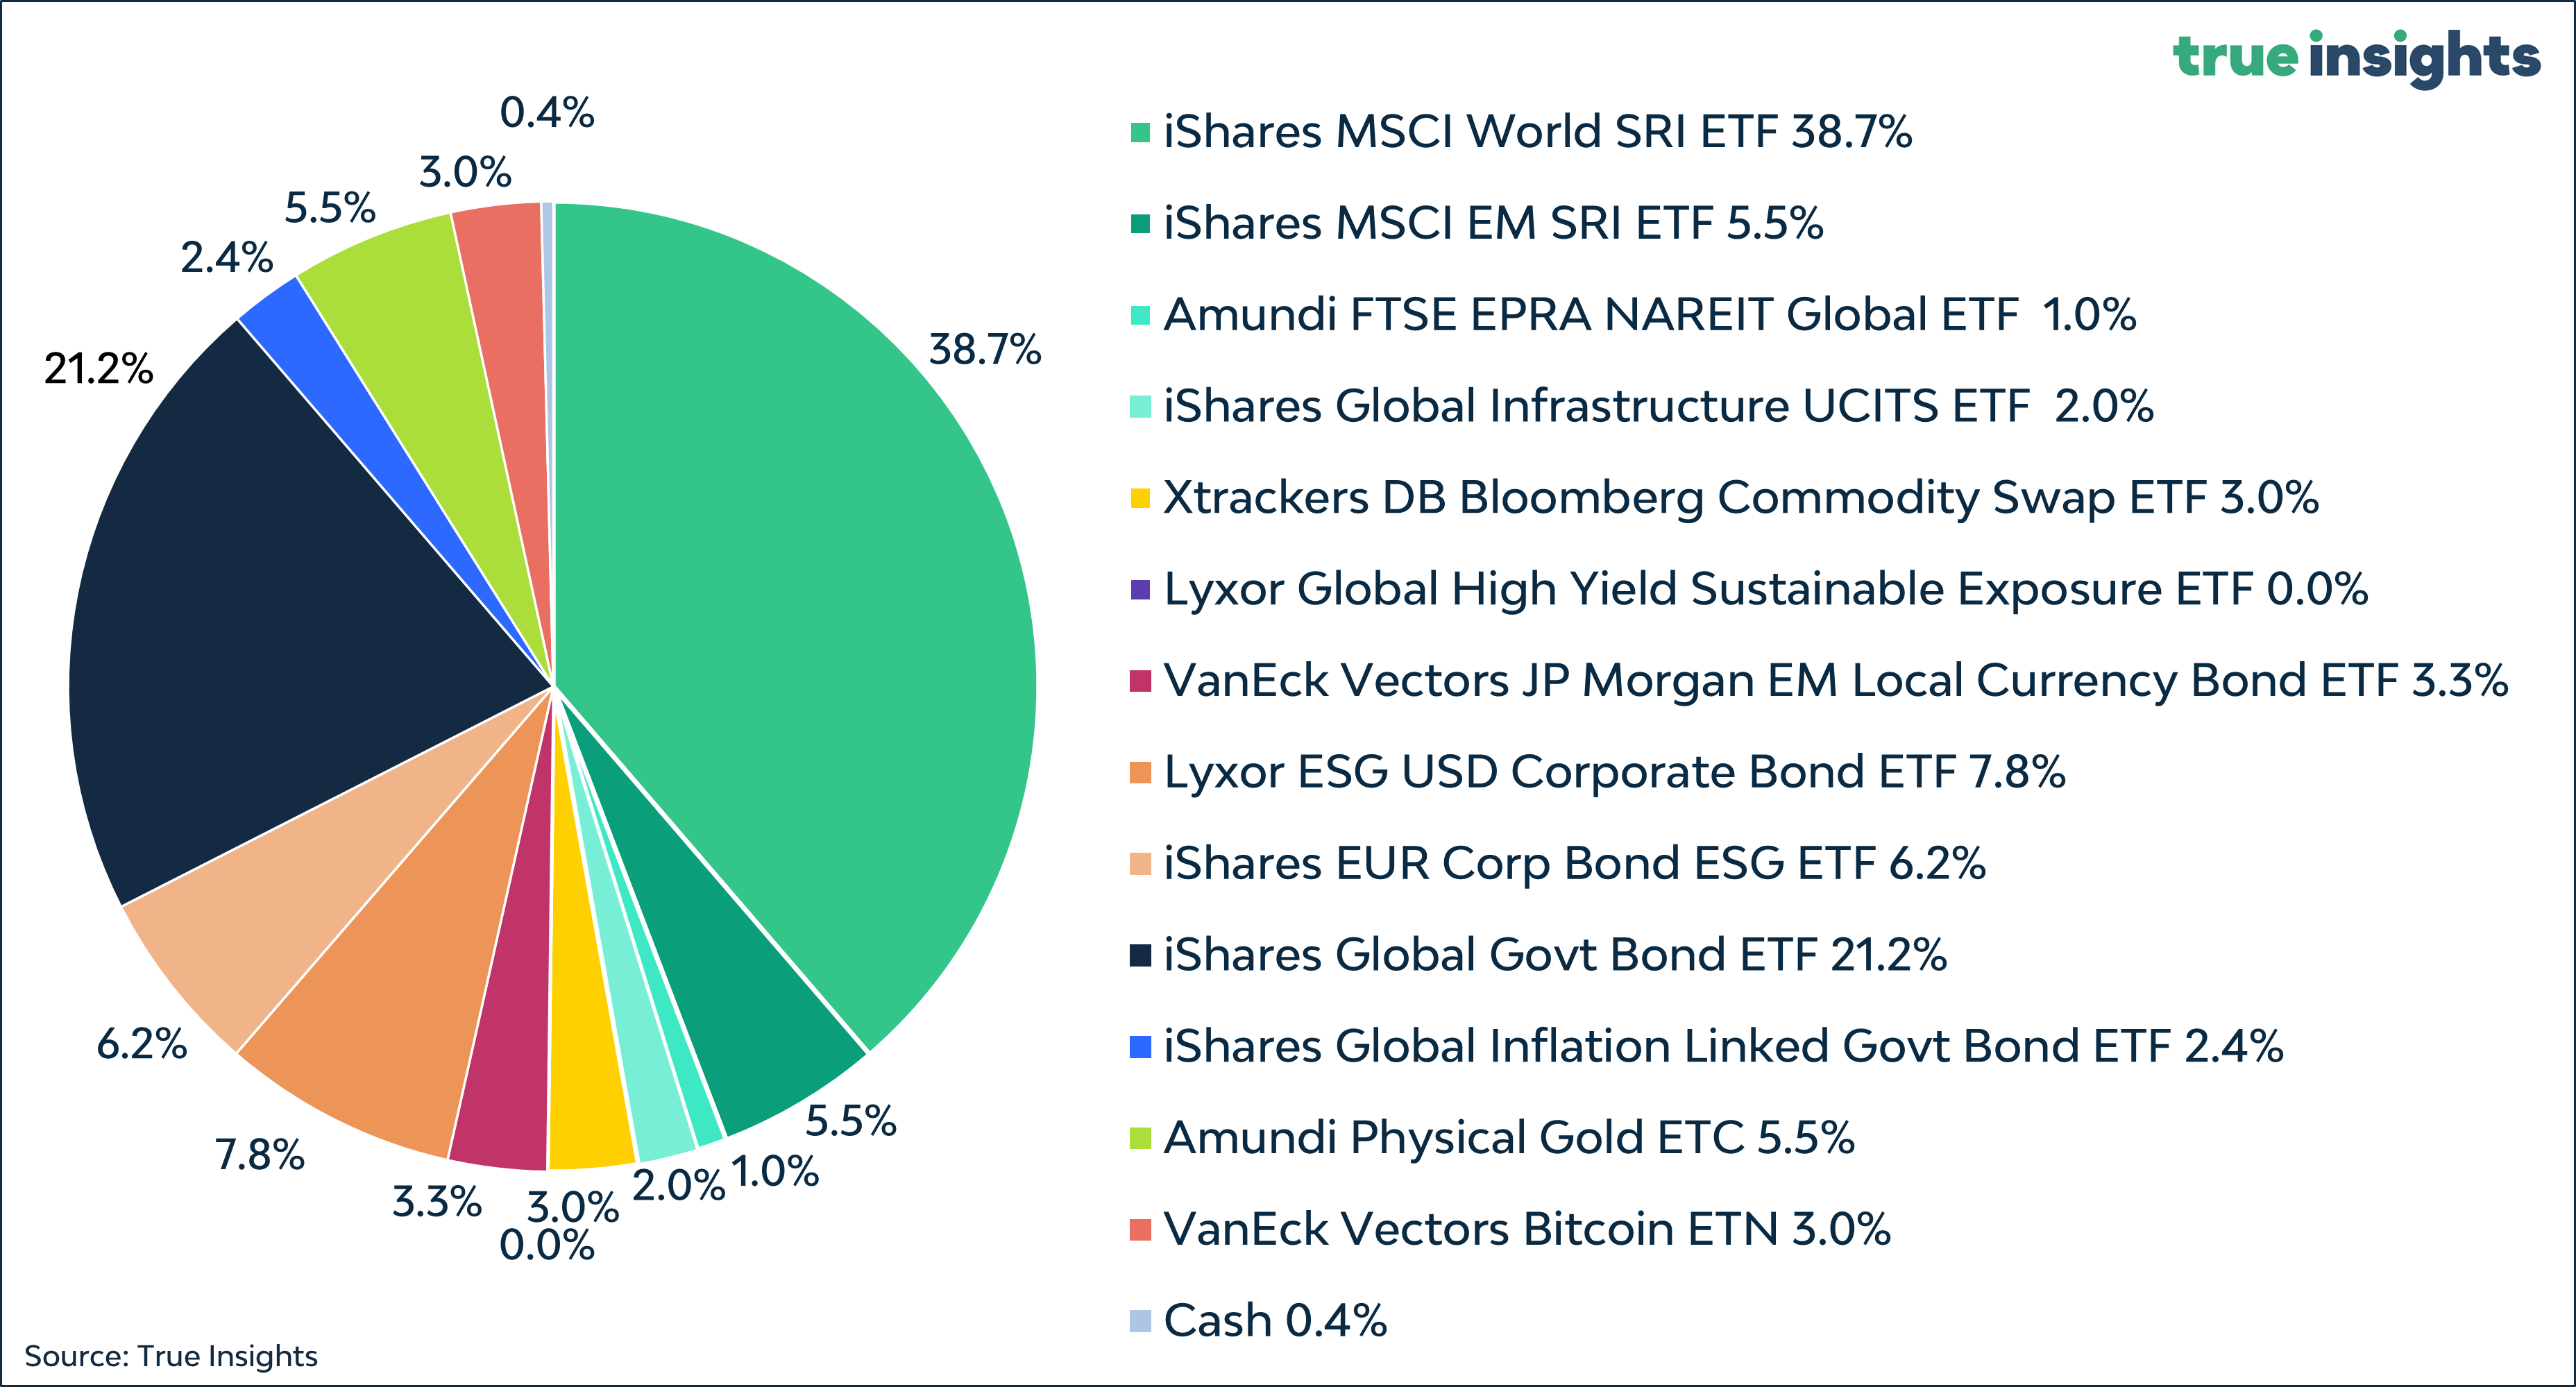
Active Weights
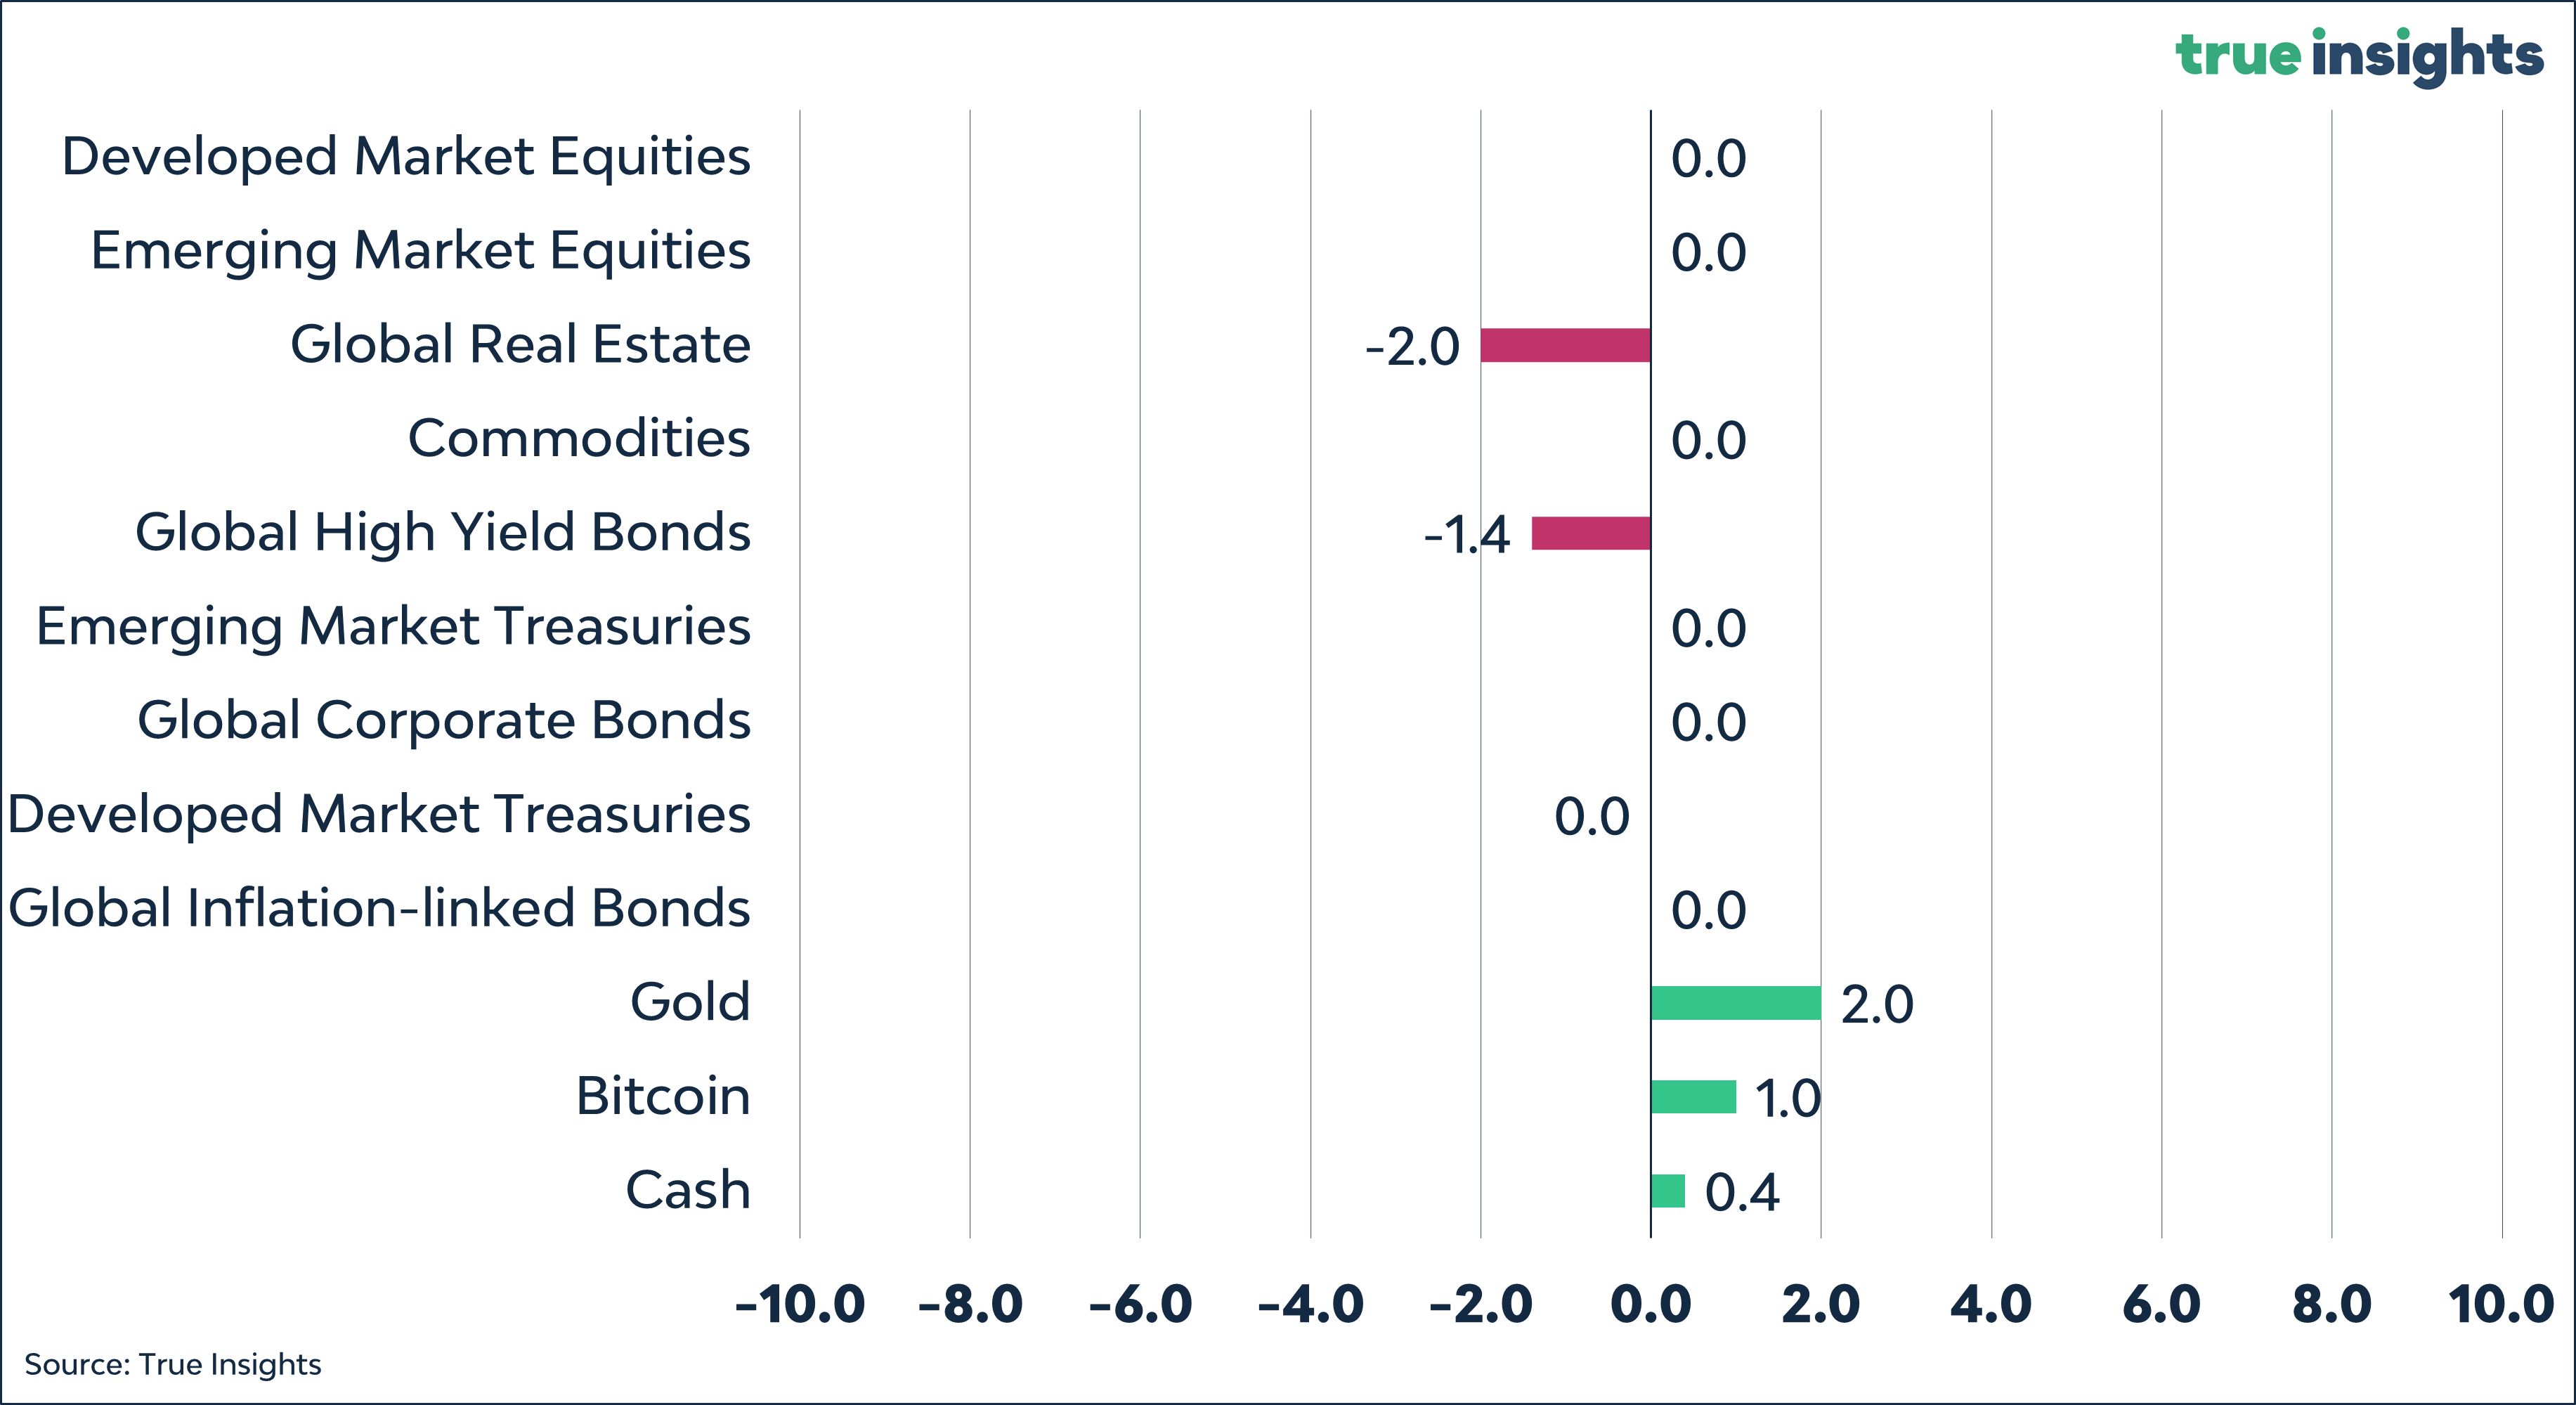
Balanced Portfolio