


Understanding Oil Price Shocks: What to Expect from Asset Class Returns?
Oil price shocks push inflation higher and favor Gold as an asset class, but unlike what many believe, are not bad news for Equities!

Even though oil prices have fallen slightly recently, their recent surge remains remarkable. Moreover, the increase has been so substantial that we refer to it as an oil price shock. Since 1983, when the WTI Crude Oil Future contract started trading, the oil price rose by more than 15% over a one-month period on roughly 900 out of 14,700 days. This accounts for about 6%. On only 204 days (1.4% of all days since the start of the WTI contract in 1983), the rise over the past three months exceeded 25%. We’ve seen both price ‘shocks’ recently. In this Insight, we will explore what this implies for the performance of stocks, yields, gold, inflation, and oil.
Oil Shock I – An increase of 15% or more over a month
The table below shows the performance of various assets following an oil price increase of more than 15% over the past month. In addition:
– We examine performance over 1, 2, 3, and 6 months after a 15% oil price increase is observed.
– For the 10-year US Treasury yield, we look at the change in basis points.
– We determine both average and median performance to gain insight into the skewness of observations. With relatively few observations, the average might provide a distorted picture.
– We also review deviations from the historical performance measured over all 1-, 2-, 3-, and 6-month periods, hence over the entire time frame. This clearly shows how various assets behave following oil shocks compared to their ‘normal’ pattern.
The table below shows our results.
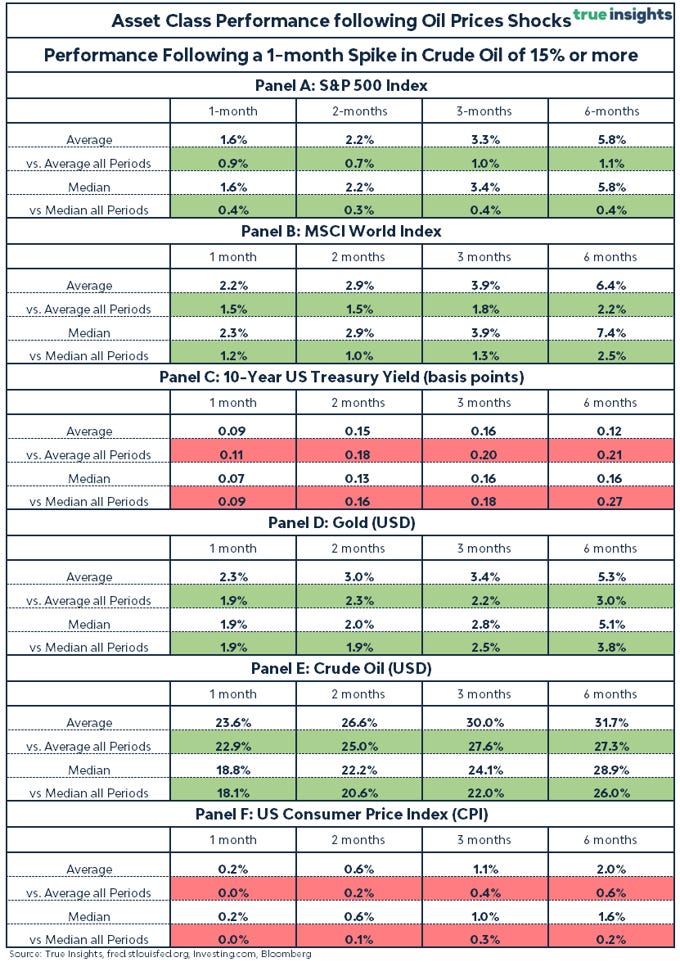
The following conclusions emerge:
– Historically, oil price shocks were not detrimental to stocks. Returns were positive for all periods after the shock. More importantly, returns were higher after oil shocks than the ‘normal’ 1, 2, 3, and 6-month returns. For instance, the S&P 500 Index rose by an average of 3.3% after an oil price shock of 15% in the previous month. This is one percentage point higher than the long-term monthly average of 2.3%. Thus, stocks tend to outperform in the six months following oil shocks.
– The MSCI World Index performed significantly better than the S&P 500 Index. The results suggest that global stocks are not more sensitive to negative impacts on the global economy related to oil shocks.
– The 10-year US Treasury Yield tends to rise after oil shocks. Since interest rates declined from 1980 to 2021, the difference with rate changes measured over the entire period since 1983 becomes more pronounced. Three months after a 1-month oil price shock of more than 15%, the rate on average stood 16 basis points higher – a difference of 20 basis points from the long-term average rate change, which was negative by four basis points.
– Gold emphasizes its role as an inflation hedge. For every period (1, 2, 3, and 6 months), the return on gold was significantly higher after an oil price shock of more than 15% compared to returns measured over the entire period. The outperformance is even stronger than that of the MSCI World Index.
– Yet, the most striking result comes from oil itself. After a 15% or more price shock in recent months, the oil price surged almost 24% (1 month later) to over 30% (6 months later). Price shocks of 15% often do not stop there. This suggests that if history repeats itself, the price of oil could rise significantly further.
– Lastly, we also look at inflation. After all, the recent oil price spike has central banks in a stranglehold. The inflationary effect of rising oil prices is evident. Taking the three-month example again: since 1983, the US price level, as measured by the Consumer Price Index, rose on average by about 0.7% over that period. However, following an oil price shock of 15% in the previous month, the price increase was 1.1%, or 0.4 percentage points more than average.
Oil Shock II – An increase of 25% or more over three months
We repeat the analysis, but this time for an oil shock where the oil price has risen by more than 25% in the past three months, as we’ve seen most recently. The table with the results is presented below.

Findings:
– Stocks, especially the MSCI World Index, perform significantly better than average after major oil shocks. The differences compared to the ‘normal’ returns are substantial.
– The US 10-year Treasury yield rises after an oil shock, contrary to a decline observed over the entire period since 1983.
– Gold performs exceptionally well after an oil shock. The outperformance compared to gold’s regular return is impressive.
– But it’s dwarfed again by the oil price itself. The conclusion is that if you measure an oil shock the way we have (15% increase in 1 month or 25% increase in three months), you’re capturing periods of larger and longer increases in the oil price. The likelihood of further significant increases should be considered substantial.
– Lastly, except for the first month after an oil shock, inflation rises faster than the long-term average.
Conclusion
Historically, oil price shocks have not been bad news for stocks, while having a limited negative impact on Treasuries. Gold performs exceptionally well after an oil shock, as does the oil price, which typically surges sharply after our defined shocks. Inflation tends to rise faster than average. This will make the task of central banks – aiming for a soft landing – even more challenging in the coming months. It seems impossible for central banks to achieve their inflation targets without significantly increasing the risk of a recession. That’s why we remain slightly underweight in stocks. Of course, we maintain a long position in gold.