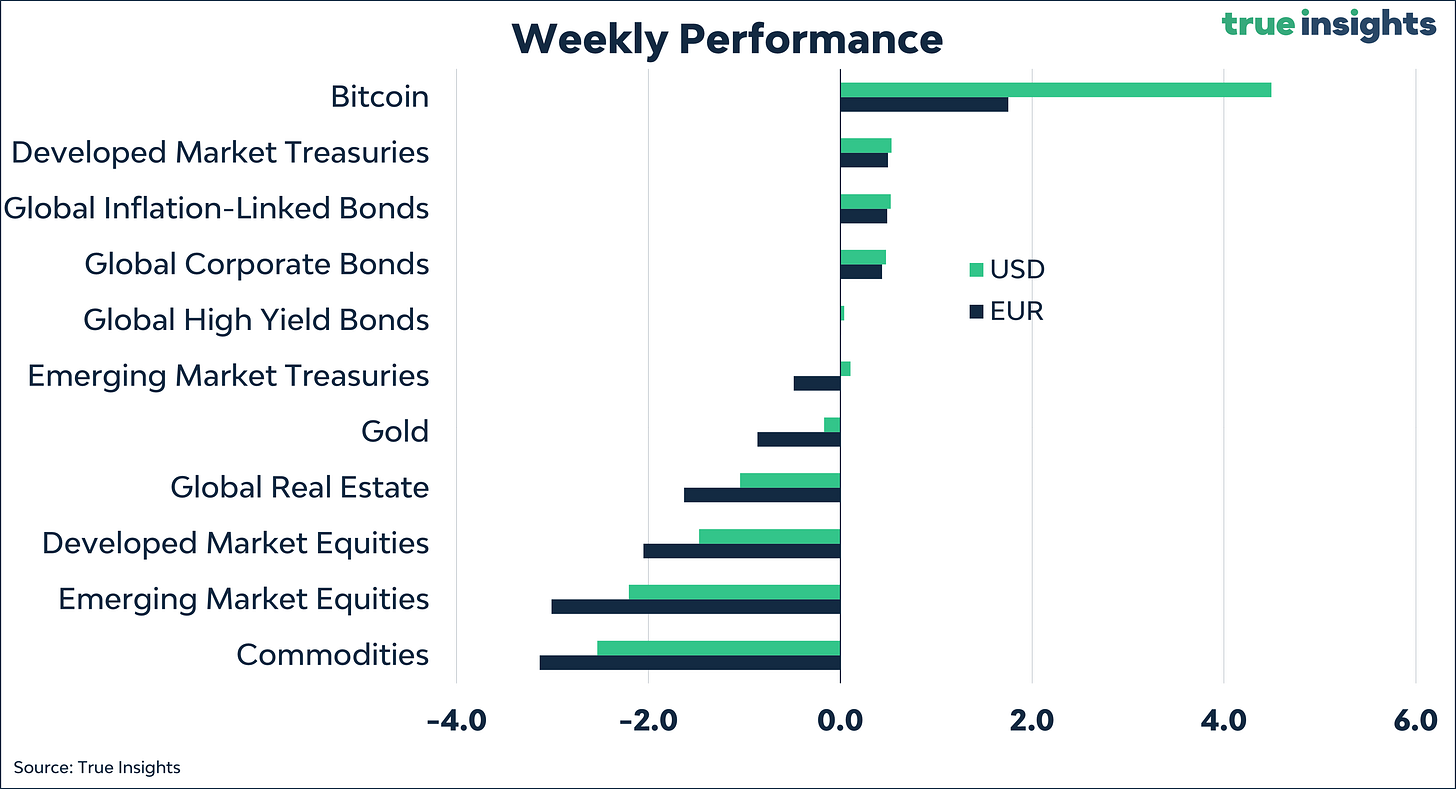
Welcome to the weekly Market Monitor, keeping you updated on the week’s most important charts and developments in financial markets.
MACRO
First Republic Bank – The next banking domino
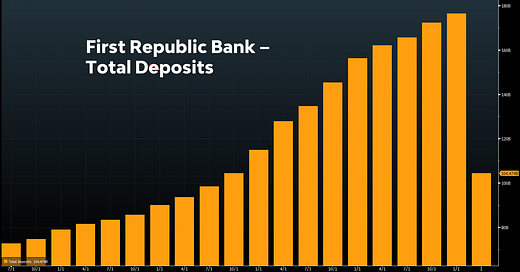
We have argued several times that the Federal Reserve’s Bank Term Funding Program (BTFP) will be insufficient to solve the issue of fleeing bank deposits. After reporting more than USD 100 billion in deposit outflows in Q1 (excluding a USD 30 billion deposit injection by large banks), the share price of First Republic Bank collapsed again.
More than 95% of the troubled bank’s market cap has evaporated since the downfall of Silicon Valley Bank. And while there has been no Federal Reserve/ US Treasury intervention yet at the time of writing, we can’t be far from it. First Republic Bank is likely gone too.
Depositors and investors are very aware of the (perceived) weakness in the regional banking system. This is why broader, far-fetching measures will be necessary, even if deposit outflow is contained overall. Based on Q1 and recent deposit data, the outflow of deposits has been slowing.
The table above shows that total commercial bank deposit outflows measured USD 620 billion in Q1. As we know now, First Republic Bank experienced USD 102 billion in outflows. FDIC loans, mainly related to Silicon Valley Bank, are valued at USD 172 billion on the Fed balance sheet, while Money Market Funds raked in a total of USD 463 billion in Q1. That Money Market Funds were stealing assets from banks was already known. In addition, the seemingly endless rise in assets was halted last week.
Unfortunately, this won’t stop things from worsening, at least from an idiosyncratic perspective. First, depositors and investors will look for the next weakest link, getting their deposits out and pushing the stock price down. Second, even if deposit flight is curtailed, regional bank profitability will be hurt as banks are forced to increase interest rates on their deposits. Second, representing nearly 70% of Commercial Real Estate loans, the national office slump will also weigh on regional bank earnings. Since February, when the first cracks started to emerge, regional banks have lost USD 130 billion, or more than 60% of their total market cap.
The broader US banking sector has lost nearly 300 billion, or 20% of its market cap.
Looking for cross-Atlantic contagion
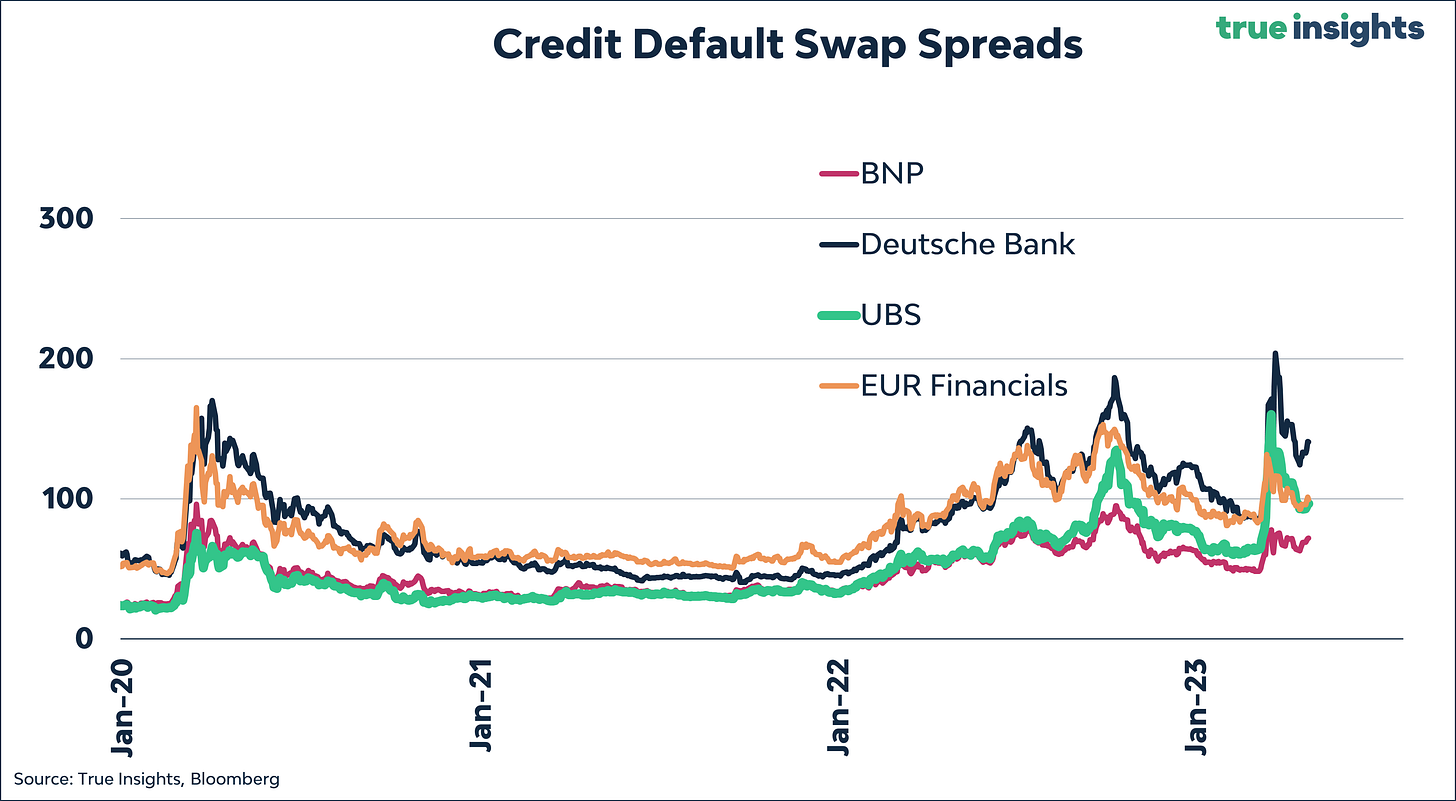
With banking turmoil making headlines again in the US, it’s worth keeping an eye on Eurozone financials’ CDS spreads. As the chart shows, the reaction has been muted. However, the initial reaction was comparably benign after Silicon Valley Bank cratered. Second, CDS spreads have by no means returned to pre-SVB levels.
ISM Manufacturing update – regional PMIs
Four of the US regional PMIs are in. And based on the consensus forecast for the remaining two (Kansas and Chicago), the ISM Manufacturing Index should be able to eke out a slight increase. However, the big spike in the relatively volatile Empire State Manufacturing Survey has been the outlier. The Philadelphia, Dallas, and Richmond PMIs all came in lower than expected. The jury is still out on the direction of the ISM Manufacturing.
Eurozone PMIs
The Eurozone PMI slumped to 45.5, its lowest level in 35 months. Like the ISM Manufacturing, it is approaching recessionary levels. However, the HCOB Eurozone Services PMI – the former Markit PMIs have been rebranded, now sponsored by Hamburg Commercial Bank – rose to a 12-month high of 56.6, suggesting a recession is not imminent.
Money is leaving
US Money Supply is shrinking at an unprecedented pace.
Compared to a year ago, M2 Money Supply has declined by a whopping 4.1%. As the chart below shows, money shrinkage follows a time of unprecedented growth. We appreciate the discussion about money stock vs. flow – especially with massive money supply growth resulting in strong bank deposit growth – but in the end, change matters most. Not in the least because inflation represents a change too. And Money Supply growth gives a very clear signal about where inflation is going.
The inflation sweet spot
With inflation falling rapidly, we looked at how close equities are to their inflation sweet spot. The chart below shows the 3- and 6-month S&P 500 Index returns when inflation is one standard deviation above/below its 5-year moving average. When inflation is low, future US equity returns (green bars) tend to be above the average of all 3-month periods (blue bars), whereas they are below average (purple bars) when inflation is high.
The next chart provides the return data when ‘High’ and ‘Low’ inflation are defined as headline inflation levels two standard deviations above/below the 5-year moving average. The divergence between the two inflation environments widens sharply, with the S&P 500 Index realizing an average return of 10.4% in the six months after inflation is ‘Low’ and -0.7% when inflation is ‘High.’
You can find the complete note on the historical relationship between inflation and S&P 500 Index returns here.
Are we close?
So, how far from the sweet spot are we? Given that that threshold – one standard deviation below the 5-year moving average – lies at 2.7% and March headline CPI came in at 5%, it seems quite a bit. But massive base effects and slower economic growth may imply that prices won’t rise at all in the coming months. Assuming prices will remain steady, headline inflation will qualify as ‘Low’ when the June numbers are reported in July. But without catalysts to push equity markets higher and the odds of a recession increasing, there will likely be a challenging few months to bridge.
Buying gold
Central banks continue to buy gold. Most of them are emerging market central banks. However, we would be interested to know which central banks represent the 65% ‘unreported.’ Given the size of central bank gold buying, the most since 1967, it seems reasonable to assume that bigger central banks have joined the party as well.
Sentiment
The USD 300 billion positioning issue
Positioning has been one of the few positives for equities in recent weeks, with net non-commercial futures positioning negative and global fund managers underweight in the asset class. Yet, even from the positioning perspective, a storm may be brewing.
As the chart below reveals, the positioning of Systematic Macro investors is solely driven by market volatility. And due to rapidly declining volatility, these investors have bought a whopping USD 170 billion in global equities in recent weeks.
But volatility is about to rise as:
Banking anxiety is clearly back on the table, with First Republic Bank reporting more than USD 100 billion in deposit outflows resulting in a share price decline of 60% during the last two trading days. Without broad-based measures, banking-related volatility has free reign.
The global macro-environment is deteriorating. As a result, economic surprise indices have already turned.
Bond market volatility remains elevated relative to equity market volatility.
Financial conditions continue to tighten, with tighter lending standards, rising spread levels, and one more Fed hike.
Extremely low volatility attracted option sellers, artificially mean-reverting equity indices.
Bad breadth
Market breadth remains poor. Just seven stocks in the Russell 1000 (large cap) index are up this year. All the others are down on average!
Fear & Frenzy Sentiment
It does not get much more ‘Neutral’ than this.
Valuation
With 188 companies reported, the overall picture has not changed from last week. Earnings are not falling off a cliff and beating expectations more than 80% of the time. But the bar has been set very low, and earnings are coming in lower than in the previous quarter, albeit modestly.
Big Tech
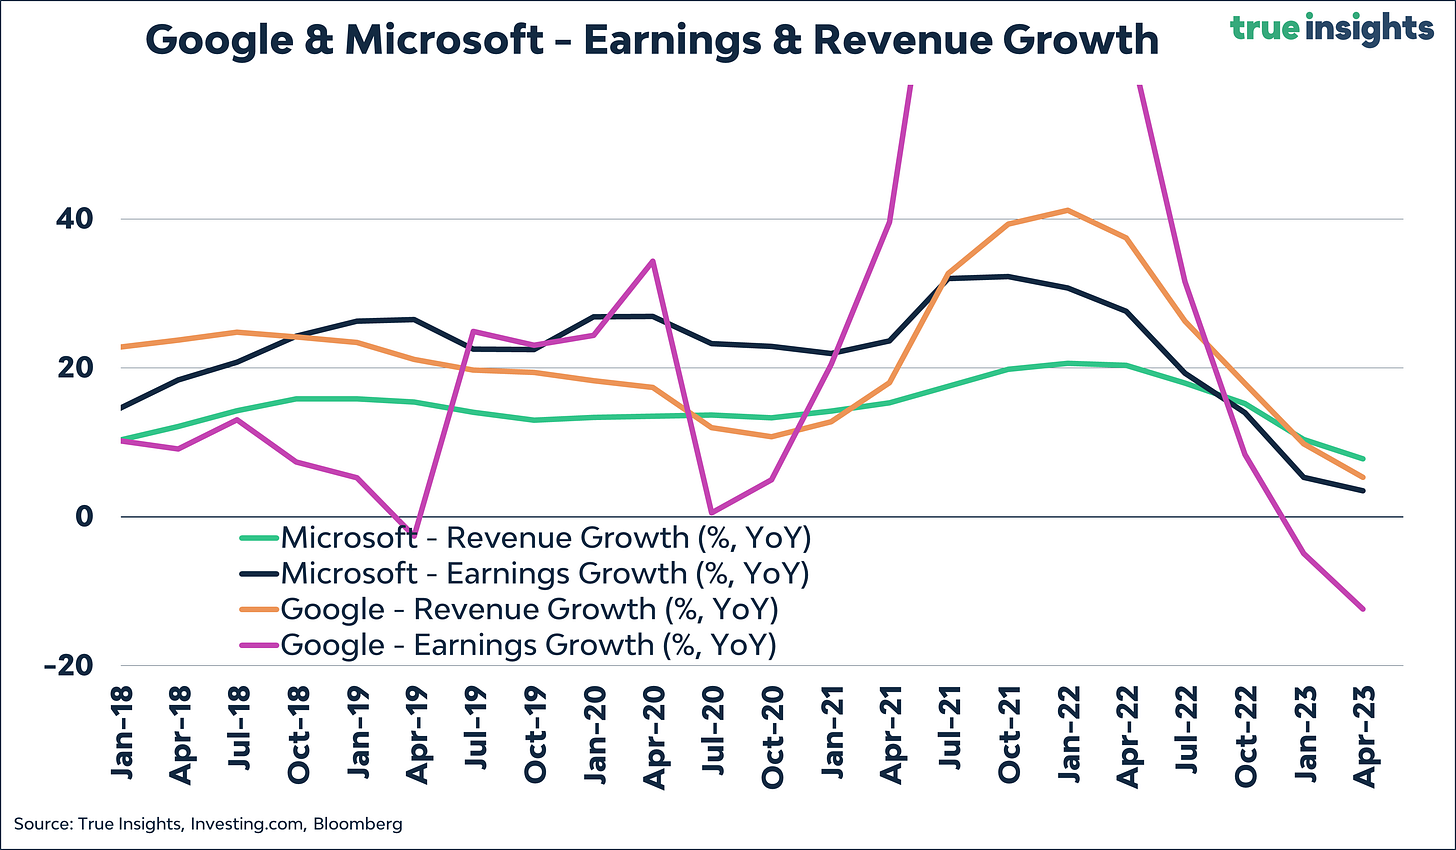
Significant beats from Google, and especially Microsoft, prevented stock markets from realizing bigger losses due to First Republic Bank’s woes. However, focusing only on beats misses the underlying picture. Both revenue and earnings growth have come significantly, with the latter turning negative for Google. When their lofty valuations are considered, these companies seem priced for perfection, or at least for a no-landing scenario.
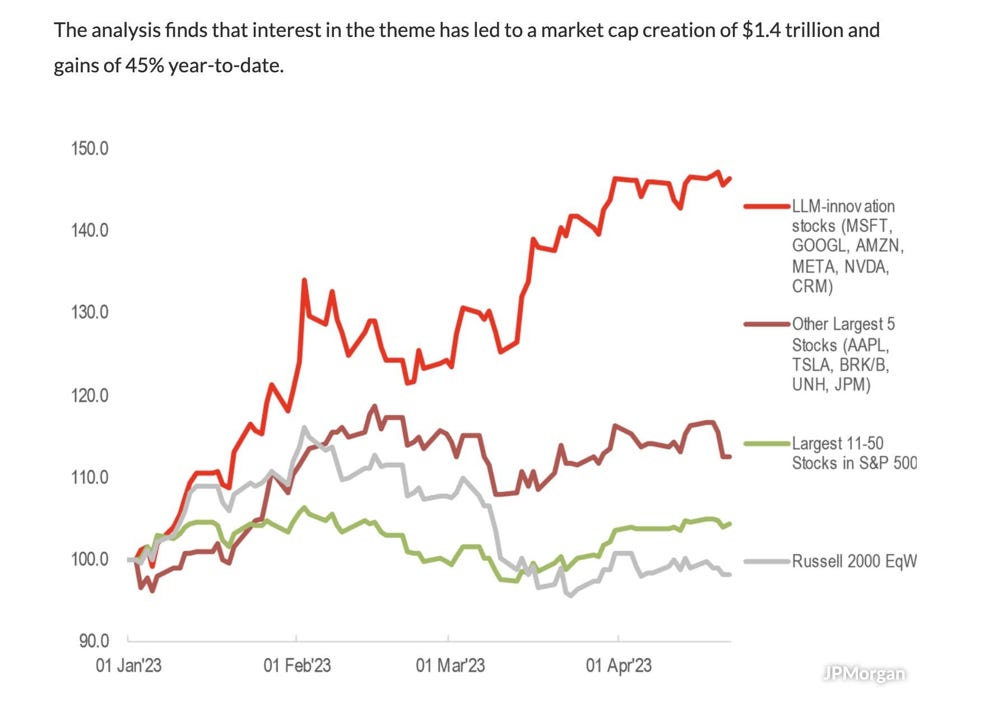
A lot of this has to do with the massive Artificial Intelligence boom that is going on. Like many technology trends, AI is lifting all tech boats as it gets extrapolated throughout the sector. JP Morgan estimated that roughly USD 1.4 trillion in market cap was created by ‘interest in the theme’ this year. As we showed in the MACRO section, the combined decline in market cap of US banks equals less than USD 300 billion from its February high. In case you were wondering why equities are up this year.
But history has also shown that, in the end, only a few winners will make money from these trends. And some point, the tech sector will have to give up some of its AI-inflated valuation.
Markets
Active Weights
BALANCED PORTFOLIO
ASSET CLASS VIEWS
Developed Market Equities
There were already few catalysts to push stock markets higher. And with banking jitters resurfacing quickly, downside is building. Markets price a series of Federal Reserve rate cuts toward the end of the year, and other central banks have parted from their extremely hawkish stance. Investors expect positive earnings growth in the next 12 months, and Valuation is unattractive. Sentiment is the only pillar of our framework, giving a neutral signal based on the Fear & Frenzy Sentiment Index. We are underweight/short Developed Market Equities.
Emerging Market Equities
Emerging Market Equities have been lowered to underweight. Despite the higher-than-expected GDP growth, the China reopening seems lackluster. In addition, our conviction that equity will turn globally has increased. At the same time, with economic activity deteriorating in the rest of the world, investors will be drawn to places that offer growth. The US dollar is going nowhere as the Federal Reserve inches toward the end of this tightening cycle. Valuation, measured through the equity risk premium, is getting more attractive relative to Developed Market Equities.
Global Real Estate
Global Real Estate remains short/underweight. The downturn in the global real estate market is not over. The brunt of declining home prices has yet to come. In addition, Commercial Mortgage-Backed Securities (CMBS) are being scrutinized by investors due to their interest-rate sensitivity. And lending standards for the sector will further tighten as US regional banks represent the biggest share of Commercial Real Estate Loans. With some CMBS defaults already reported, risks are growing..
Global High Yield Bonds
Global High Yield Bonds remain short/underweight. First, high yield bonds remain the only asset classes reflecting zero odds of a recession. Second, tightening lending standards will result in an increase in the default rate to above average. High yield bonds are not pricing such a scenario. Third, historically, there has been a strong correlation between high yield and CMBS spreads.
Global Corporate Bonds
Global Corporate Bonds are neutral. From a relative perspective, spreads are slightly higher than on high yield bonds. But they remain too low if a recession is the base case.
Developed Market Treasuries
For the first time in more than two years, our ‘fair value’ estimate of the 10-year US Treasury yield and the current 10-year yield have converged. From a valuation perspective, 10-year US Treasuries are no longer outright attractive. However, several macro indicators like the ISM Manufacturing Index and Financial Conditions suggest Treasuries should be favored over equities. Developed Market Treasuries are neutral.
Emerging Market Treasuries
As a result of the yield declines in Developed Markets, yields on Emerging Market Treasuries look more attractive. And with markets pricing out Fed rate hikes, currencies are doing well too. However, overall credit risk is increasing, and it would not be the first time we saw spillover effects into EM Treasuries. We are neutral.
Commodities
Before OPEC+ announced its surprise production cut, oil, and industrial metals prices were coming down, signaling a rise in the likelihood of a recession. Historically, OPEC production cut announcements have been followed by rising oil prices, a key reason we remain neutral despite the deteriorating macro environment.
Global Inflation-Linked Bonds
The reason for the overweight in Global Inflation-Linked Bonds is straightforward. While realized inflation will come down in the coming months, inflationary pressures remain abundant. Should the Fed decide to pause or end rate hikes, the foundation for another wave of inflation will be created. Over the medium term, it’s hard to imagine that inflation risks will not stay elevated.
Gold
The price of gold is close to a new all-time high. Elevated uncertainty surrounding the medium-term outlook for inflation and banking risk, together with lower real yields, have propelled the gold price to over USD 2,000. The periodic questioning of the US dollar has recently been making headlines again. While the US dollar will not lose its hegemony as the world’s reserve currency anytime soon – there just isn’t a market as deep as the dollar – gold is one of the few options to consider when aiming to diversify away from the greenback. We are overweight gold.
Bitcoin
For Bitcoin maximalists, the recent bashing of the US dollar by China and Saudi Arabia will be music to their ears. But at this point, there simply isn’t an asset that could dethrone the US dollar because of its sheer size. This does not mean that savers and investors, retail and institutional, won’t look for alternatives to balance the potential long-term risks of current monetary policies and geopolitical risks. It would be naïve to not consider Bitcoin at all from this perspective. Next, liquidity has increased in the last month, supporting the riskiest assets. We are neutral Bitcoin.


