

Bubble or Breadth: Evaluating the State of the Stock Market
No current stock market boom is evident, but concerns arise regarding market breadth and concentration of market value in a few major stocks.


In our previous analysis, we delved into the empirical study by Goetzmann (2016), which spanned 3,000 stock market-years across 21 different markets from 1900 to 2014. This comprehensive study confirmed that stock market bubbles – characterized by a 100% boom in real price within a single year, followed by a 50% or more downturn in the ensuing year – a very rare. Goetzmann’s findings indicate a tiny 0.3% bubble frequency.
Searching for Bubbles
Today, our examination pivots to assess the performance of selected stock market indices, to determine if we are anywhere near a stock market boom. The chart below traces the trajectory of various indices (and one single stock) since their low in October last year:
– MSCI World
– S&P 500
– NASDAQ
– Global Semiconductors
– SOX (The Philadelphia Semiconductor Index)
– NYSE FANG+ (comprising Alphabet, Amazon, AMD, Apple, Meta, Microsoft, Netflix, NVIDIA, Snowflake, and Tesla)
– Non-profitable Tech
– ROBO Global® Robotics and Automation Index
– NVIDIA
Before proceeding, it’s worth noting that Goetzmann’s study revolves around country-level indices. Thus, despite incorporating AI and tech-related indices into our sample – since the bubble discussion predominantly involves these sectors – we would exercise caution before labeling a sharp surge in a particular sector as a bubble. However, considering the rising significance of tech and AI stocks in broader indices, their inclusion in this examination could provide additional insight into the often unsubstantiated bubble discussion.
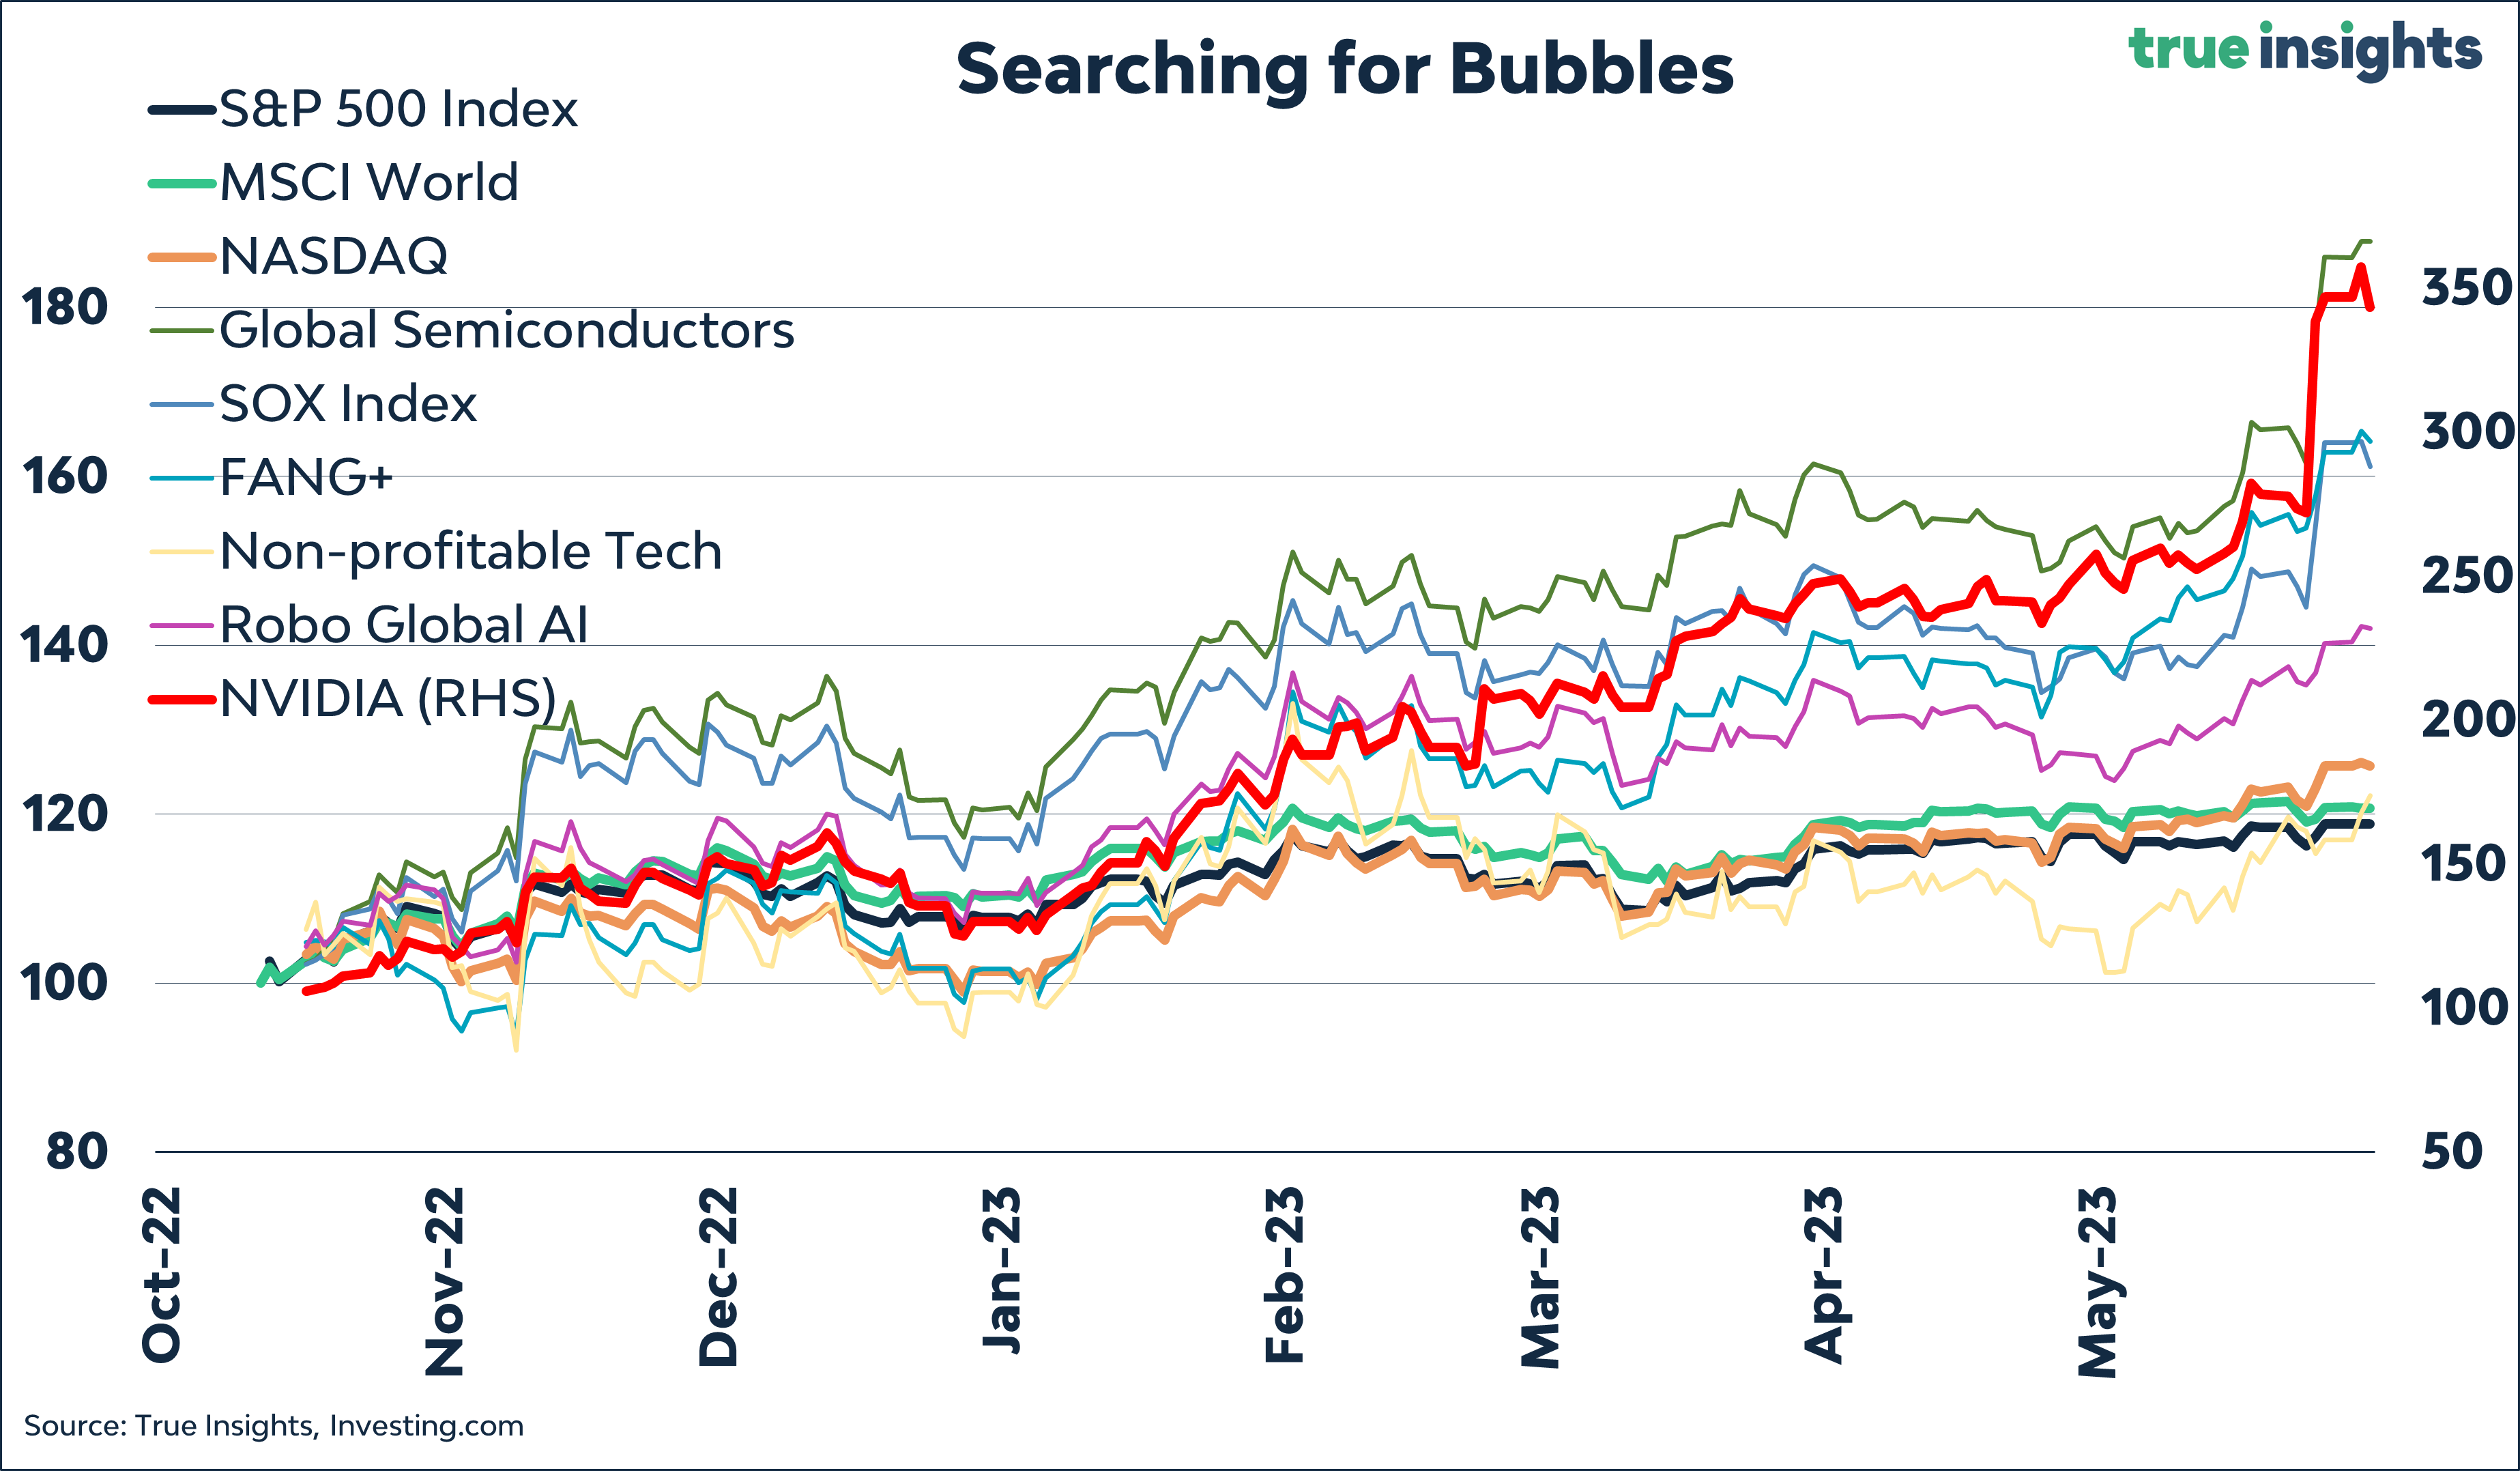
Based on Goetzmann’s core definition, a 100% rise within a year, it is evident that we are not currently experiencing such a boom. None of the indices mentioned in the previous analysis have shown an increase of more than 100% since their low in October. While NVIDIA, as a single stock, has risen by more than 100%, it would not make much sense to declare a market bubble based solely on the performance of a single stock.
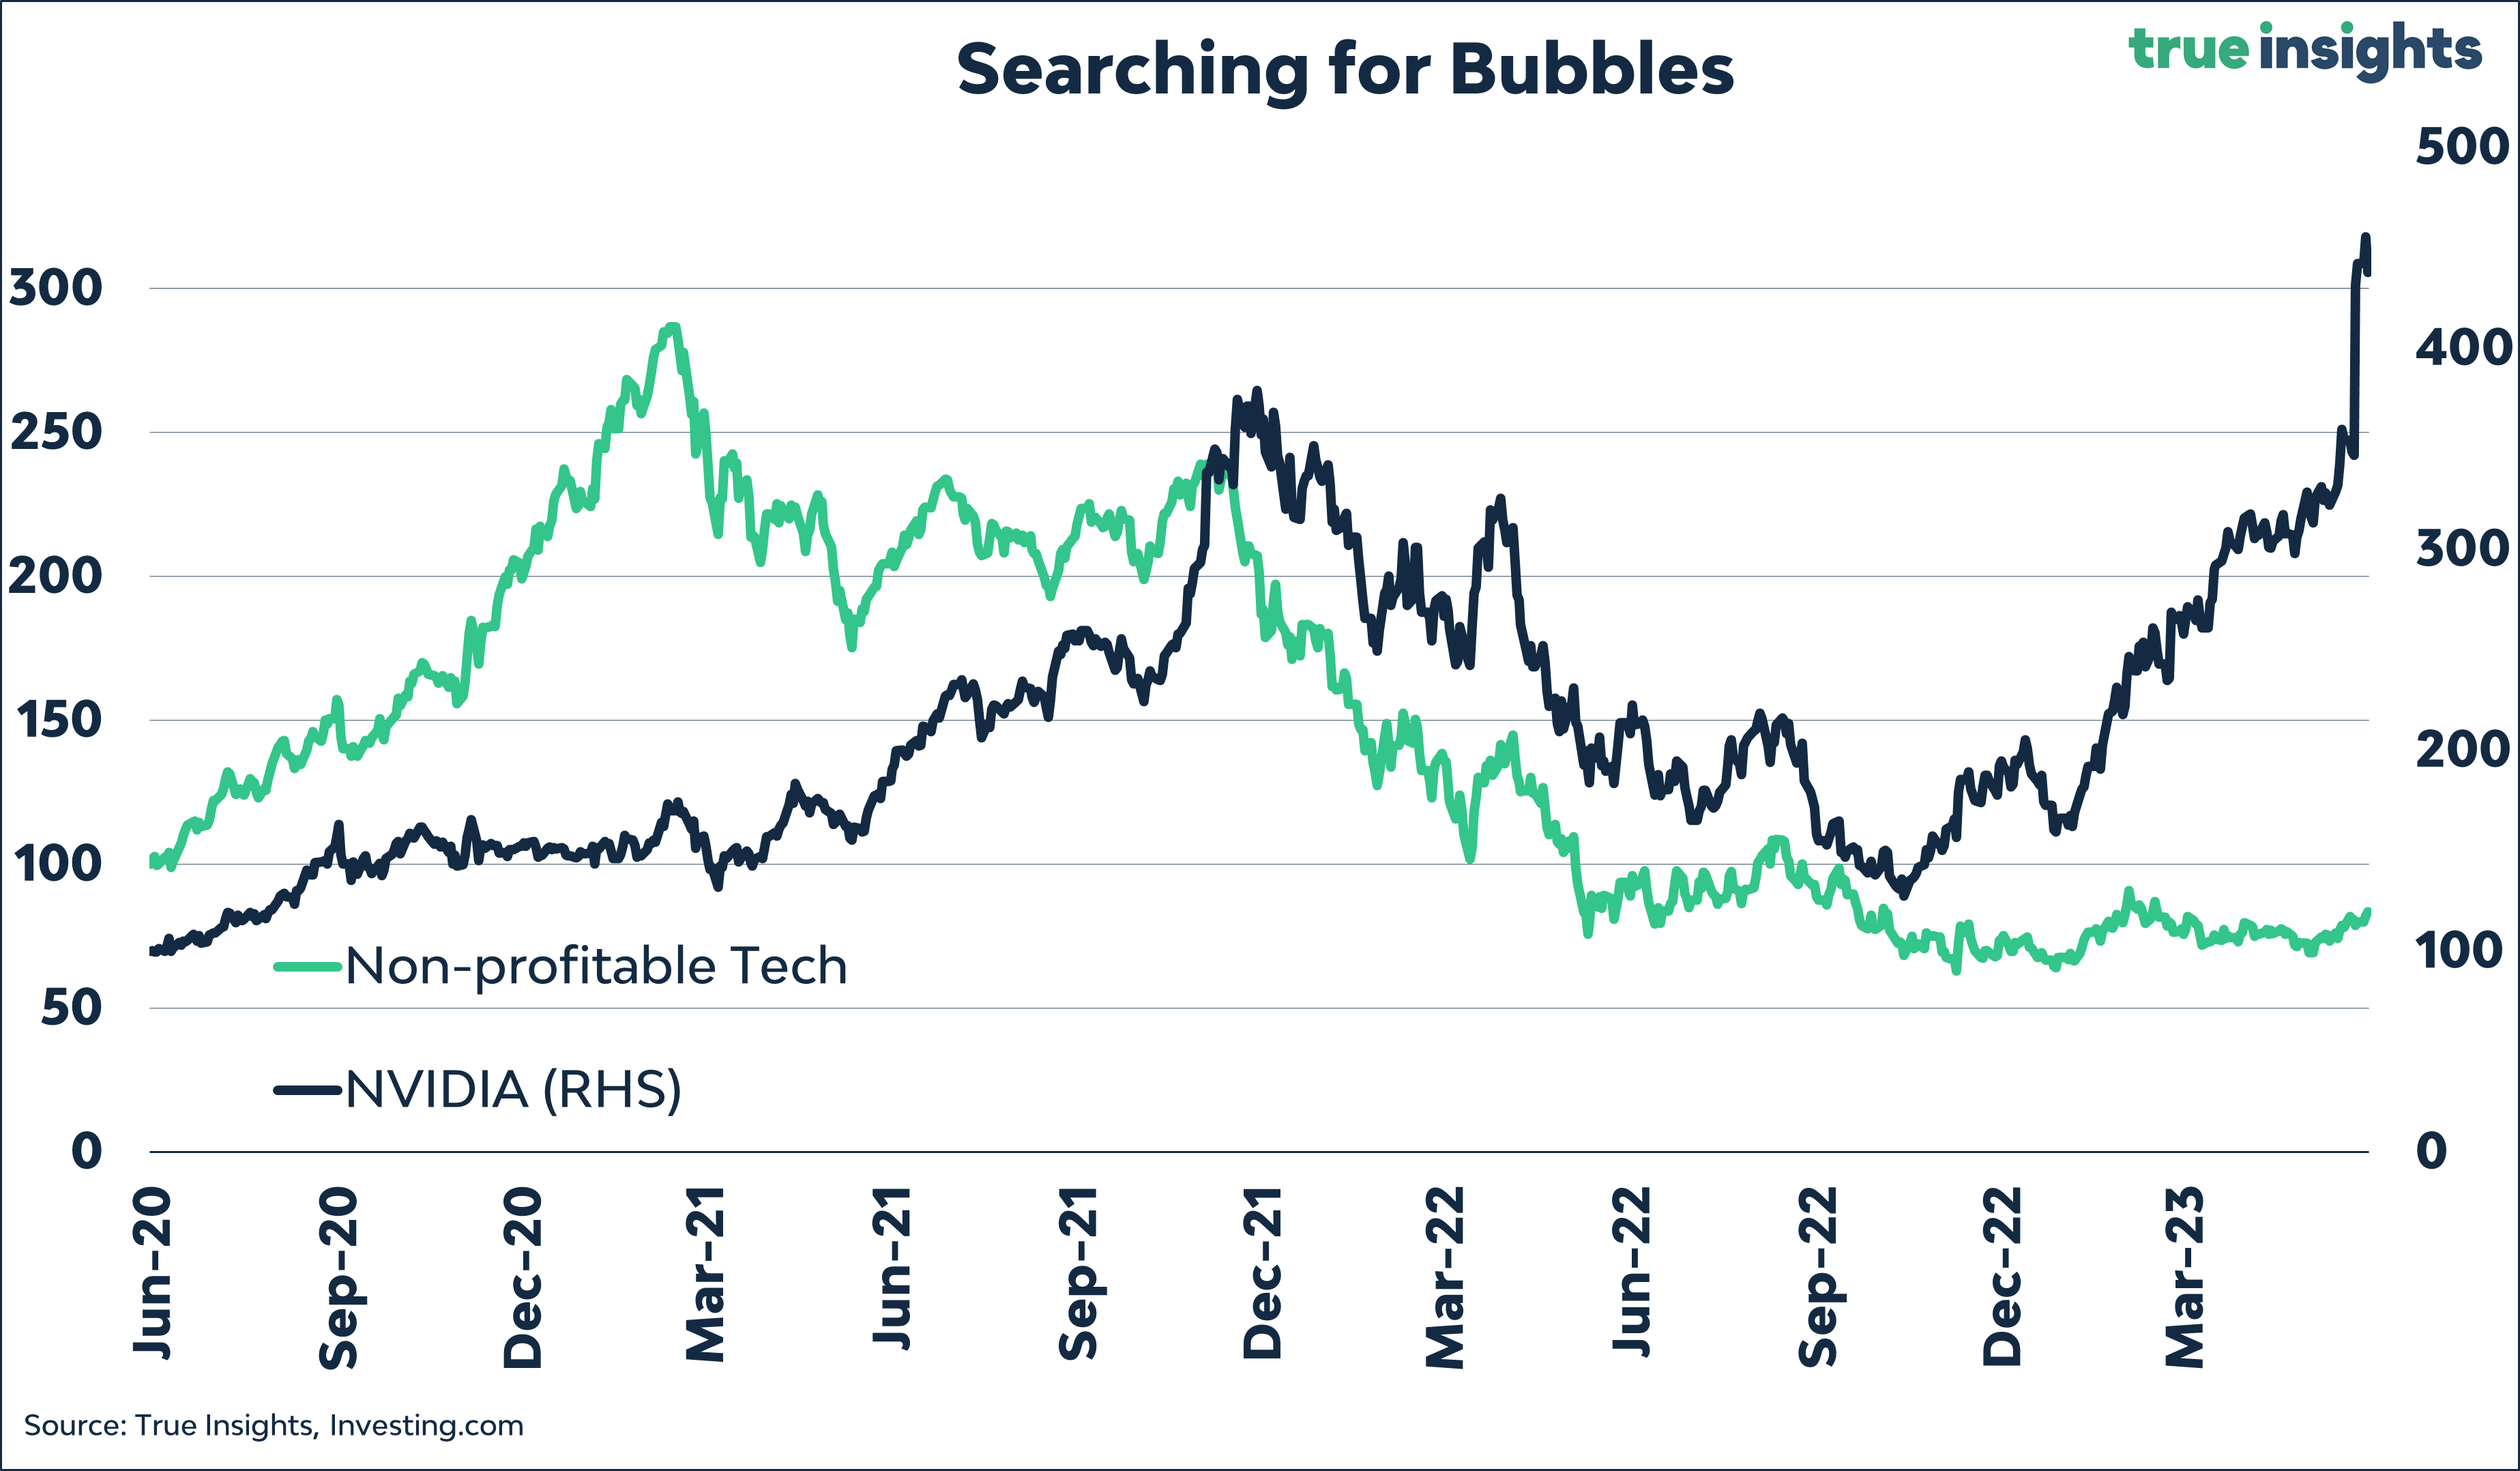
To capture some of the most iconic stock market bubbles in history, such as the Dot Com boom of the late 1990s, Goetzmann also considers an alternative definition of a boom. In this case, a boom is characterized by a period of three years during which the market experiences a 100% increase, followed by a subsequent drop of 50% or more within the next five years.
To visualize this broader definition, the following chart illustrates the performance of the nine indices mentioned earlier, and NVIDIA, starting from June 2020, three years ago. It is worth noting that this starting point coincided with the height of the Covid crisis, but the index levels at that time were relatively close to the pre-pandemic levels.
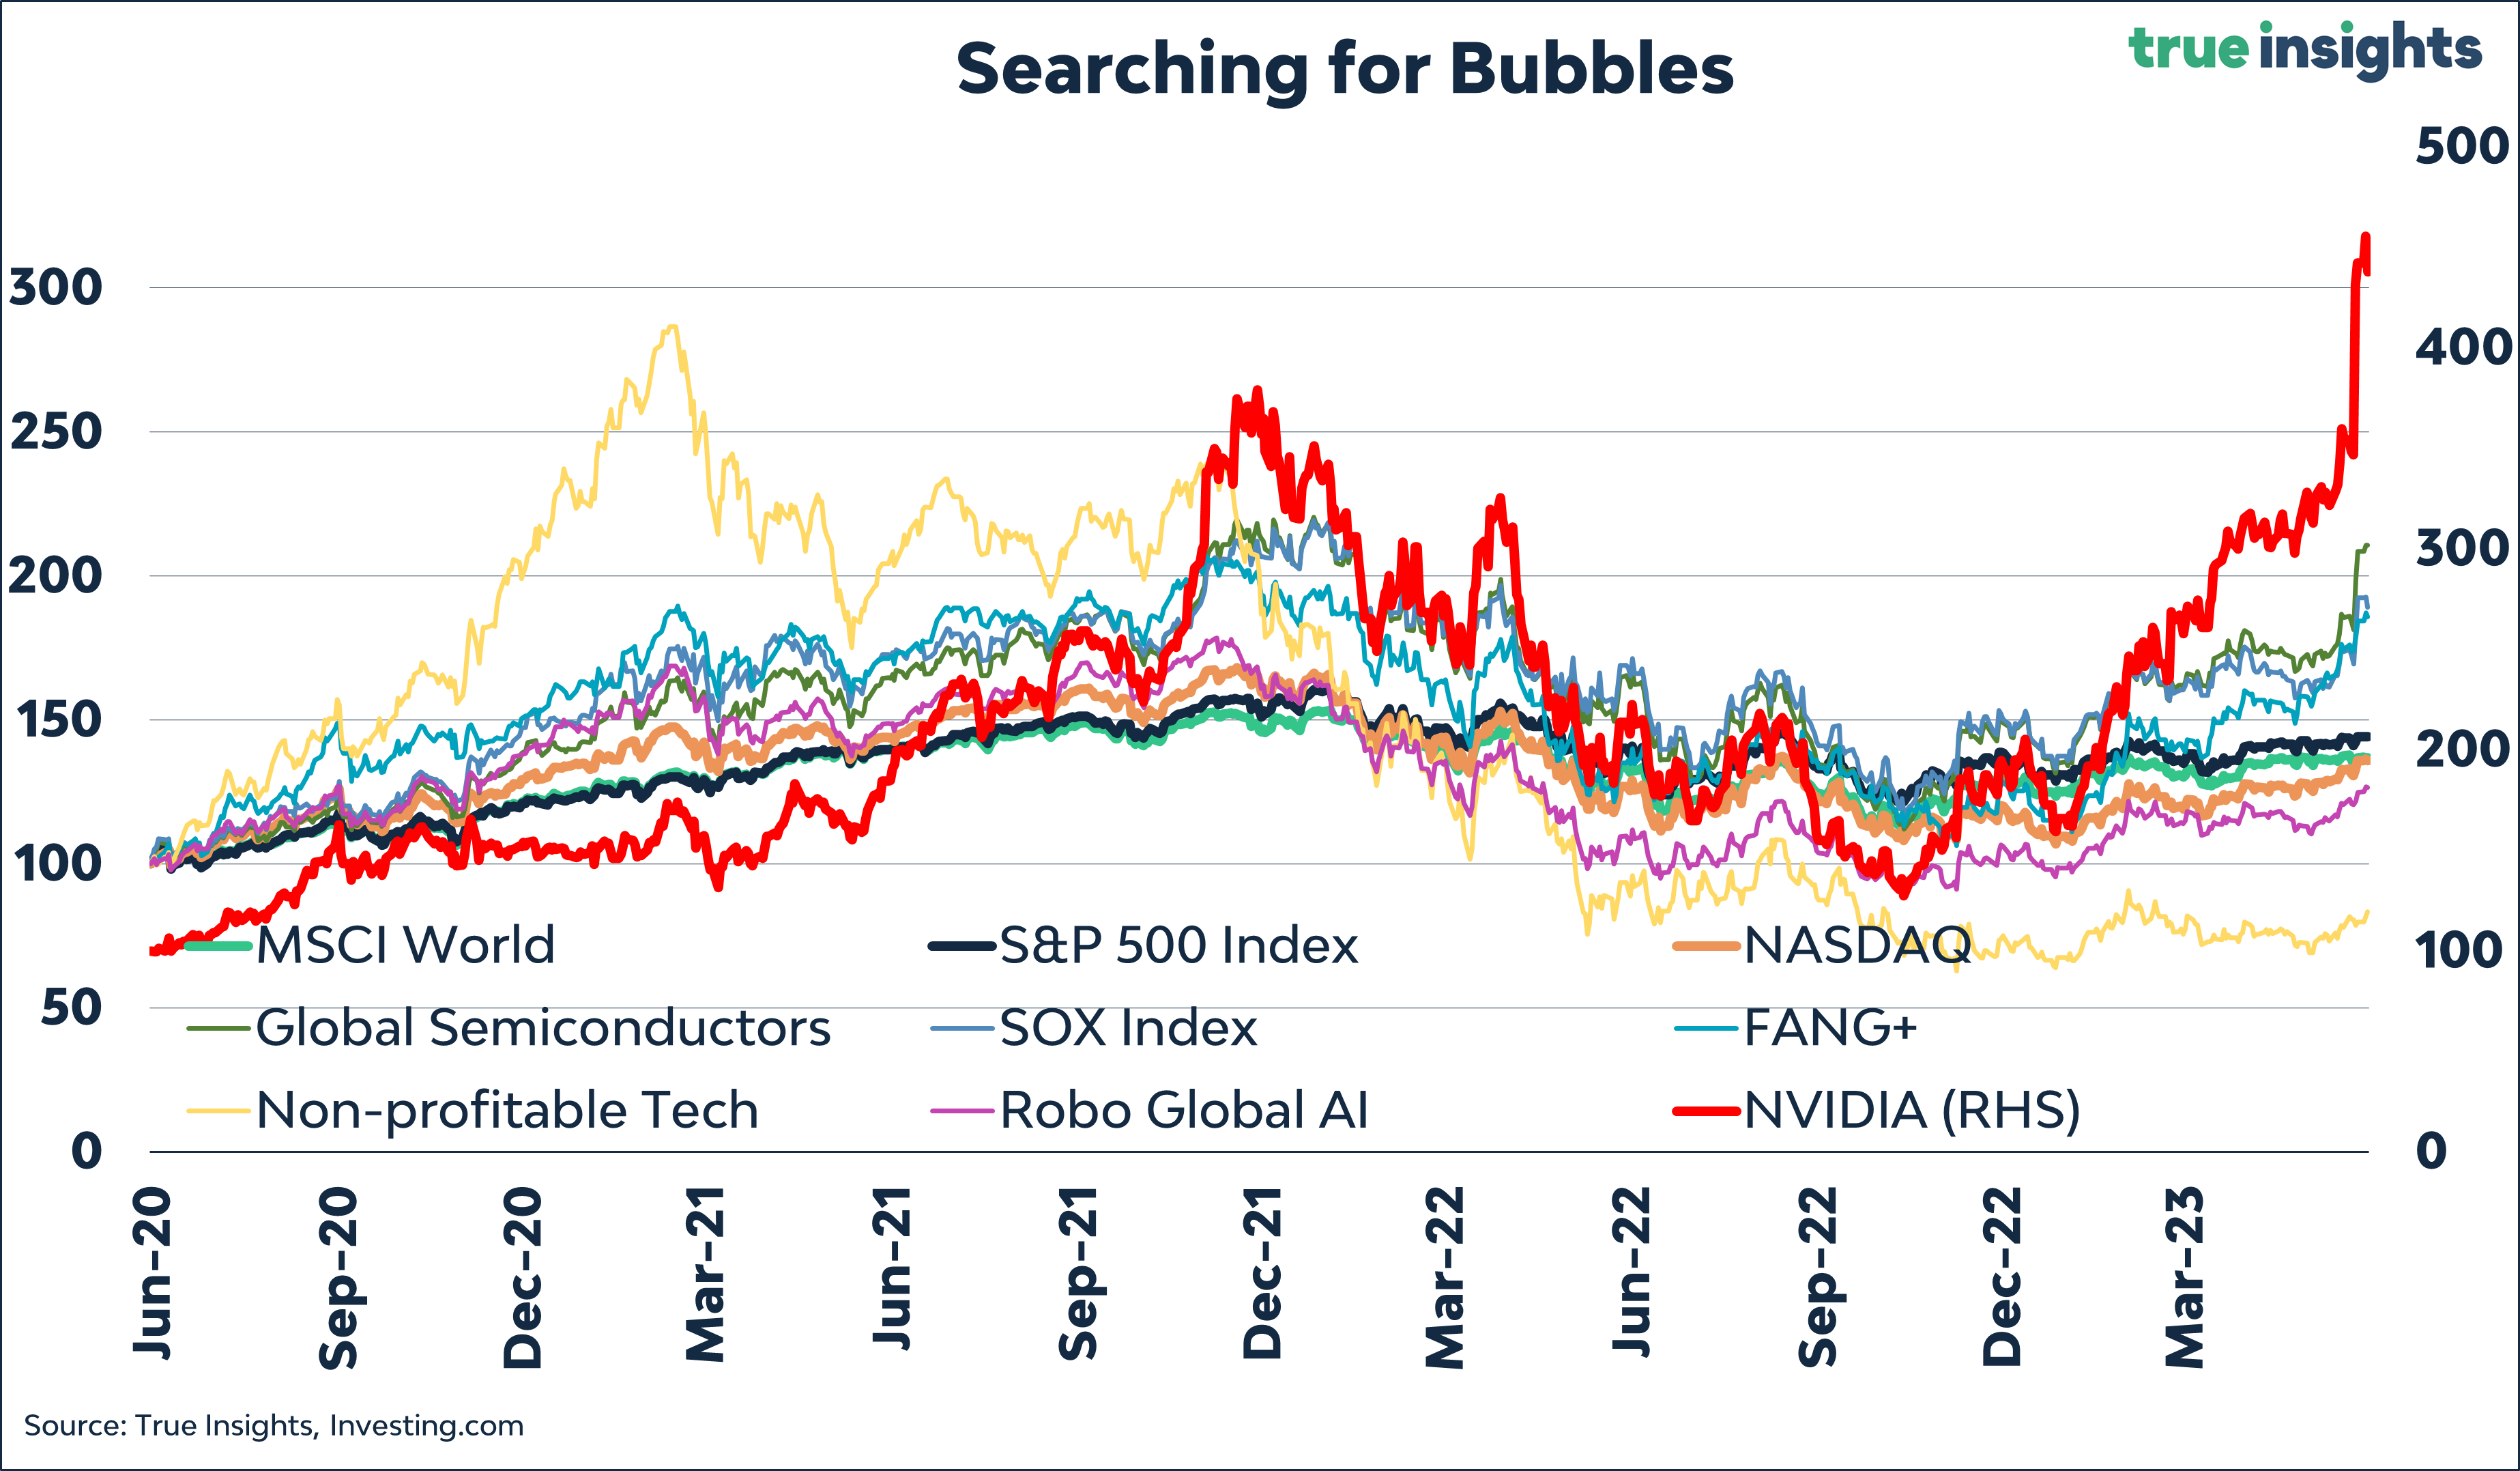
As depicted in the chart, several indices have surpassed the 100% threshold, but only two investments in our sample exhibited a subsequent decline of 50% or more. This includes NVIDIA, once again, and Non-Profitable Tech stocks. Only if we concluded that Non-Profitable Tech stocks represent a large enough set of stocks to participate in the bubble analysis there would have been just one bubble in the past three years. Obviously, doing so is highly debatable, and a fairer conclusion would be that we have not seen any bubbles in recent years, confirming Goetzmann’s findings that bubbles are scarce.
Breadth vs. Bubble
However, this does not imply that all is well. Observing financial and social media narratives, market bubbles are often mistaken for market breadth. Unfortunately, market breadth does not paint a particularly positive picture.
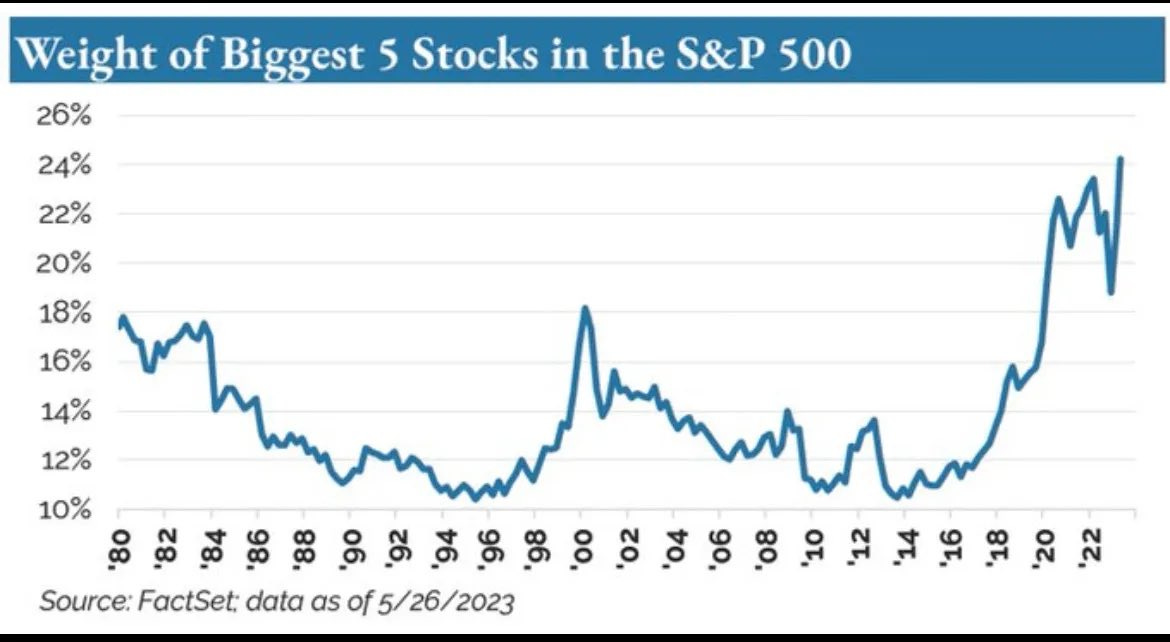
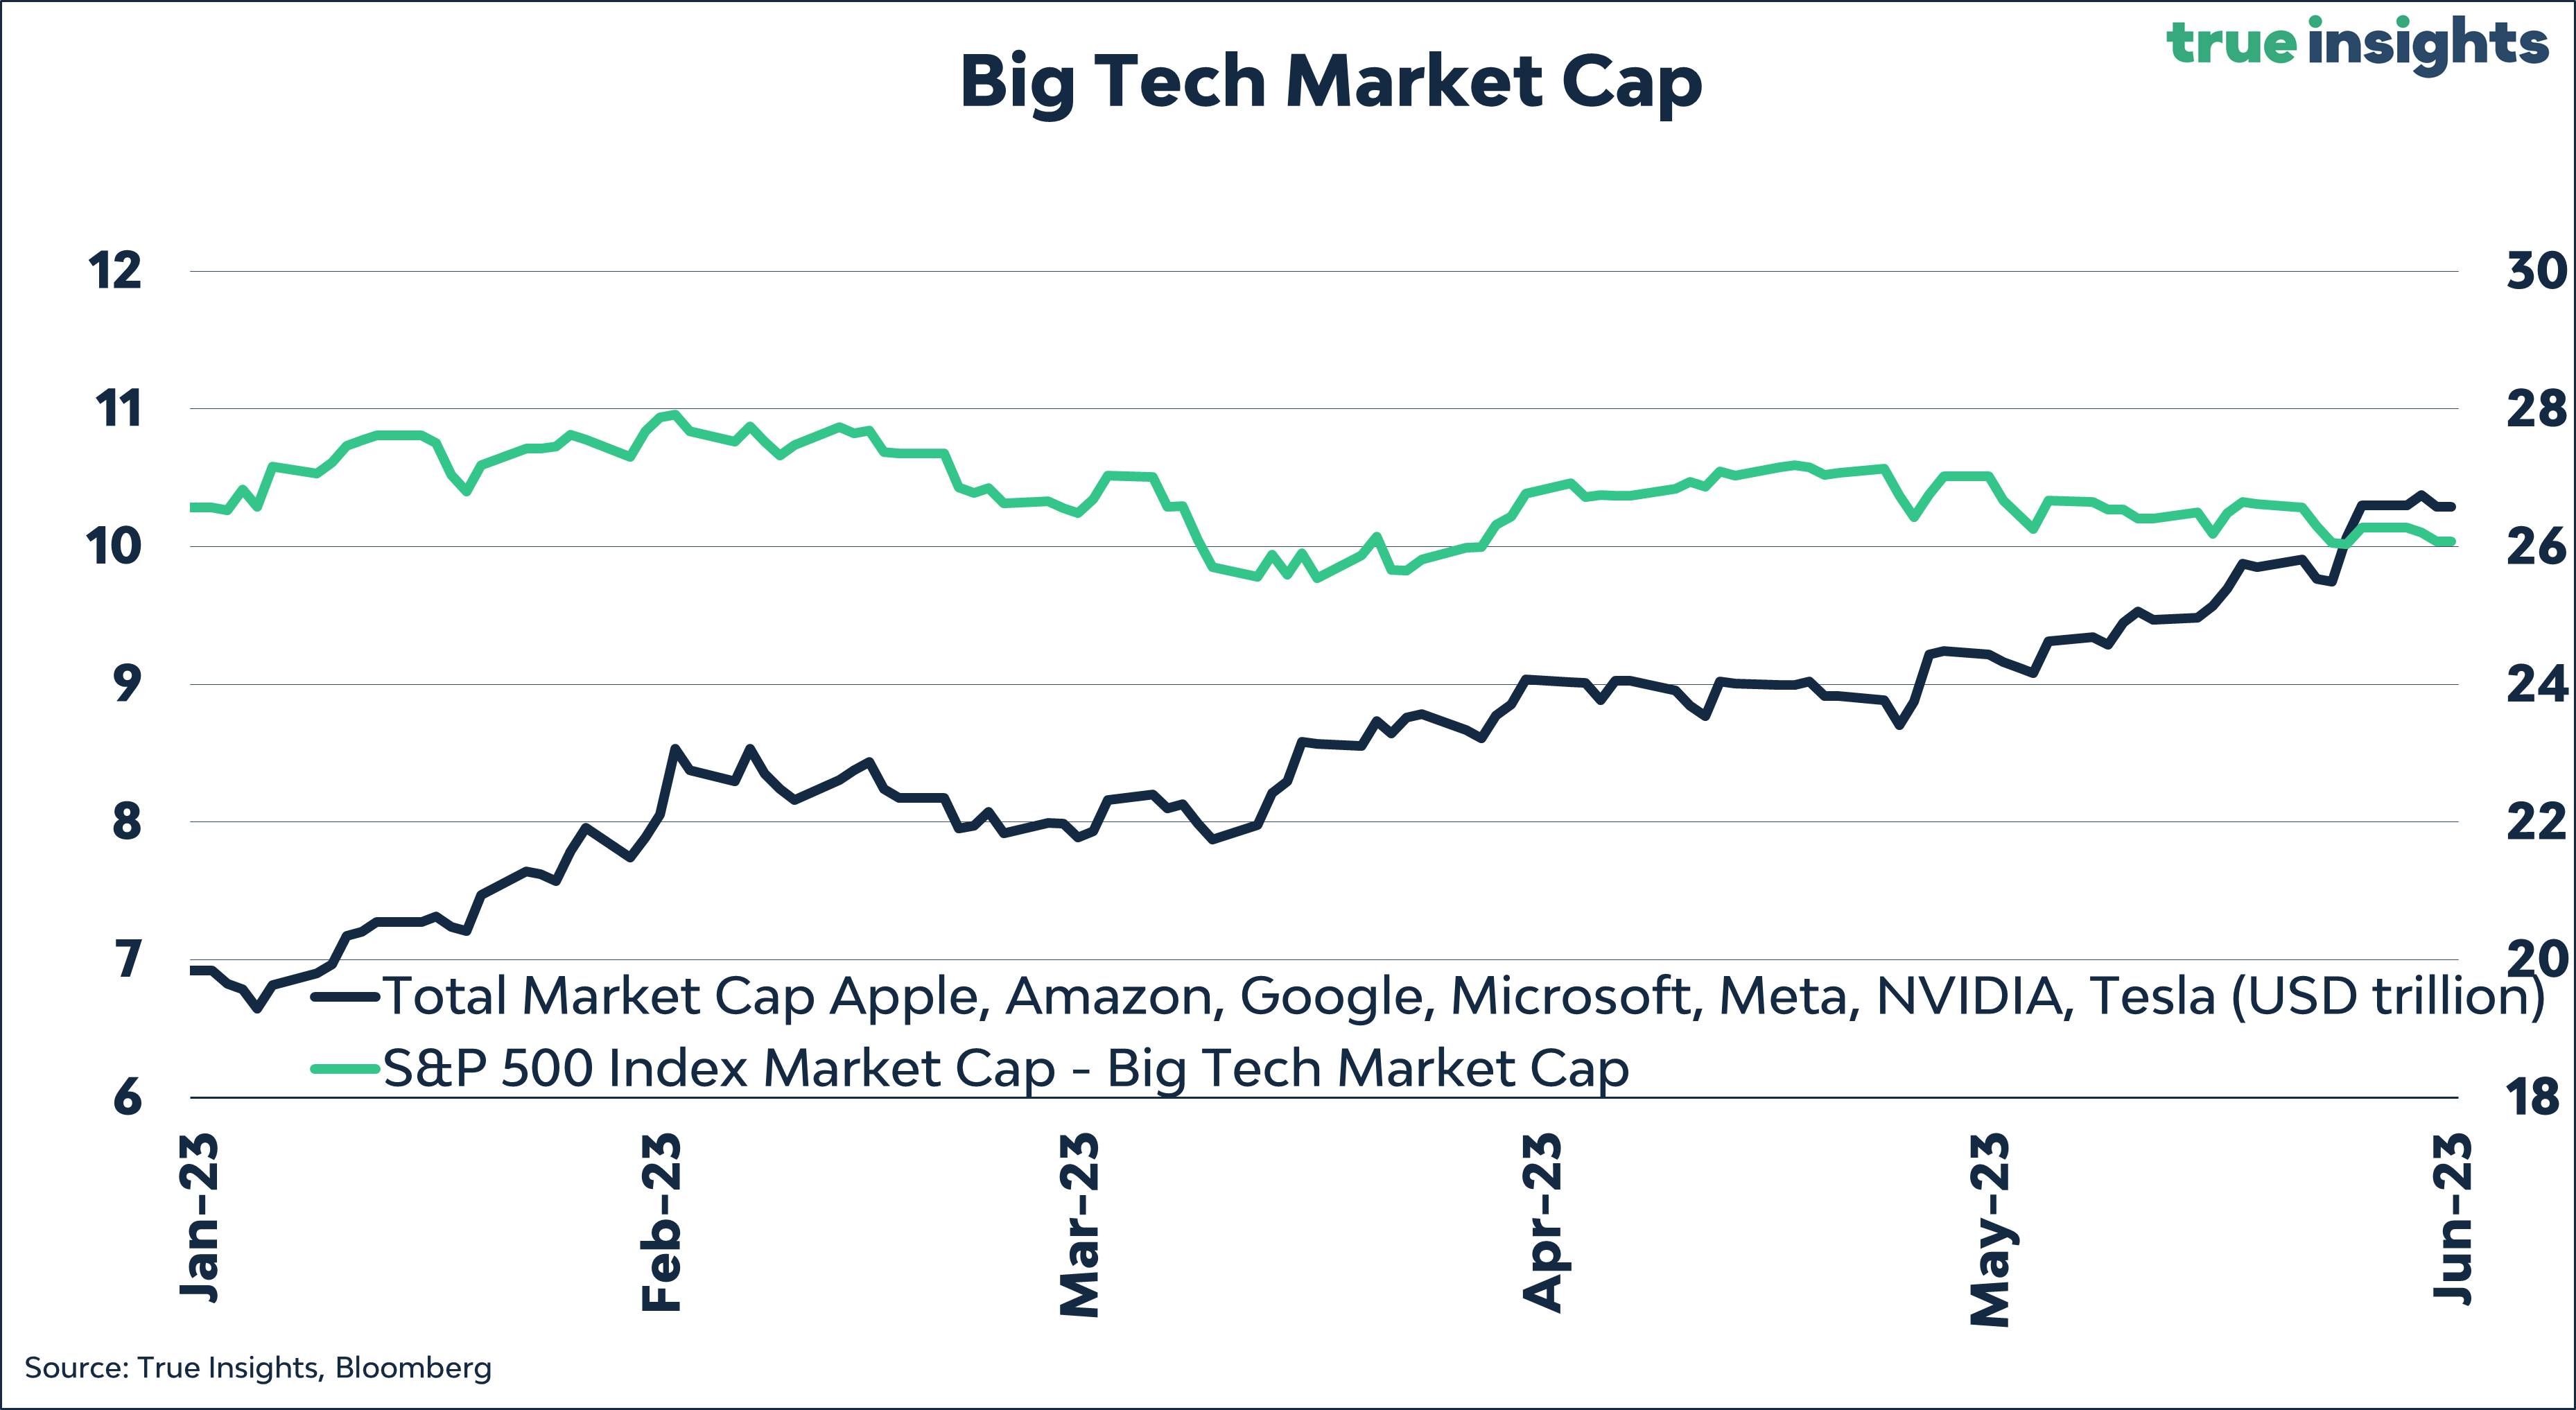
Currently, the five largest US stocks account for 24% of the total market capitalization of the S&P 500 Index. Additionally, only 35% of all NASDAQ stocks are trading above their respective averages, excluding the Big Tech companies. Furthermore, excluding BigTech, the market capitalization of all other stocks in the S&P 500 Index has experienced a decline of 2% this year. These figures highlight the concentration of market value in just a few major stocks.
Sources:
Goetzmann, William N., Bubble Investing: Learning from History (January 11, 2016). Available at SSRN: http://ssrn.com/abstract=2784281 or http://dx.doi.org/10.2139/ssrn.2784281