
The Weekly Market Monitor – The End of Goldilocks?
The Weekly Market Monitor – The End of Goldilocks?
Will the US consumer continue to spend? Will inflation destroy the rally? Will China ever get it right? Will the Bank of Japan leave NIRP policy? This and more!

Welcome to the Weekly Market Monitor, keeping you updated on the week's most important charts and developments in financial markets.
US retail sales are off to a lousy start of 2024
Excess savings are gone, and the regular savings rate is low. This must be the end of extraordinary growth, right?
What about income, wages, and wealth?
The higher-than-expected producer price data robbed investors of the ‘Fed must cut rates soon’ narrative. Interestingly, the PPI suggests lower inflation from here.
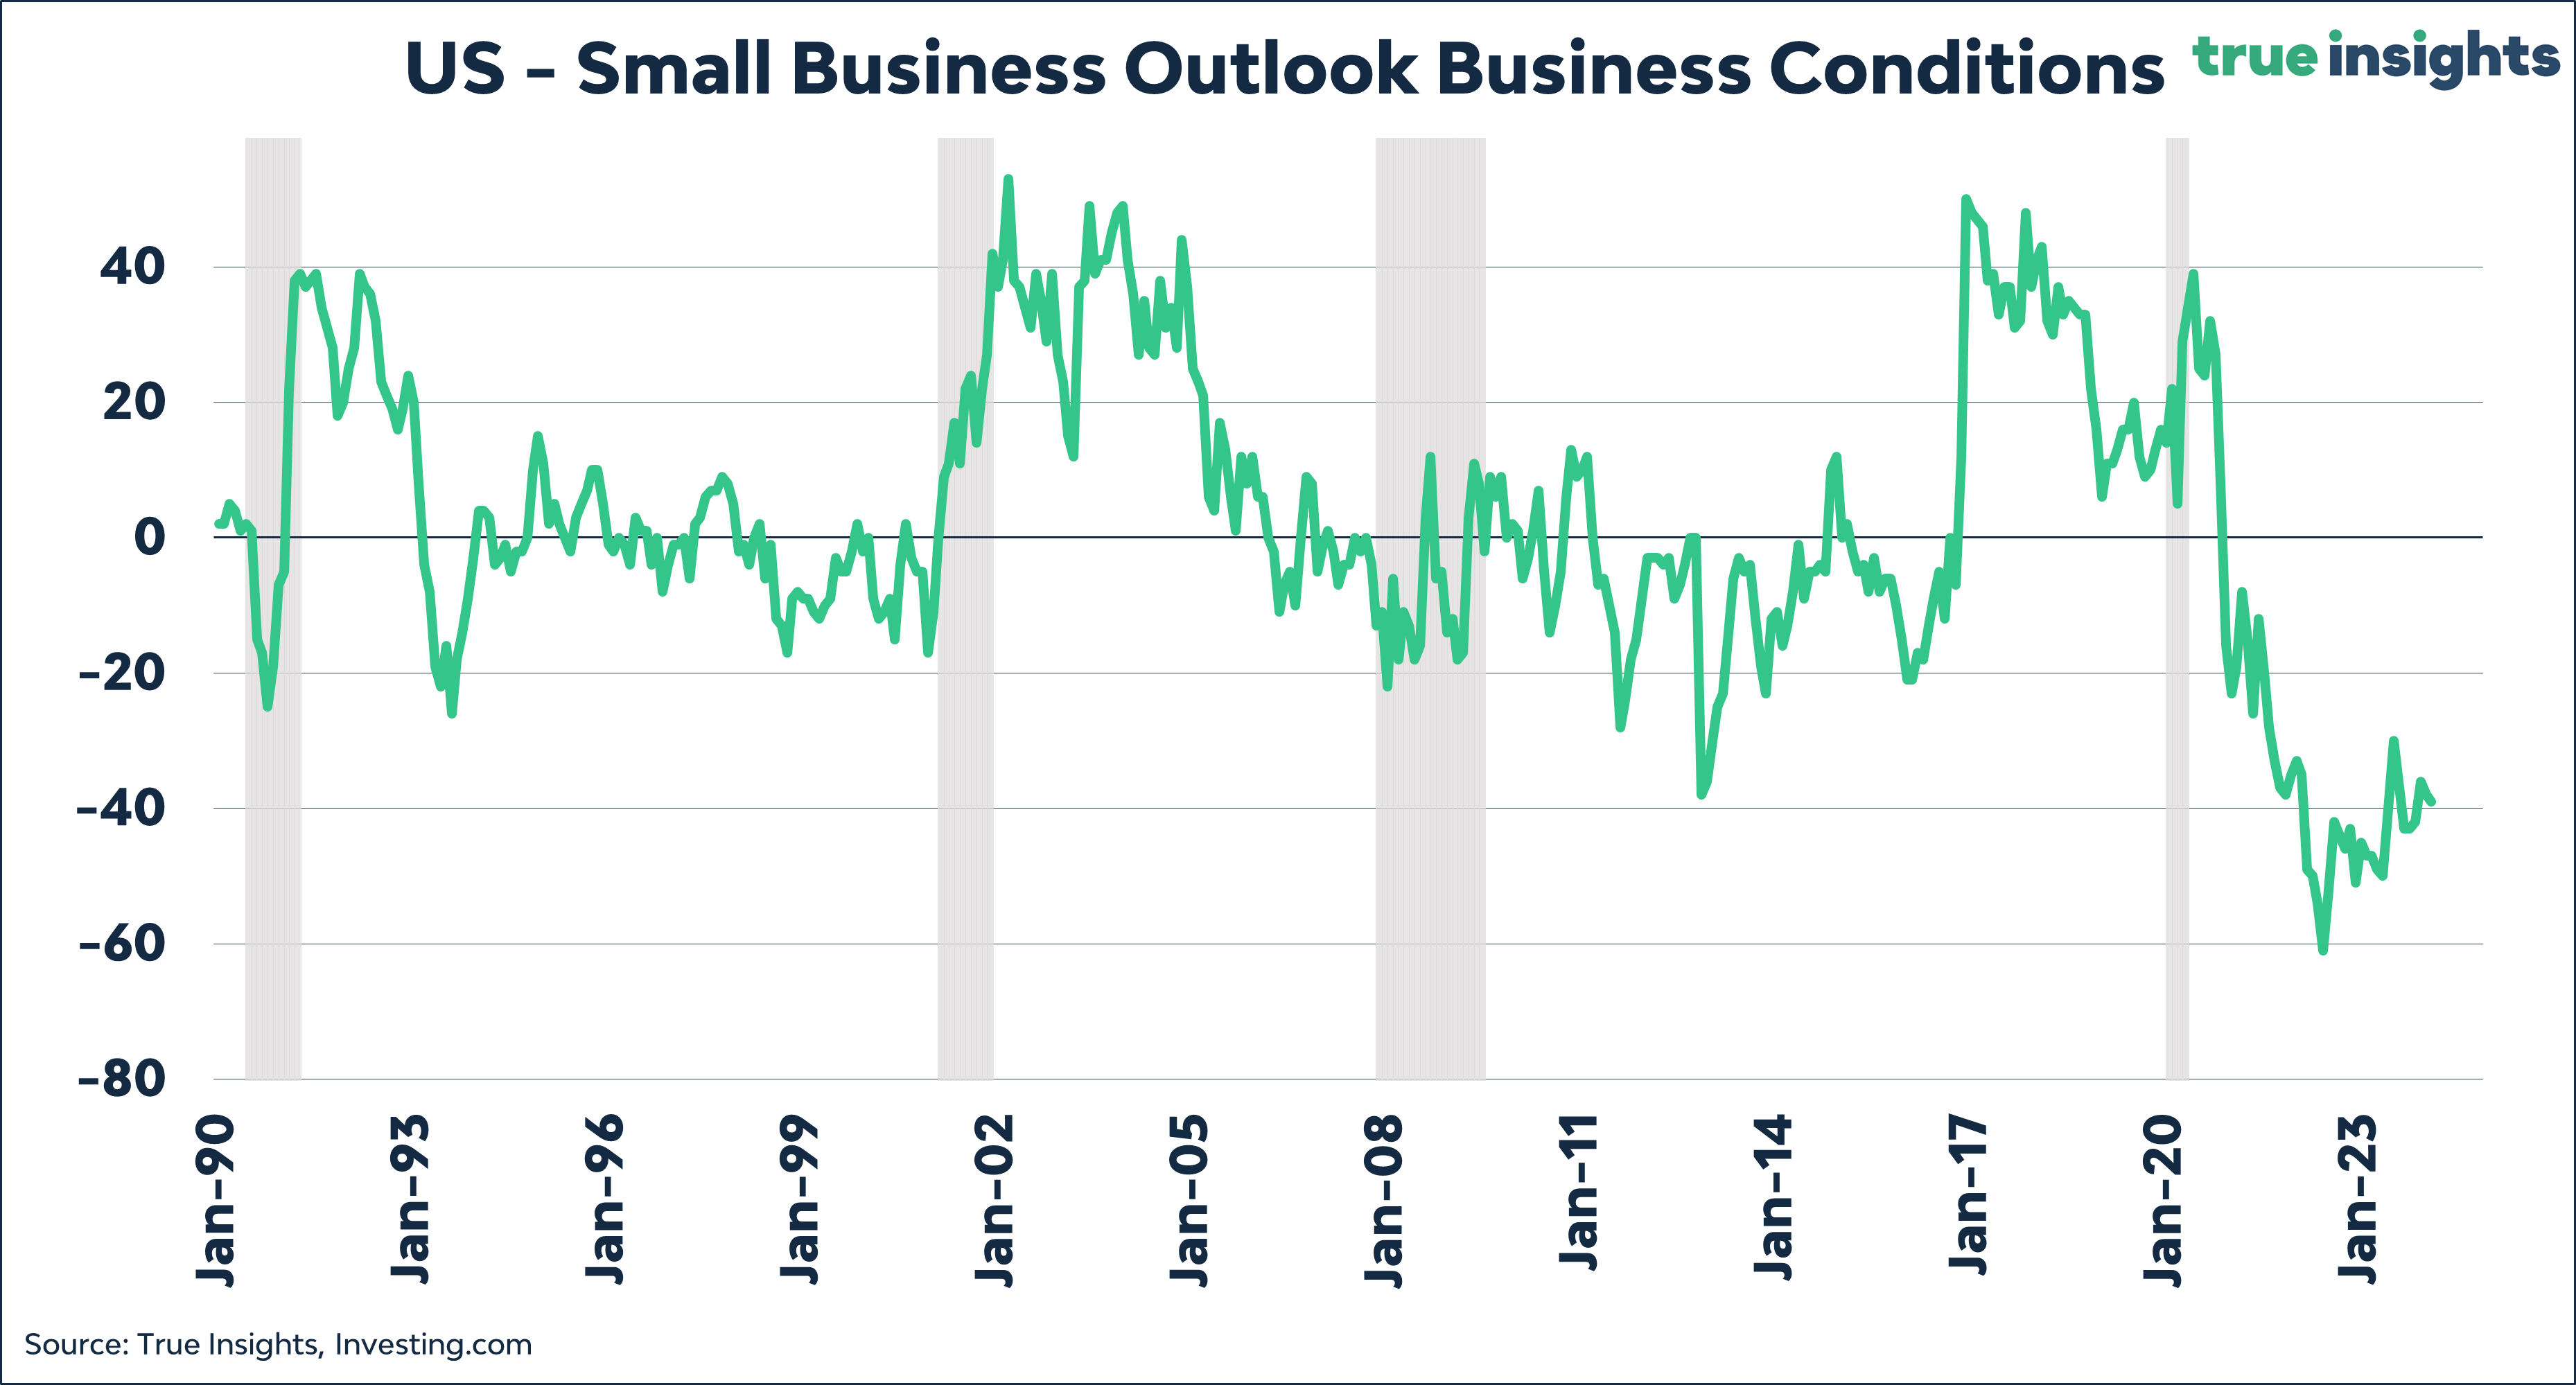
Small-cap optimism is going nowhere. US small businesses are downbeat about business conditions, earnings, and sales. If you were wondering why small caps are underperforming.
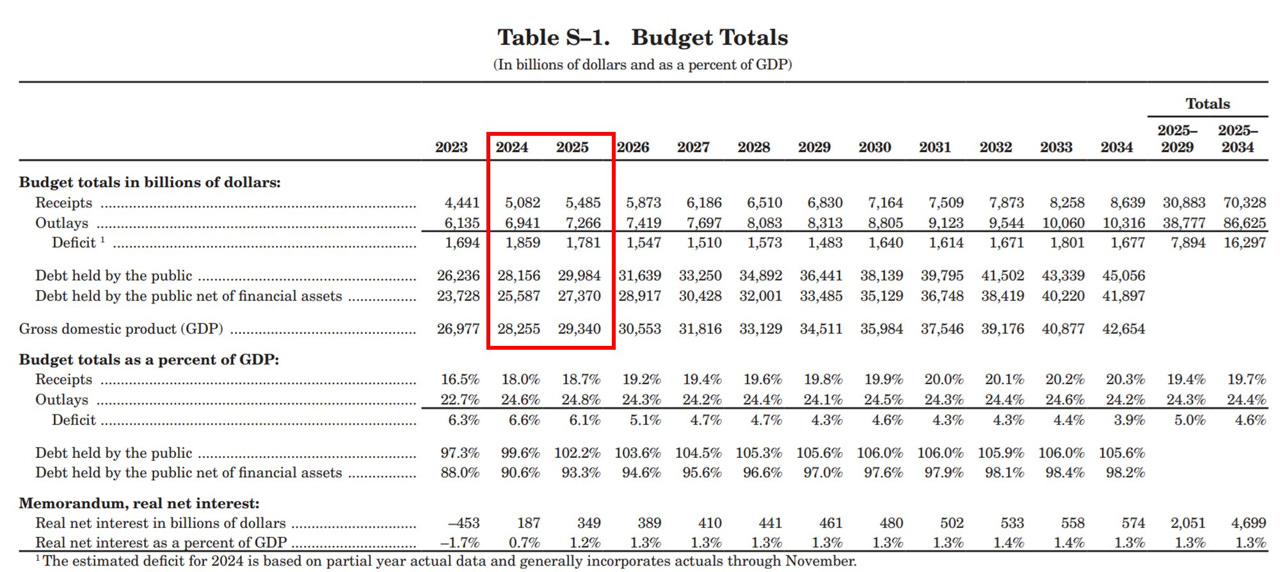
Another USD 7.1 trillion in US government outlays and a 6% budget deficit to come with it. Imaging!
China’s real estate recession is far from over, and the list of casualties is getting longer.
Will the Bank of Japan finally remove its long-lasting negative interest rate policy? Wage growth says ‘yes.’
Market concentration is NOT a bad thing. Market concentration is NOT a bad thing. Market concentration is …
Investments highlighted: Russell 2000, Big Tech, S&P 500 Index, Chinese equities, Nikkei 225 index, Japanese yen, USD, CHF, EUR,
First things first – Gold should be in every investment portfolio!

Here I explain why!
MACRO
Chart storm
This week, I bring you a ‘mini chart storm’ focusing on the dynamics of income and spending in the US. US retail sales increased by 0.6% in February, falling short of expectations by 0.3 percentage points. To compound matters, the figure for January was revised downward from -0.8% to -1.1%, marking the worst month since March of the previous year.

This lackluster start to 2024 has led me to adjust the arrow’s trajectory for real retail sales downwards.

Furthermore, the year-over-year figures are nothing to get too excited about, a sentiment that applies equally to both nominal and real retail sales.

The chart below concludes with the 3-month annualized rate for the retail sales Control Group, which excludes volatile components Food Services, Auto Dealers & Build Materials, and Gas Stations, showing a 0.2% decline in retail sales.
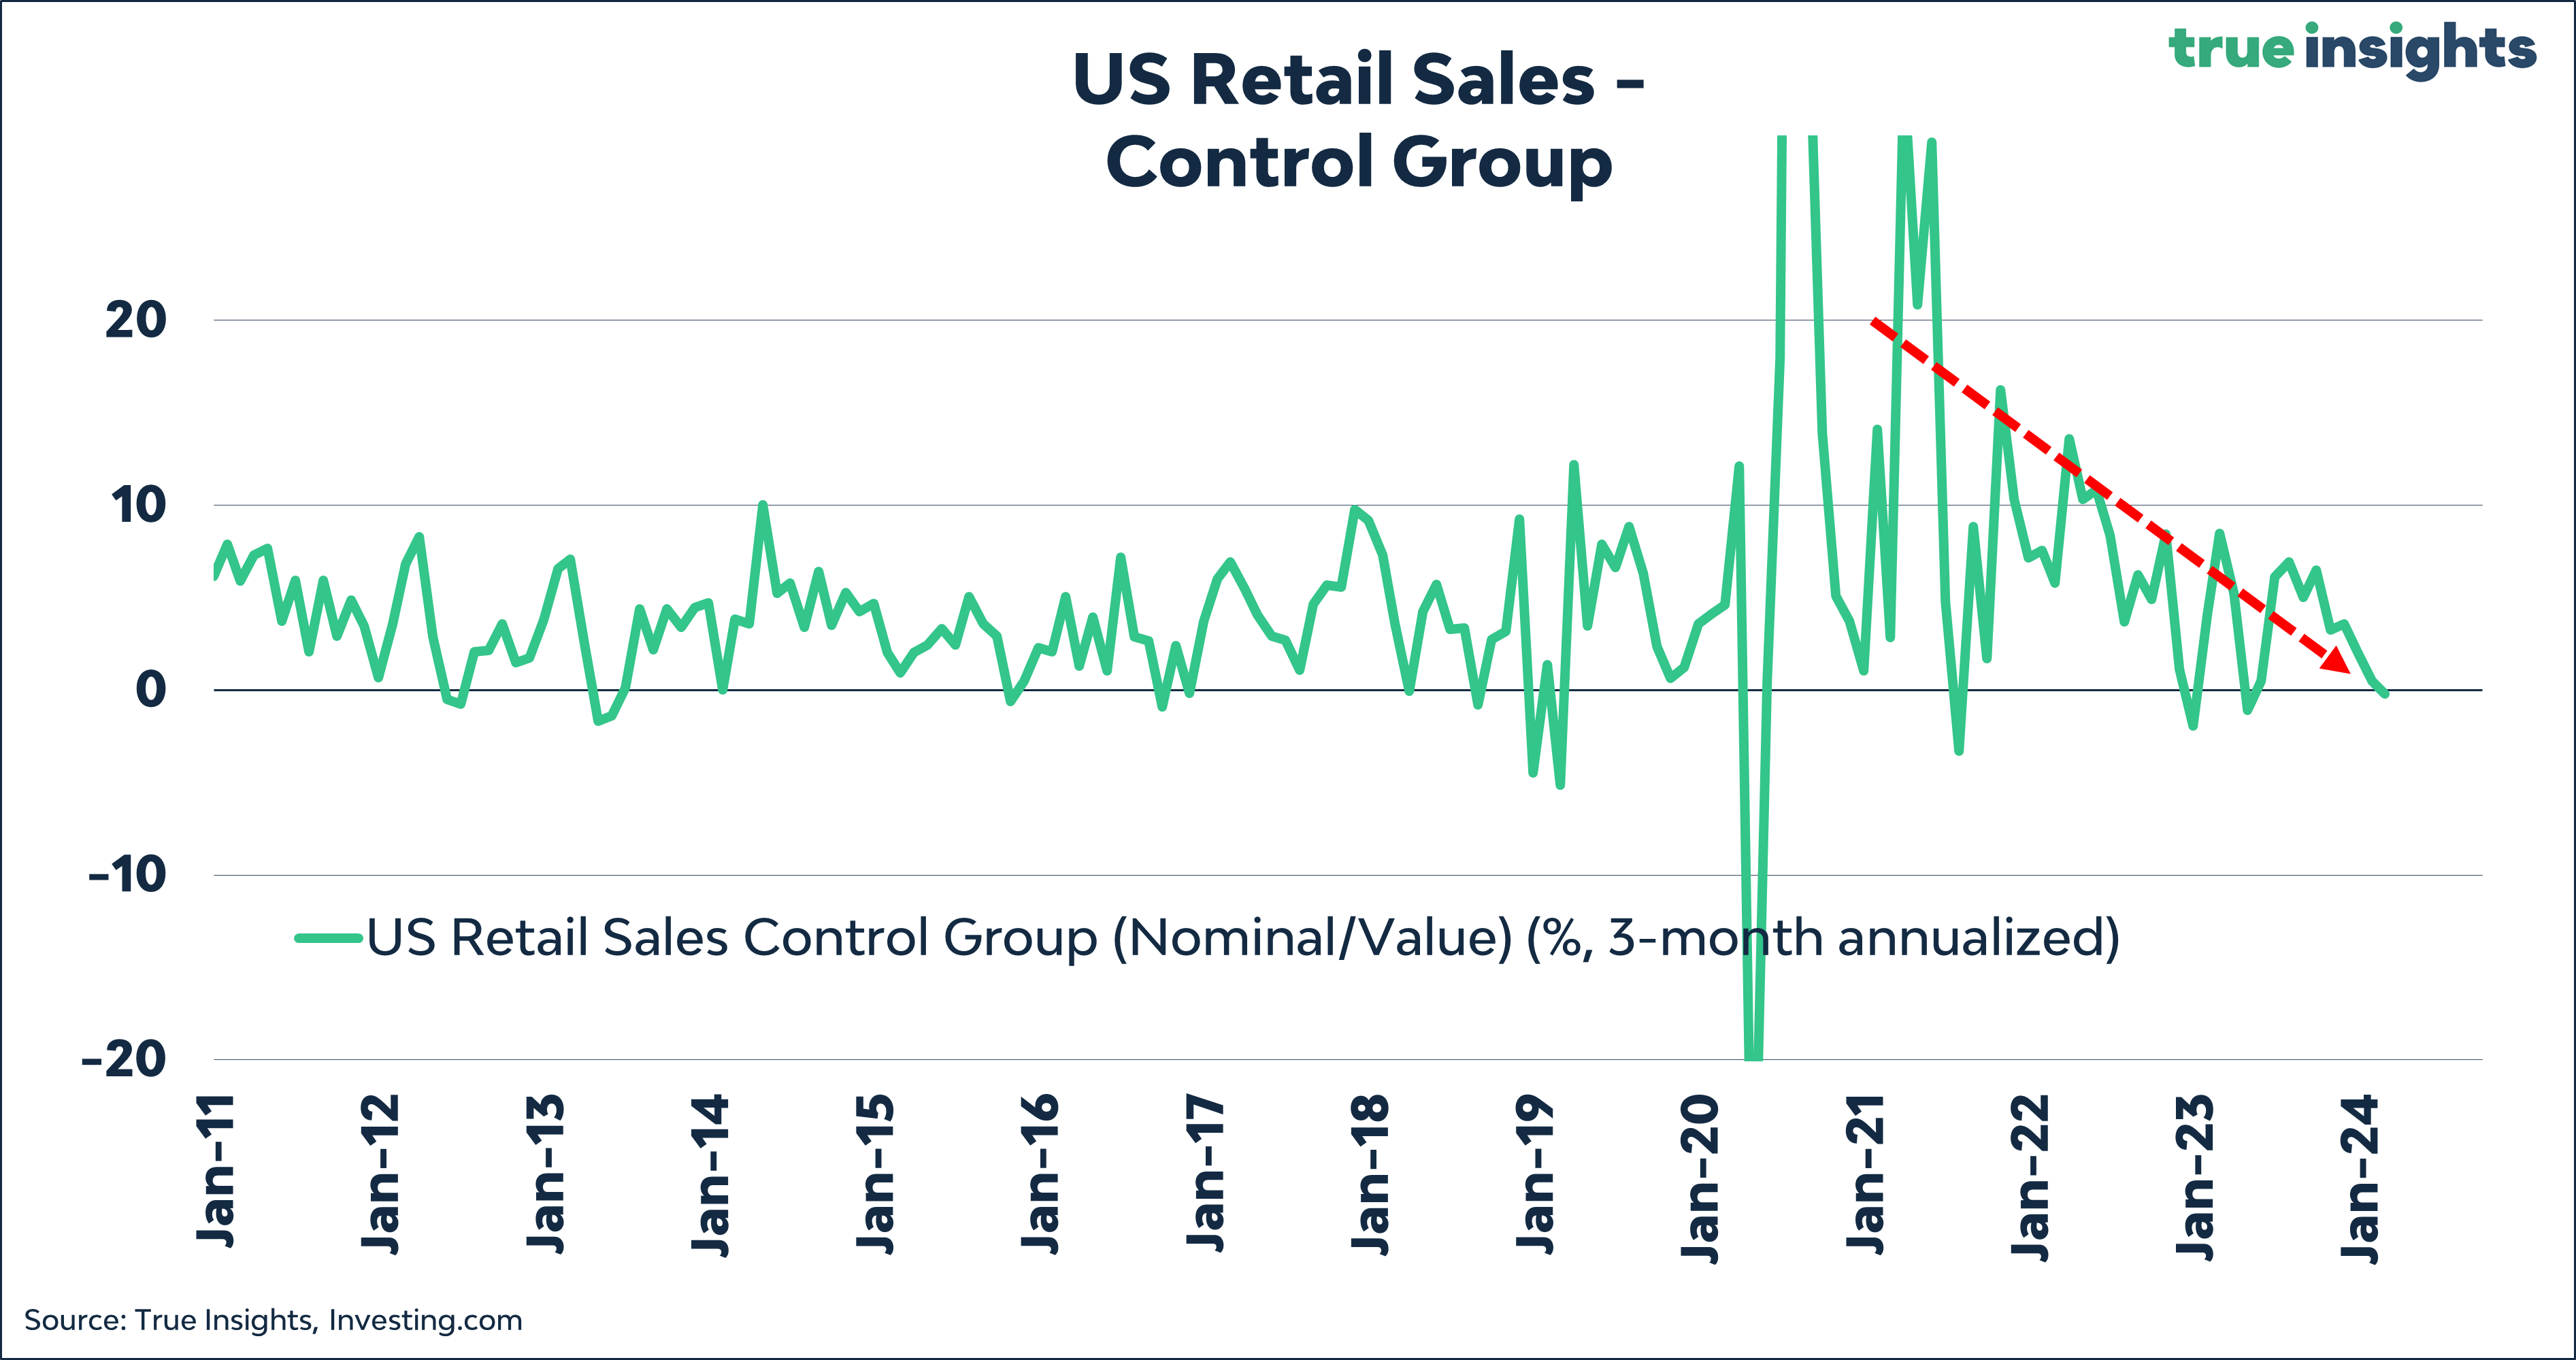
Interestingly, we’ve seen twice in 2023 where the control group retail sales briefly dipped below zero, only to rebound shortly after. The question now is, will this time be different?

A key distinction from last year is that excess savings have been completely exhausted. Spending money freely received from the US government feels somewhat more liberating than dipping into one’s ‘normal’ savings.

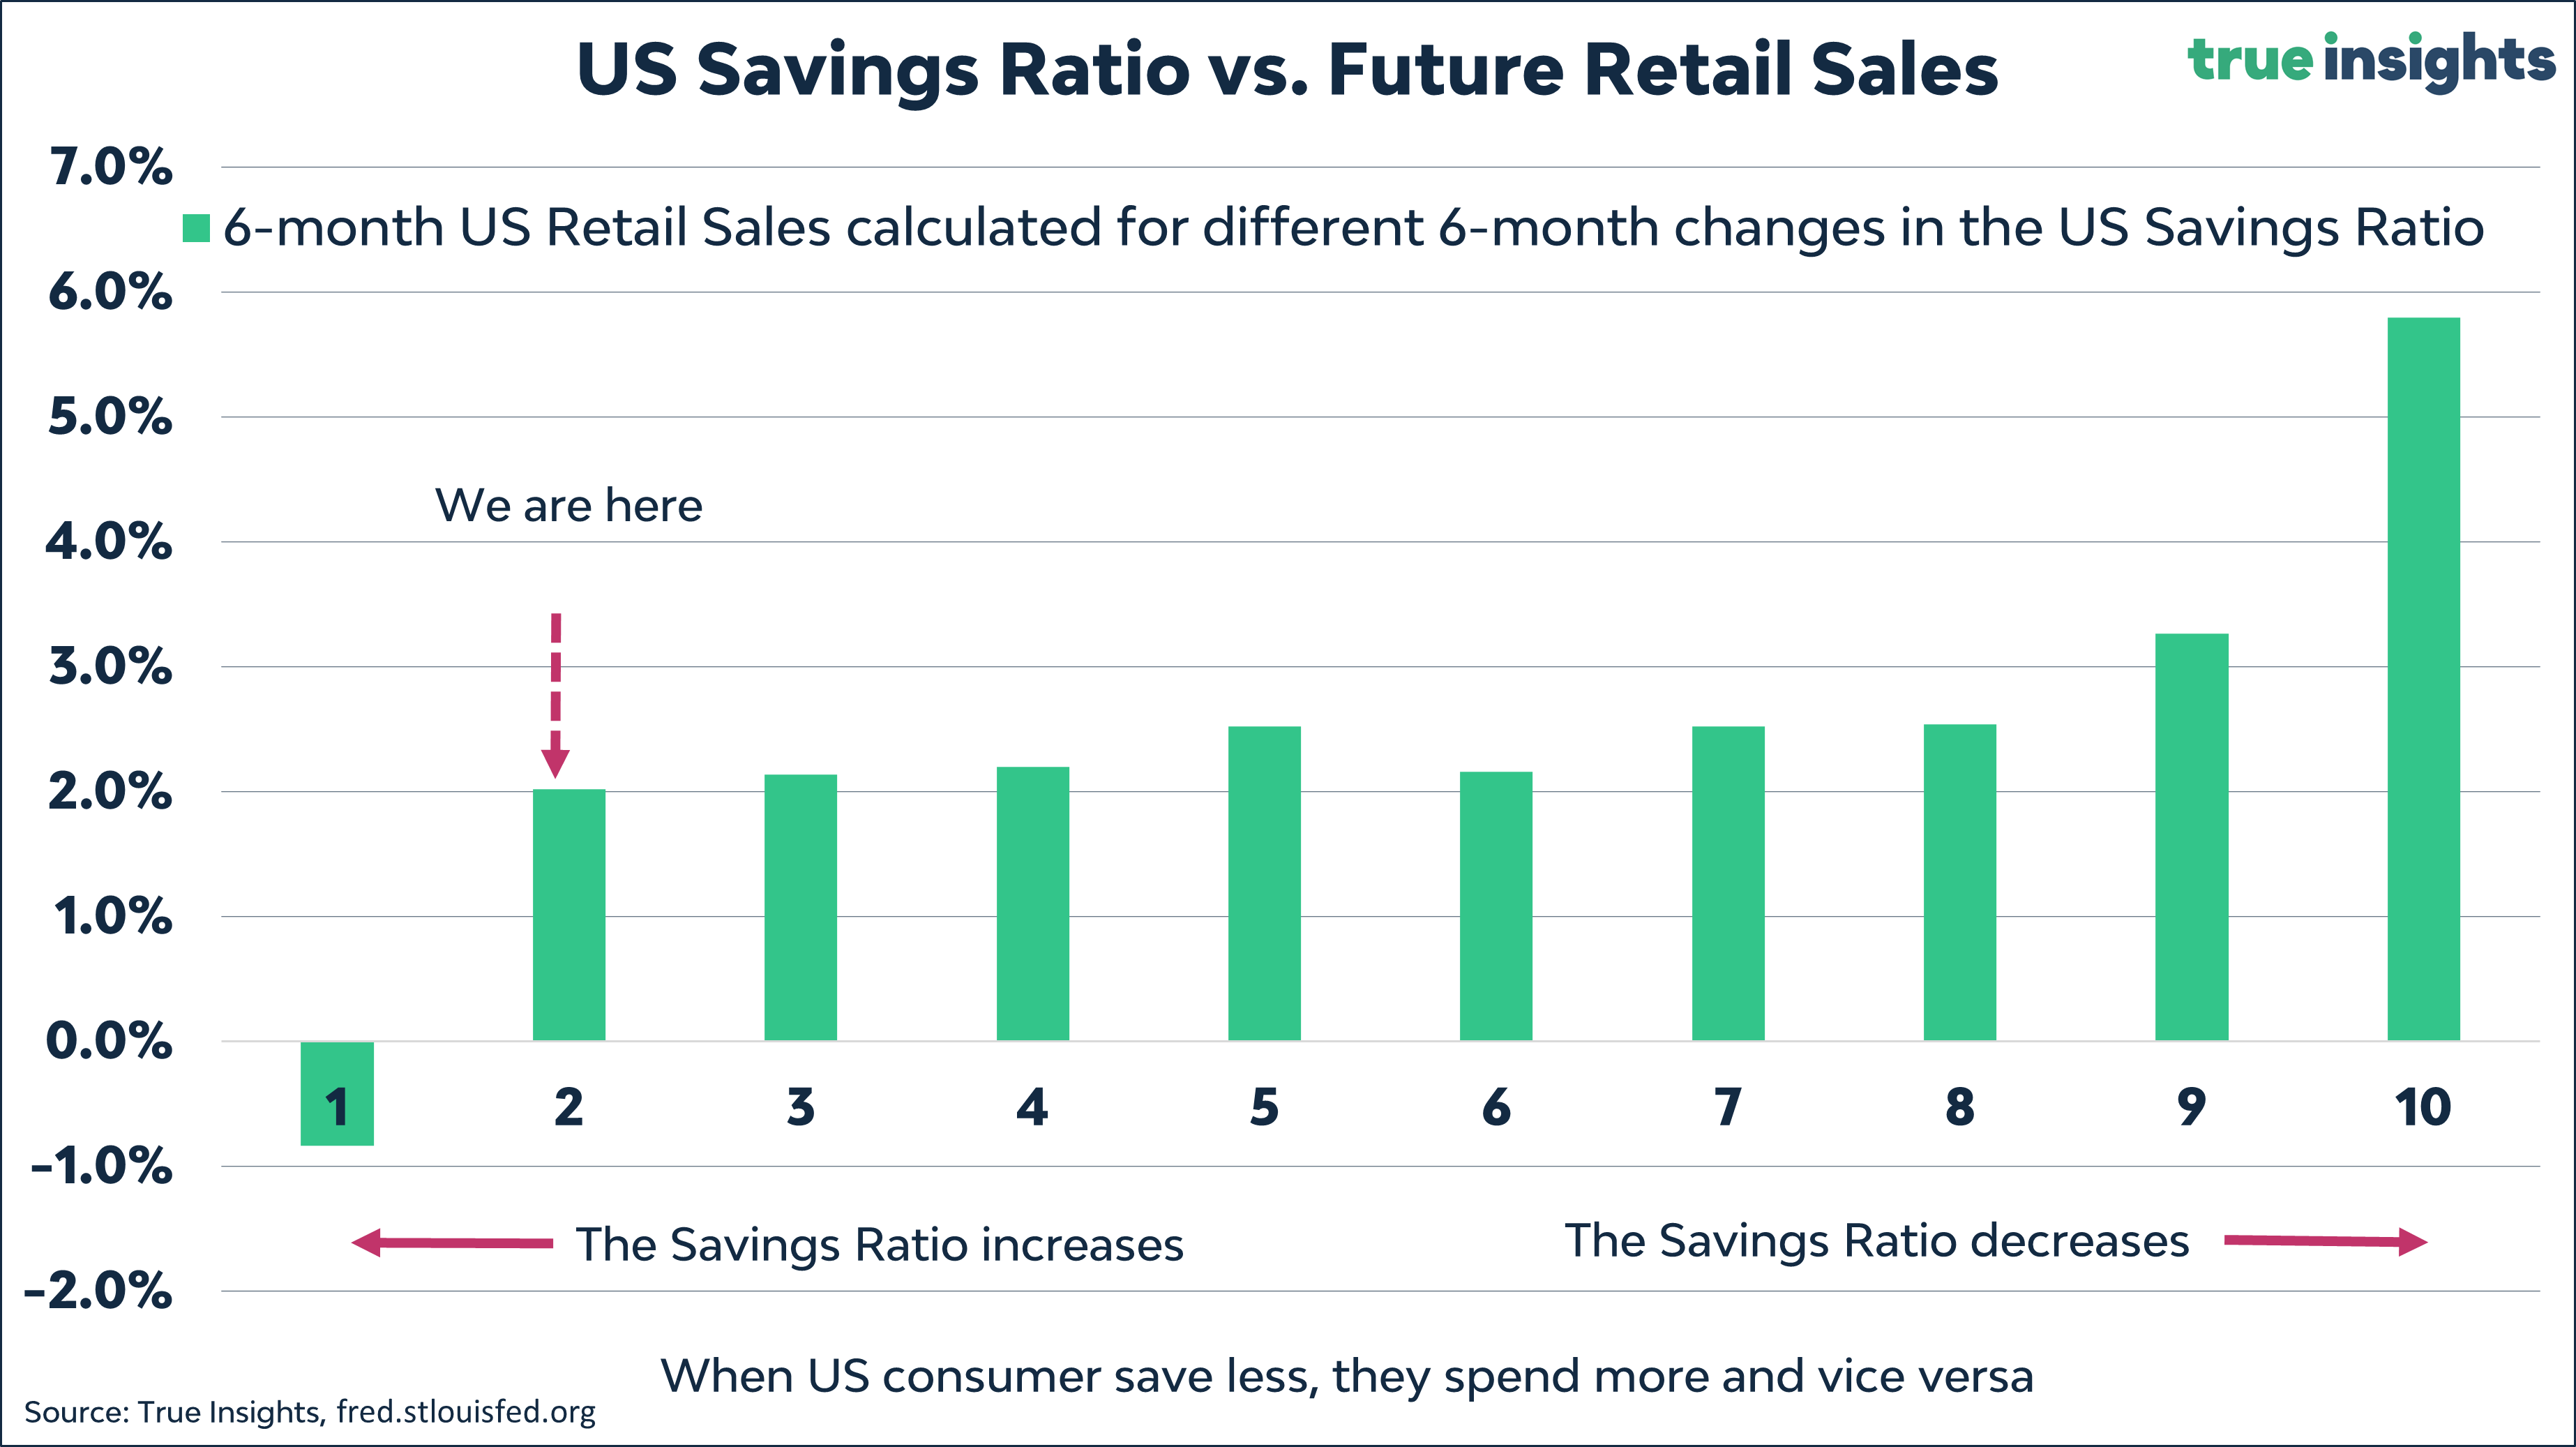
Moreover, with the savings rate lingering at an exceptionally low 3.8%, it’s no surprise that low savings ratios correlate with subdued future retail sales. With the depletion of excess savings and the low regular savings ratio, consumers must rely on traditional income for purchasing power.
Despite indicators like the quits ratio pointing towards a deceleration in wage growth, the pace of income growth remains robust.

One of the pivotal charts depicting real personal income, excluding government transfers—an indicator used by the NBER to assess recessions—suggests an improvement in income growth. It almost seems as though the NBER overlooked calling a recession in 2022.

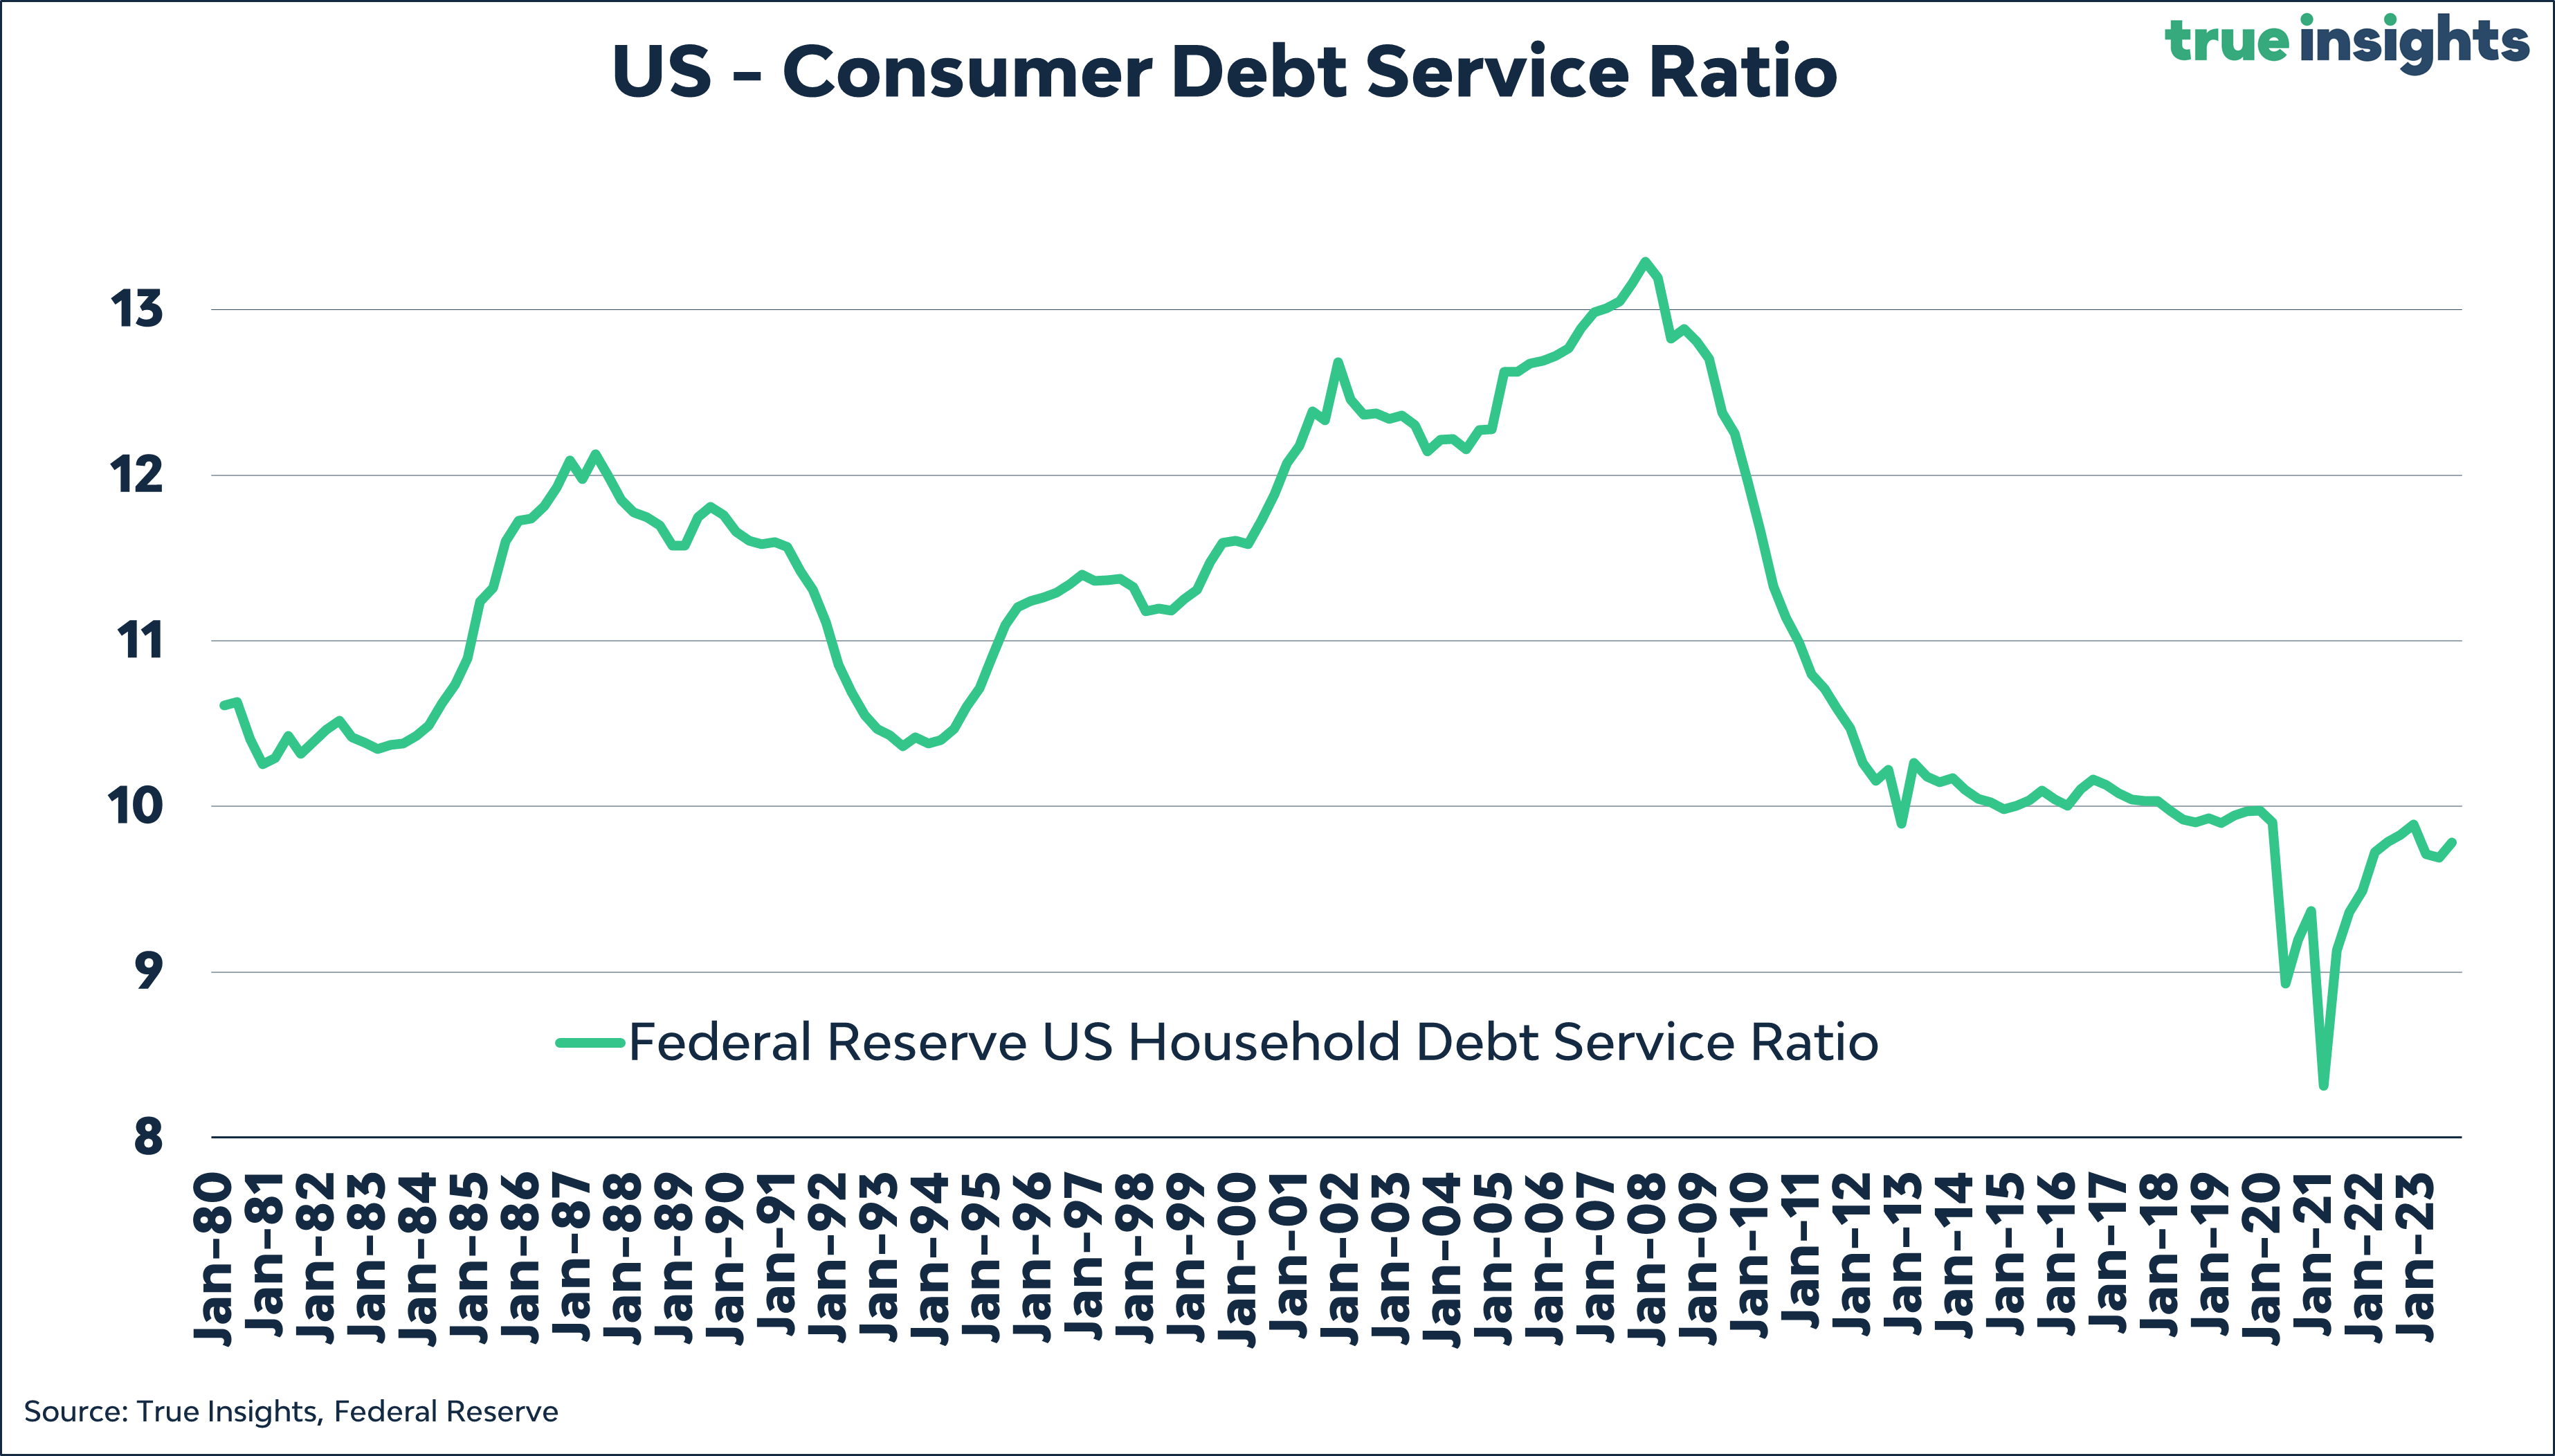
Additionally, two factors will likely keep US consumers from abruptly halting their spending. First, debt servicing costs remain relatively low despite soaring interest rates on credit cards, auto, and personal loans.
Second, often underestimated, household wealth has surged significantly in the past year and into early 2024, bolstering US consumers’ propensity to spend due to perceived wealth increases.

I suspect not every American diligently declares their Bitcoin and crypto assets, with paper wealth fostering confidence in spending. I don’t foresee consumer spending leading to a recession unless the US labor market collapses from this point onwards. However, the era of excessive growth has ended, opening the door to a continuation of the Goldilocks scenario.
Inflation, Why Won’t You Cooperate!
The ideal completion of the Goldilocks scenario hinges on inflation receding towards the Fed’s target, enabling Powell & Co. to initiate interest rate cuts.

However, inflation has been less than cooperative. Earlier in the week, consumer prices exceeded expectations, with underlying data indicating significant ‘stickiness.’ It marked the second consecutive month where I had to insert that fear-crying ‘smiley’ in the chart. More details on the latest CPI figures can be found here.
While the initial reaction in the stock and bond markets on Tuesday was relatively subdued, investors were less pleased with the higher-than-expected producer prices announced on Thursday.

However, the PPI figure alone doesn’t necessarily incite inflation panic. After two months of disappointments, investors are likely forced to scale back some of their optimism regarding the Fed’s potential rate cuts and the return to target inflation levels.
Small Cap Blues!
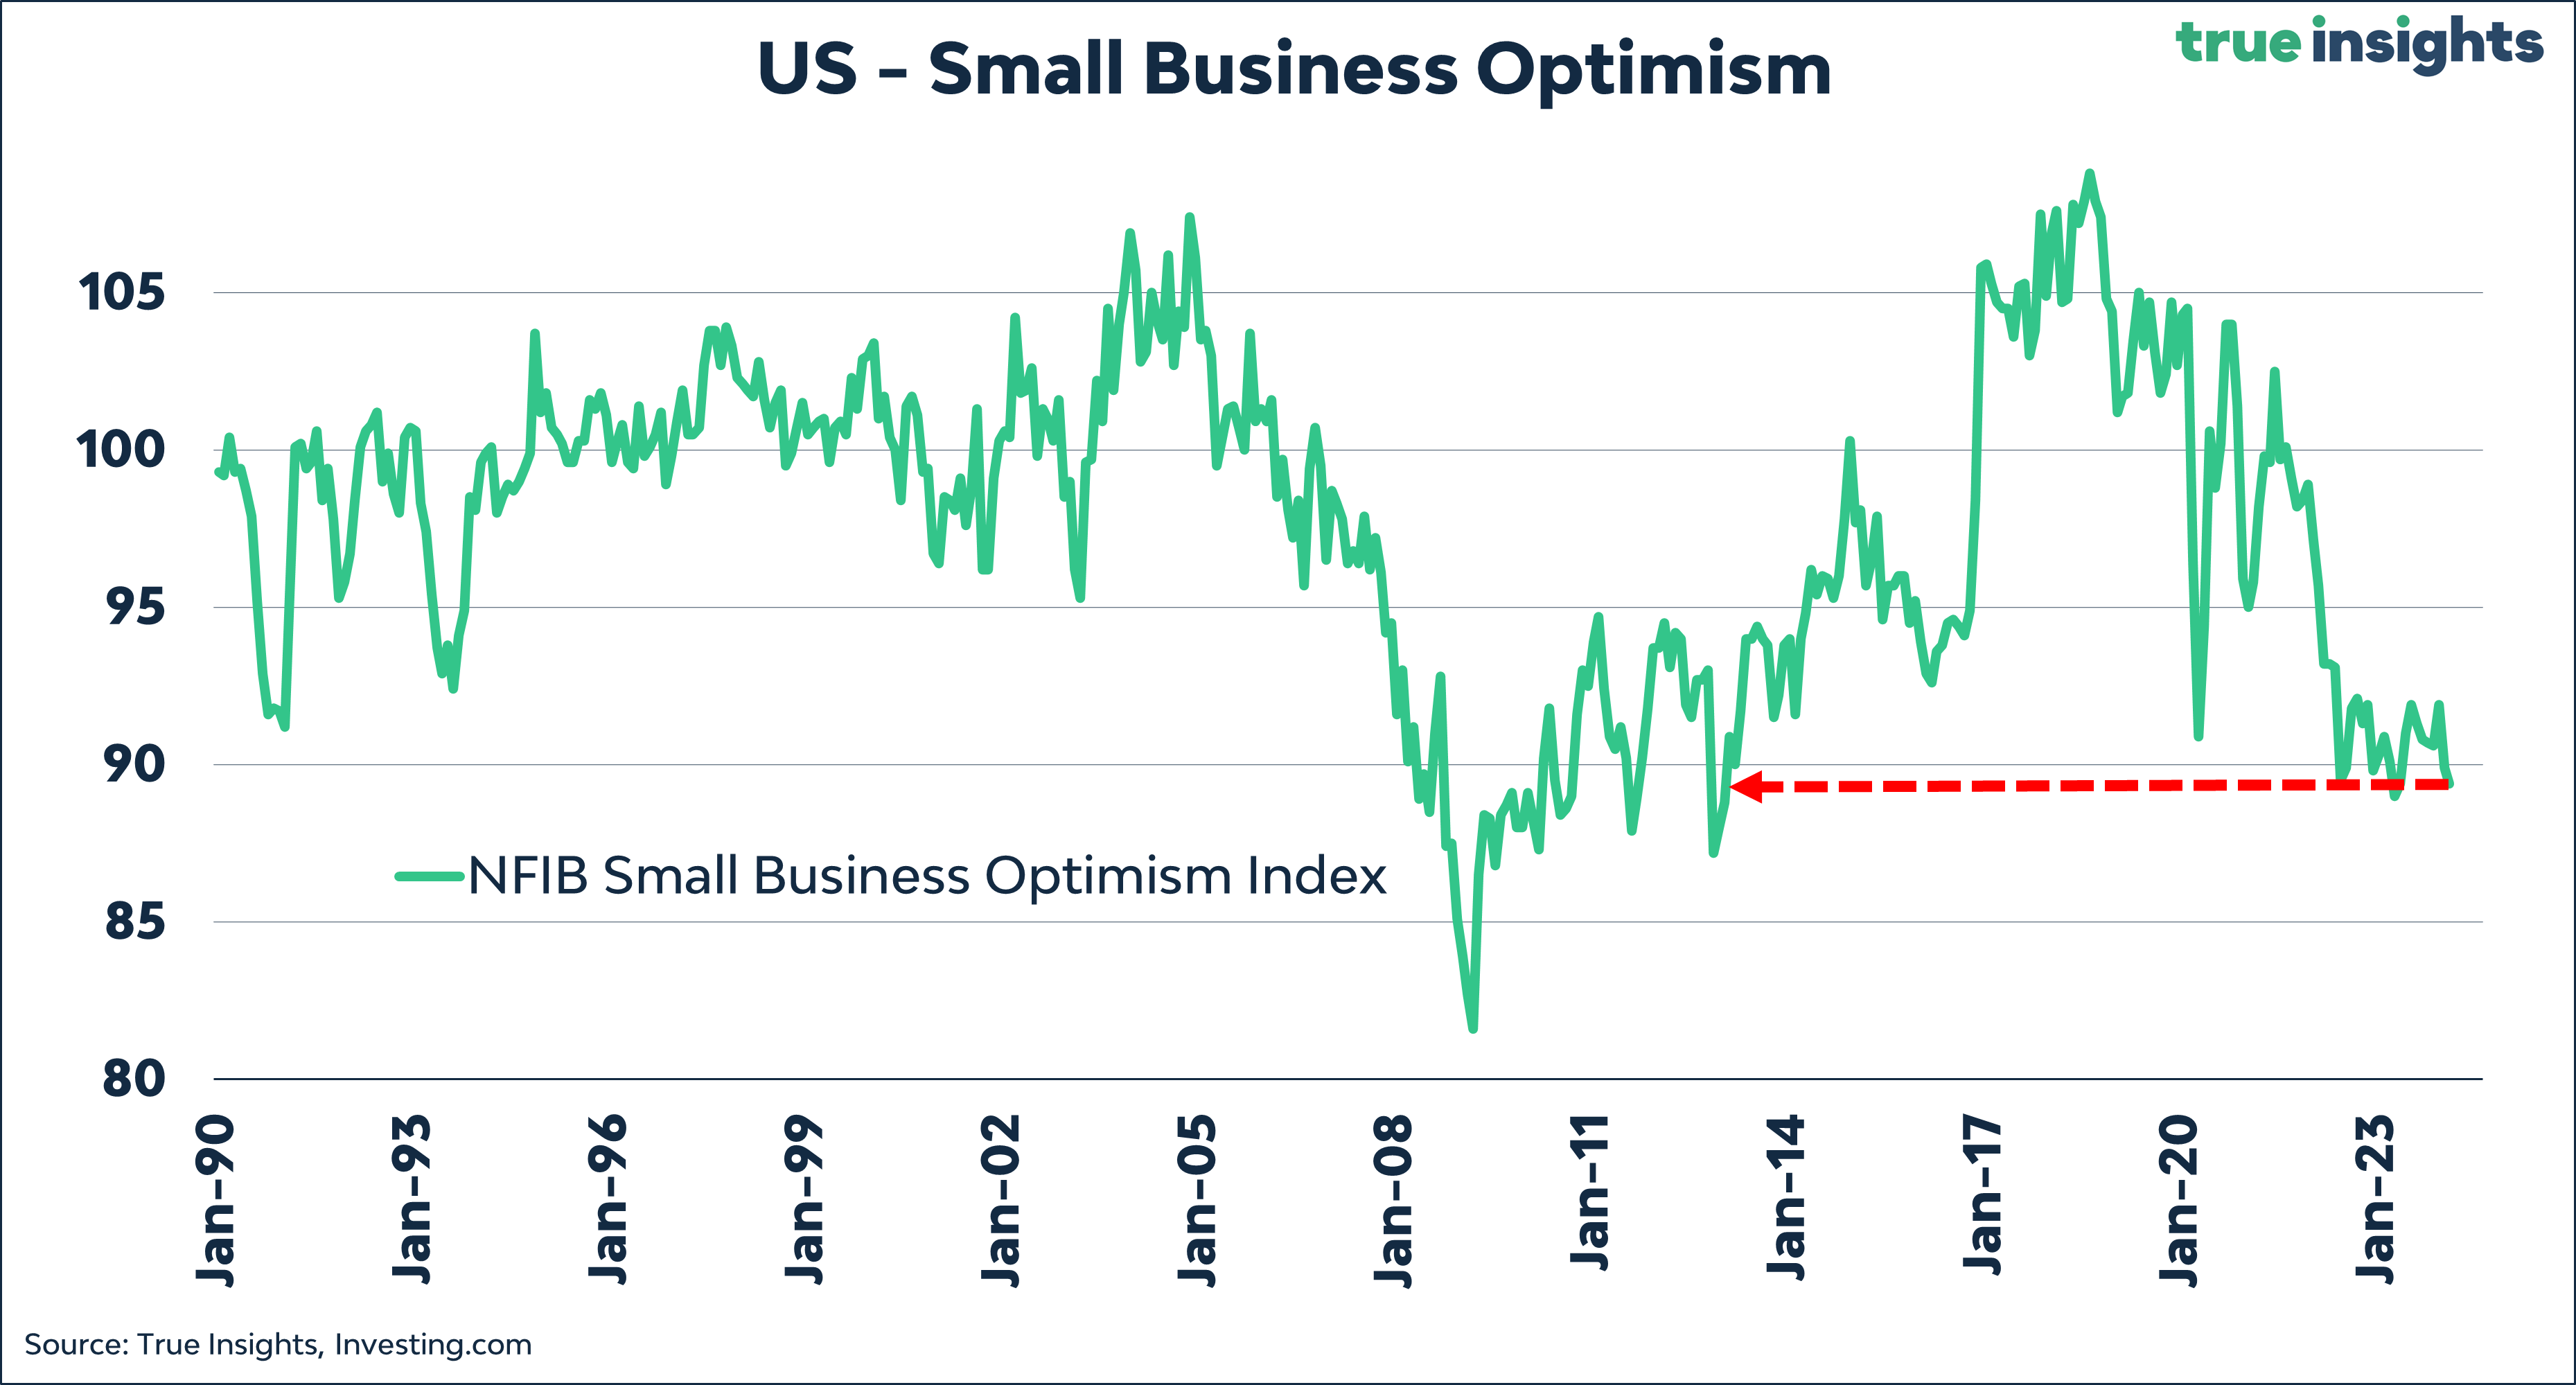
As I’ve mentioned before, the likelihood of a recession shouldn’t be dismissed just yet. This week, the NFIB Small Business Optimism Index provided further evidence, dropping to its second-lowest level in 11 years in February.
US small businesses are discontent with the general business conditions…
sales developments, …

and profit trends.

The NFIB survey also illuminates the US labor market, mirroring the concerns mentioned above. While it’s becoming easier for small businesses to find workers, the labor market remains tight.

Wage growth is decelerating but is still above average.

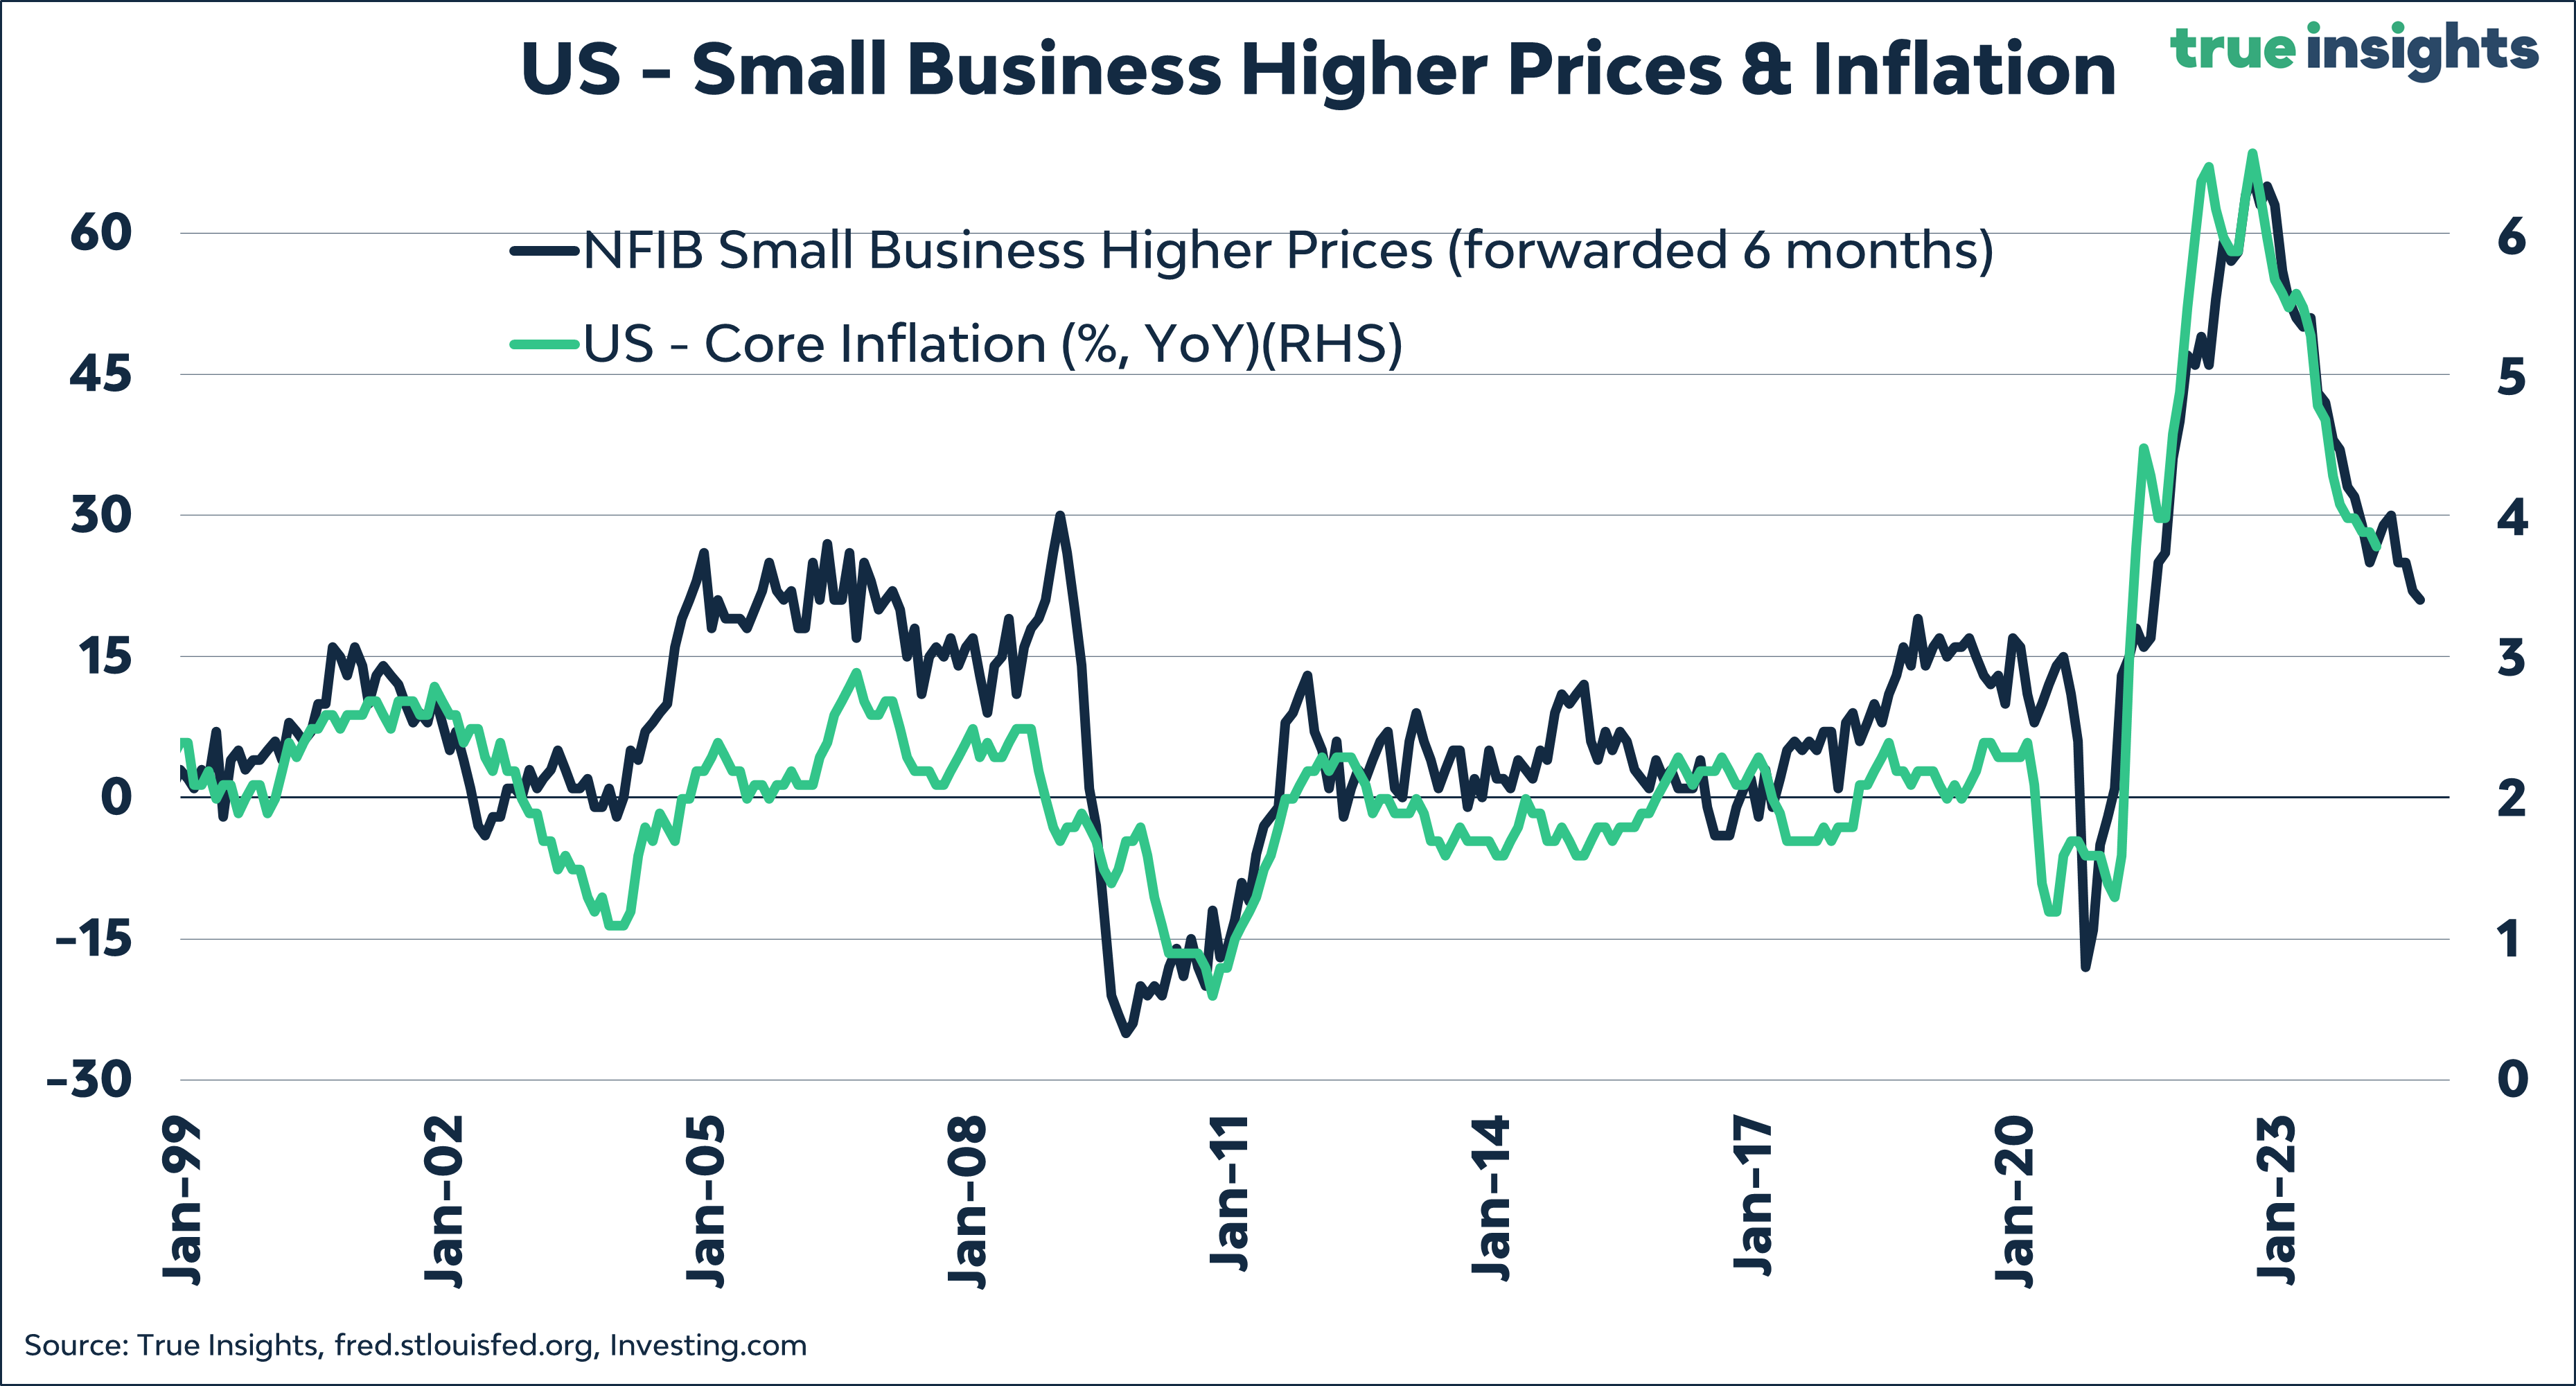
On a slightly positive note, small businesses are experiencing diminishing price pressures, hinting at a continued decline in core inflation and providing Powell with more flexibility to reduce rates.
Happy Election Year!
It’s an election year in the United States, and candidates are keen to showcase their best sides. This week, Biden unveiled his fiscal budget for 2025, proposing $7.1 trillion in spending, leading to yet another year of a budget deficit exceeding 6%. This projection assumes nearly 4% nominal growth.
The US Congressional Budget Office (CBO) has been clear about excessive spending being the culprit behind the US’s unsustainable fiscal trajectory.

Moreover, the CBO recently admitted to significantly underestimating expenditures for fiscal year 2023.
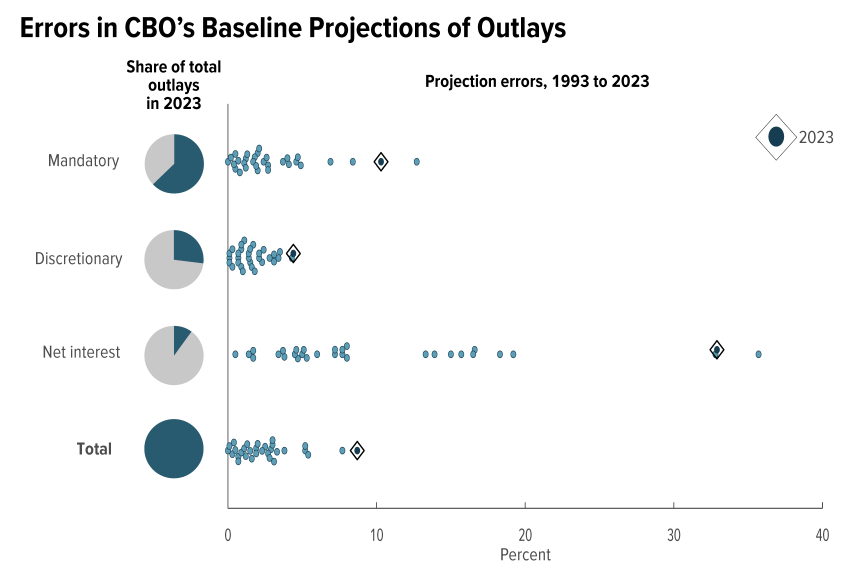
Expect the US debt-to-GDP ratio to climb even higher for the Treasury, especially if a recession is avoided.
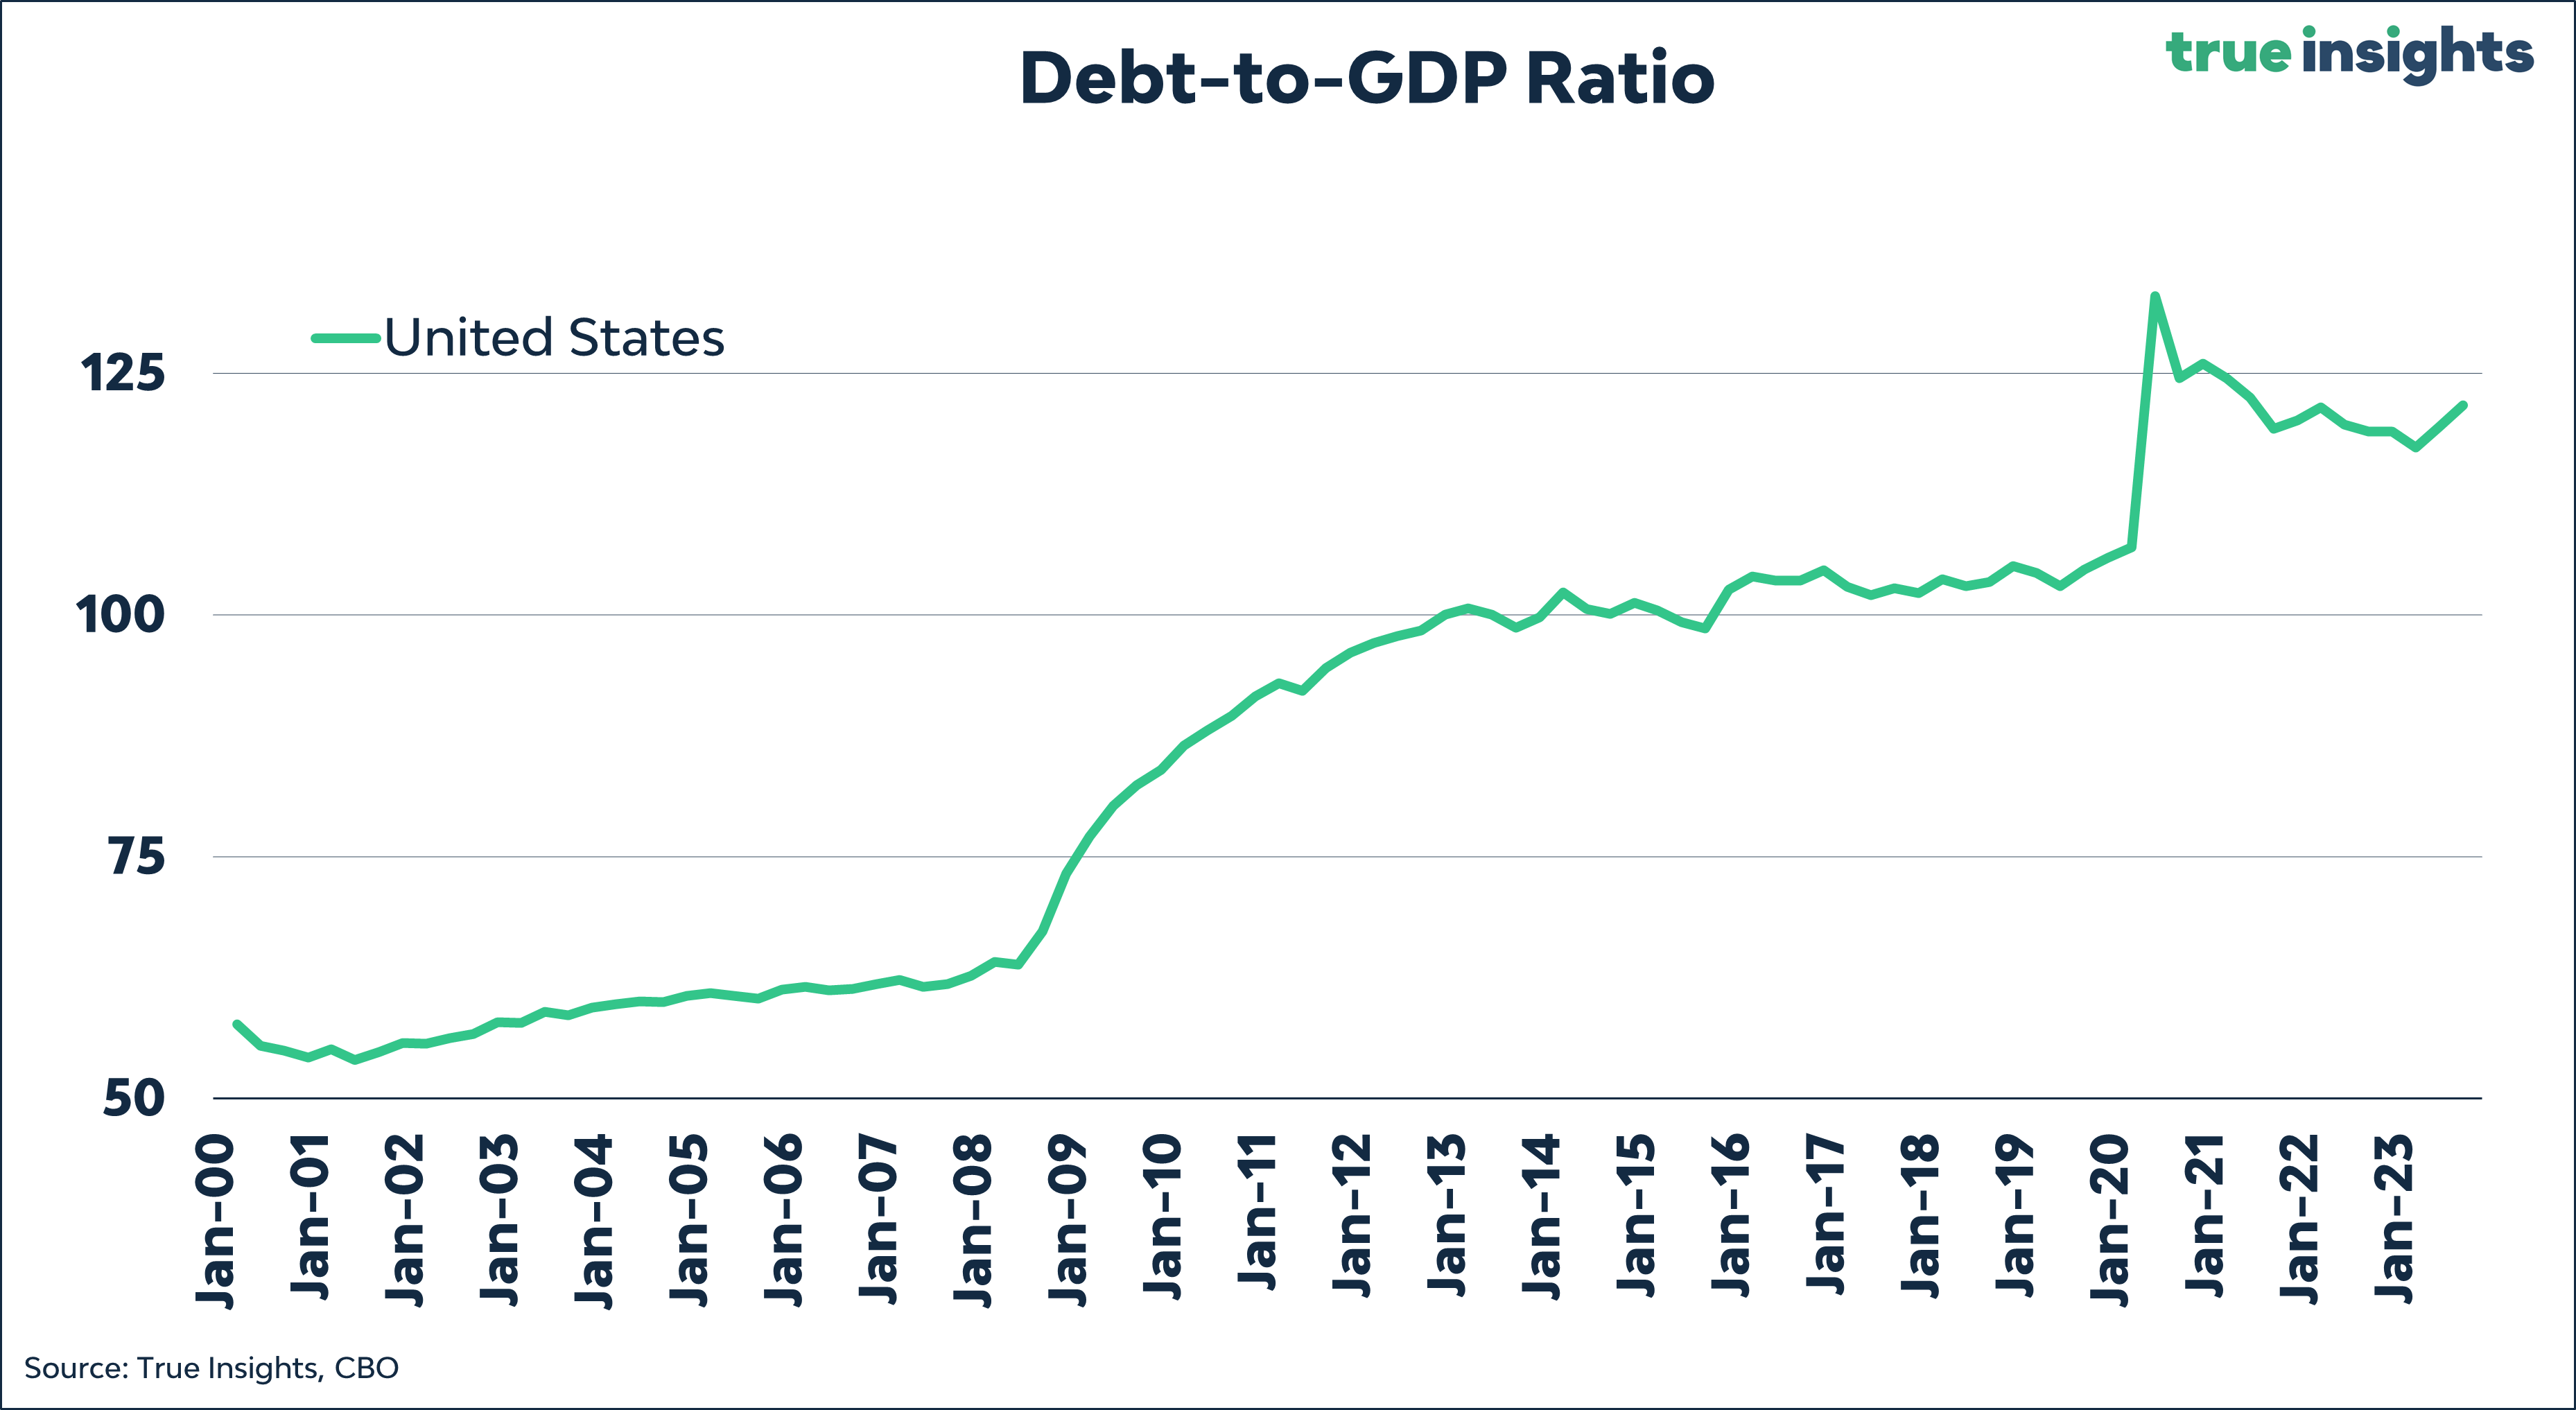
For those interested, like myself, in total debt-to-GDP ratios, the outlook isn’t any rosier.

However, focusing solely on total debt-to-GDP ratios isn’t sufficient; the disparity between government, corporate, and household debt levels is crucial.
China – New Year, Same Issues
China celebrated the New Year, the Year of the Dragon, with great fanfare, only to return to business as usual, which hasn’t improved since the turn of the year.

Chinese housing prices have continued to plummet, with 28 of the past 31 months (over 2.5 years) witnessing declines. This trend hardly uplifts Chinese consumers.
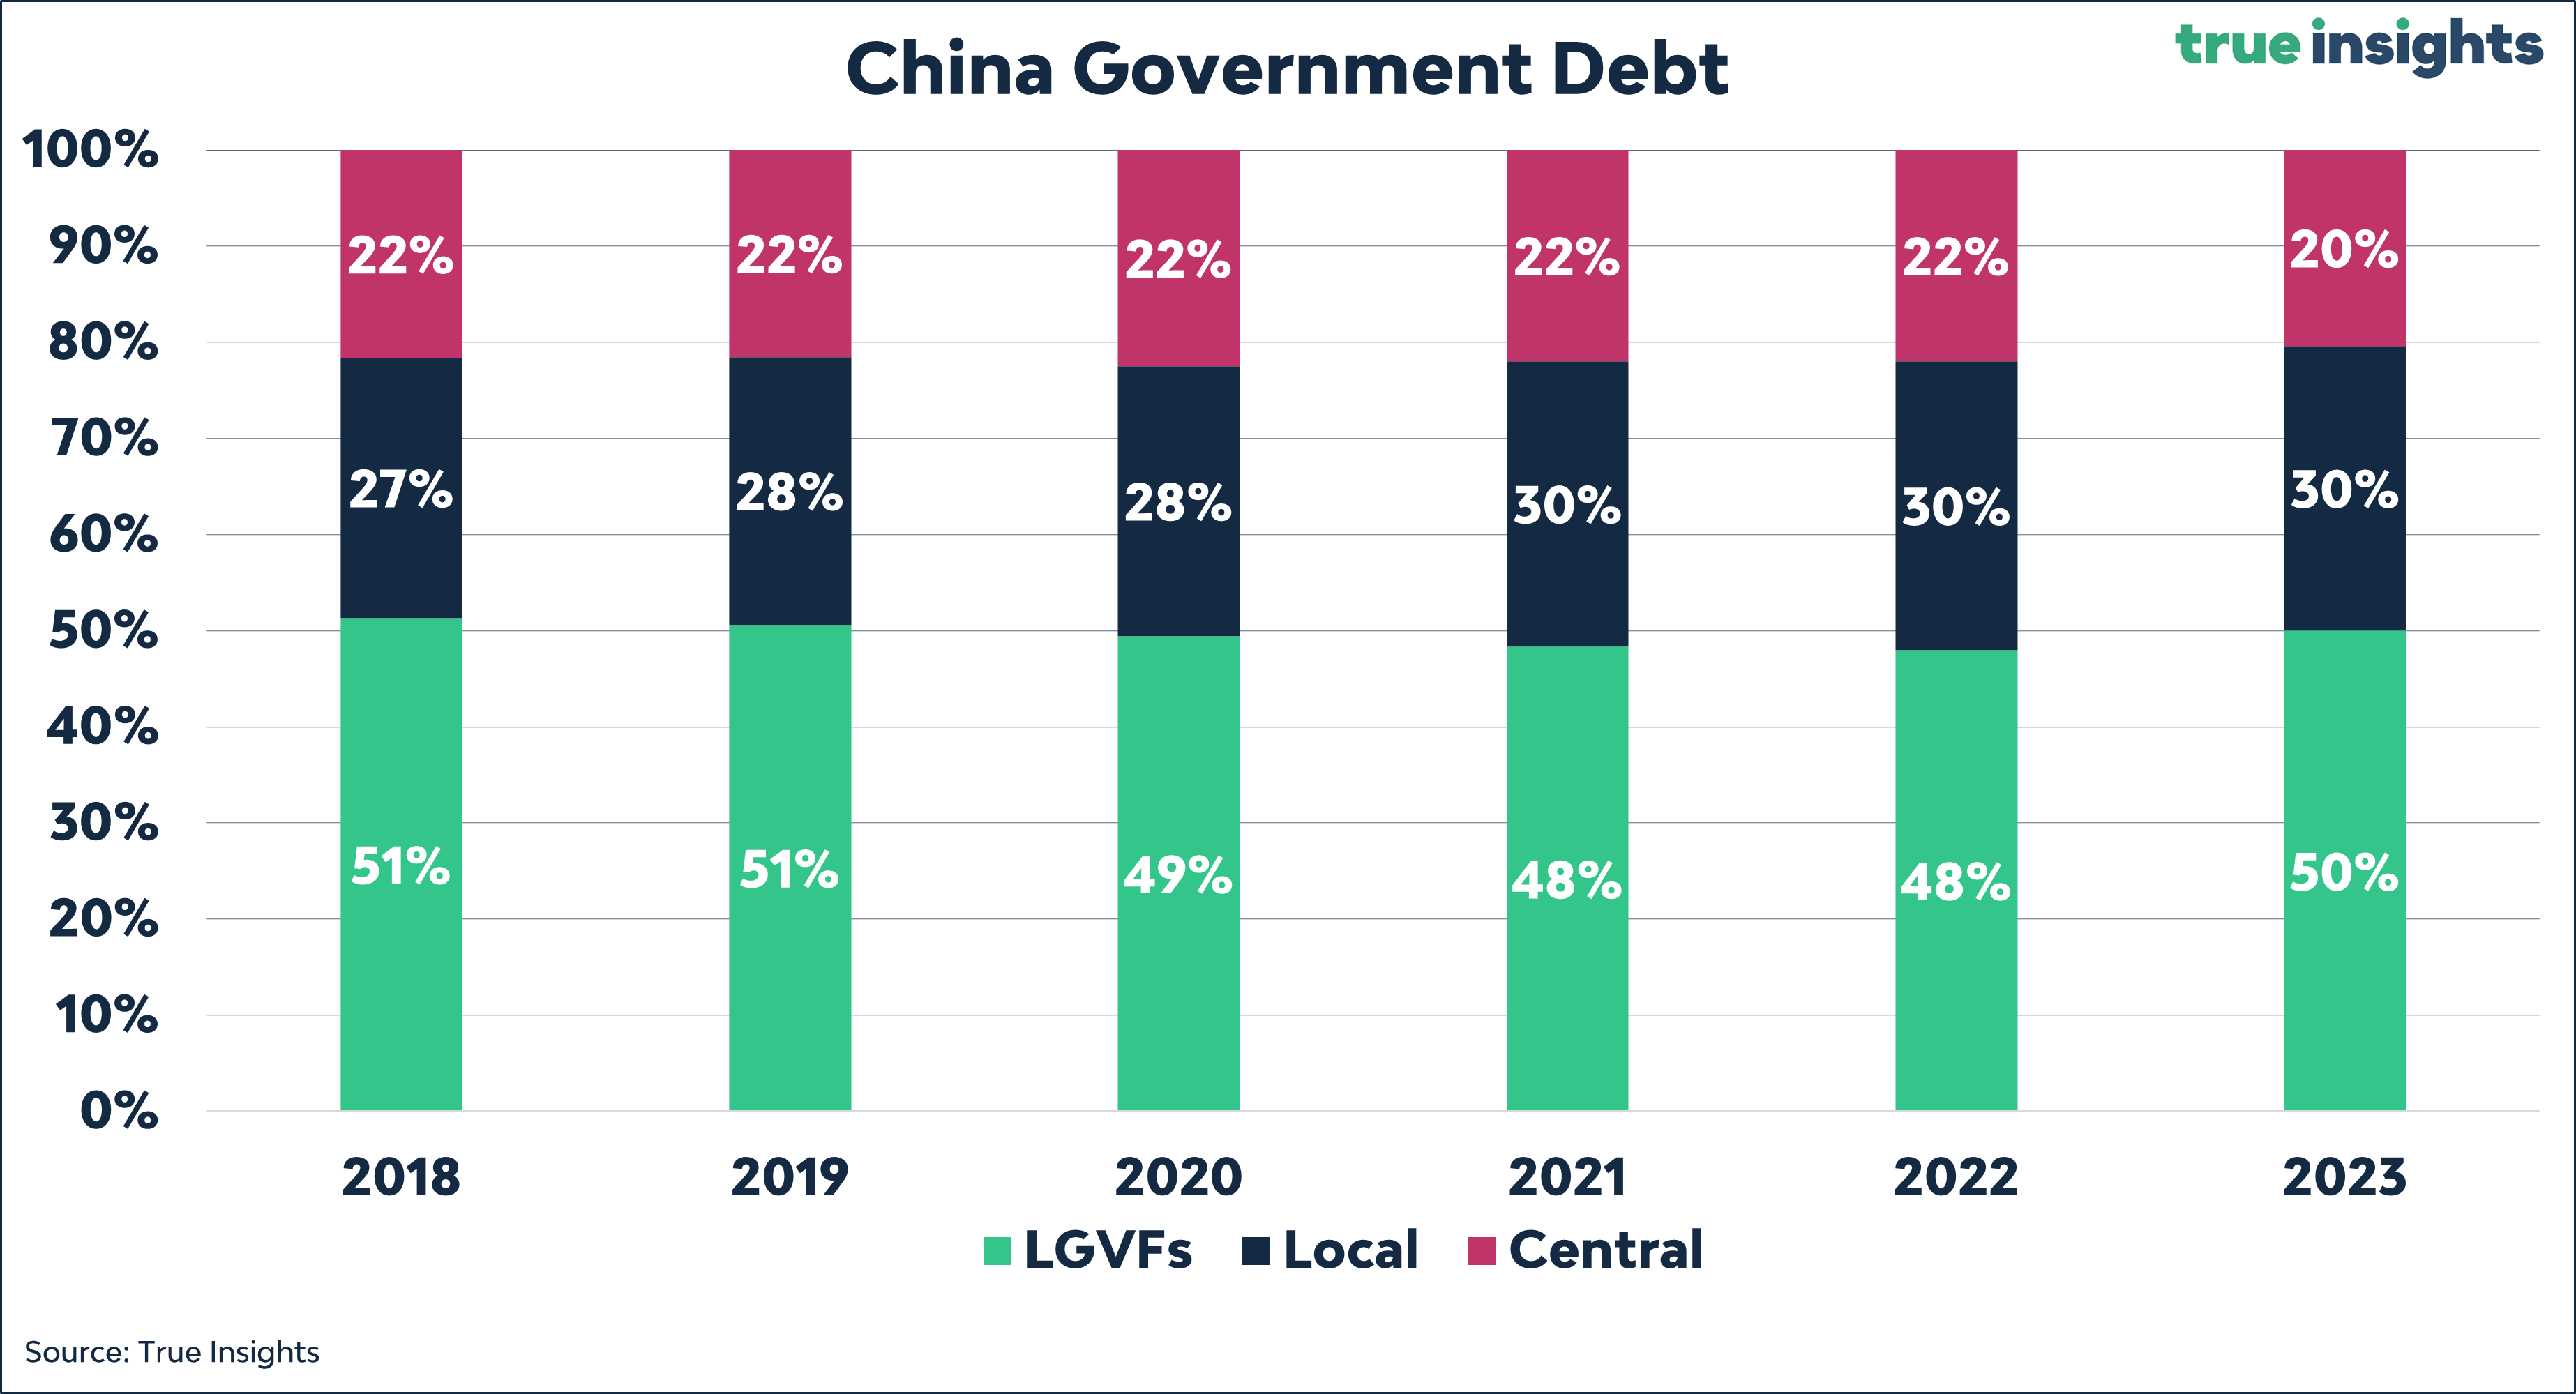
The real estate recession is exacerbating issues for Local Government Financing Vehicles (LGFVs) to the extent that a state-owned enterprise had to issue bonds to refinance an LGFV’s debt, despite having no equity relationship with the LGFV. If there are doubts about China’s nearing debt ceiling, here’s further evidence. More on this topic next week.
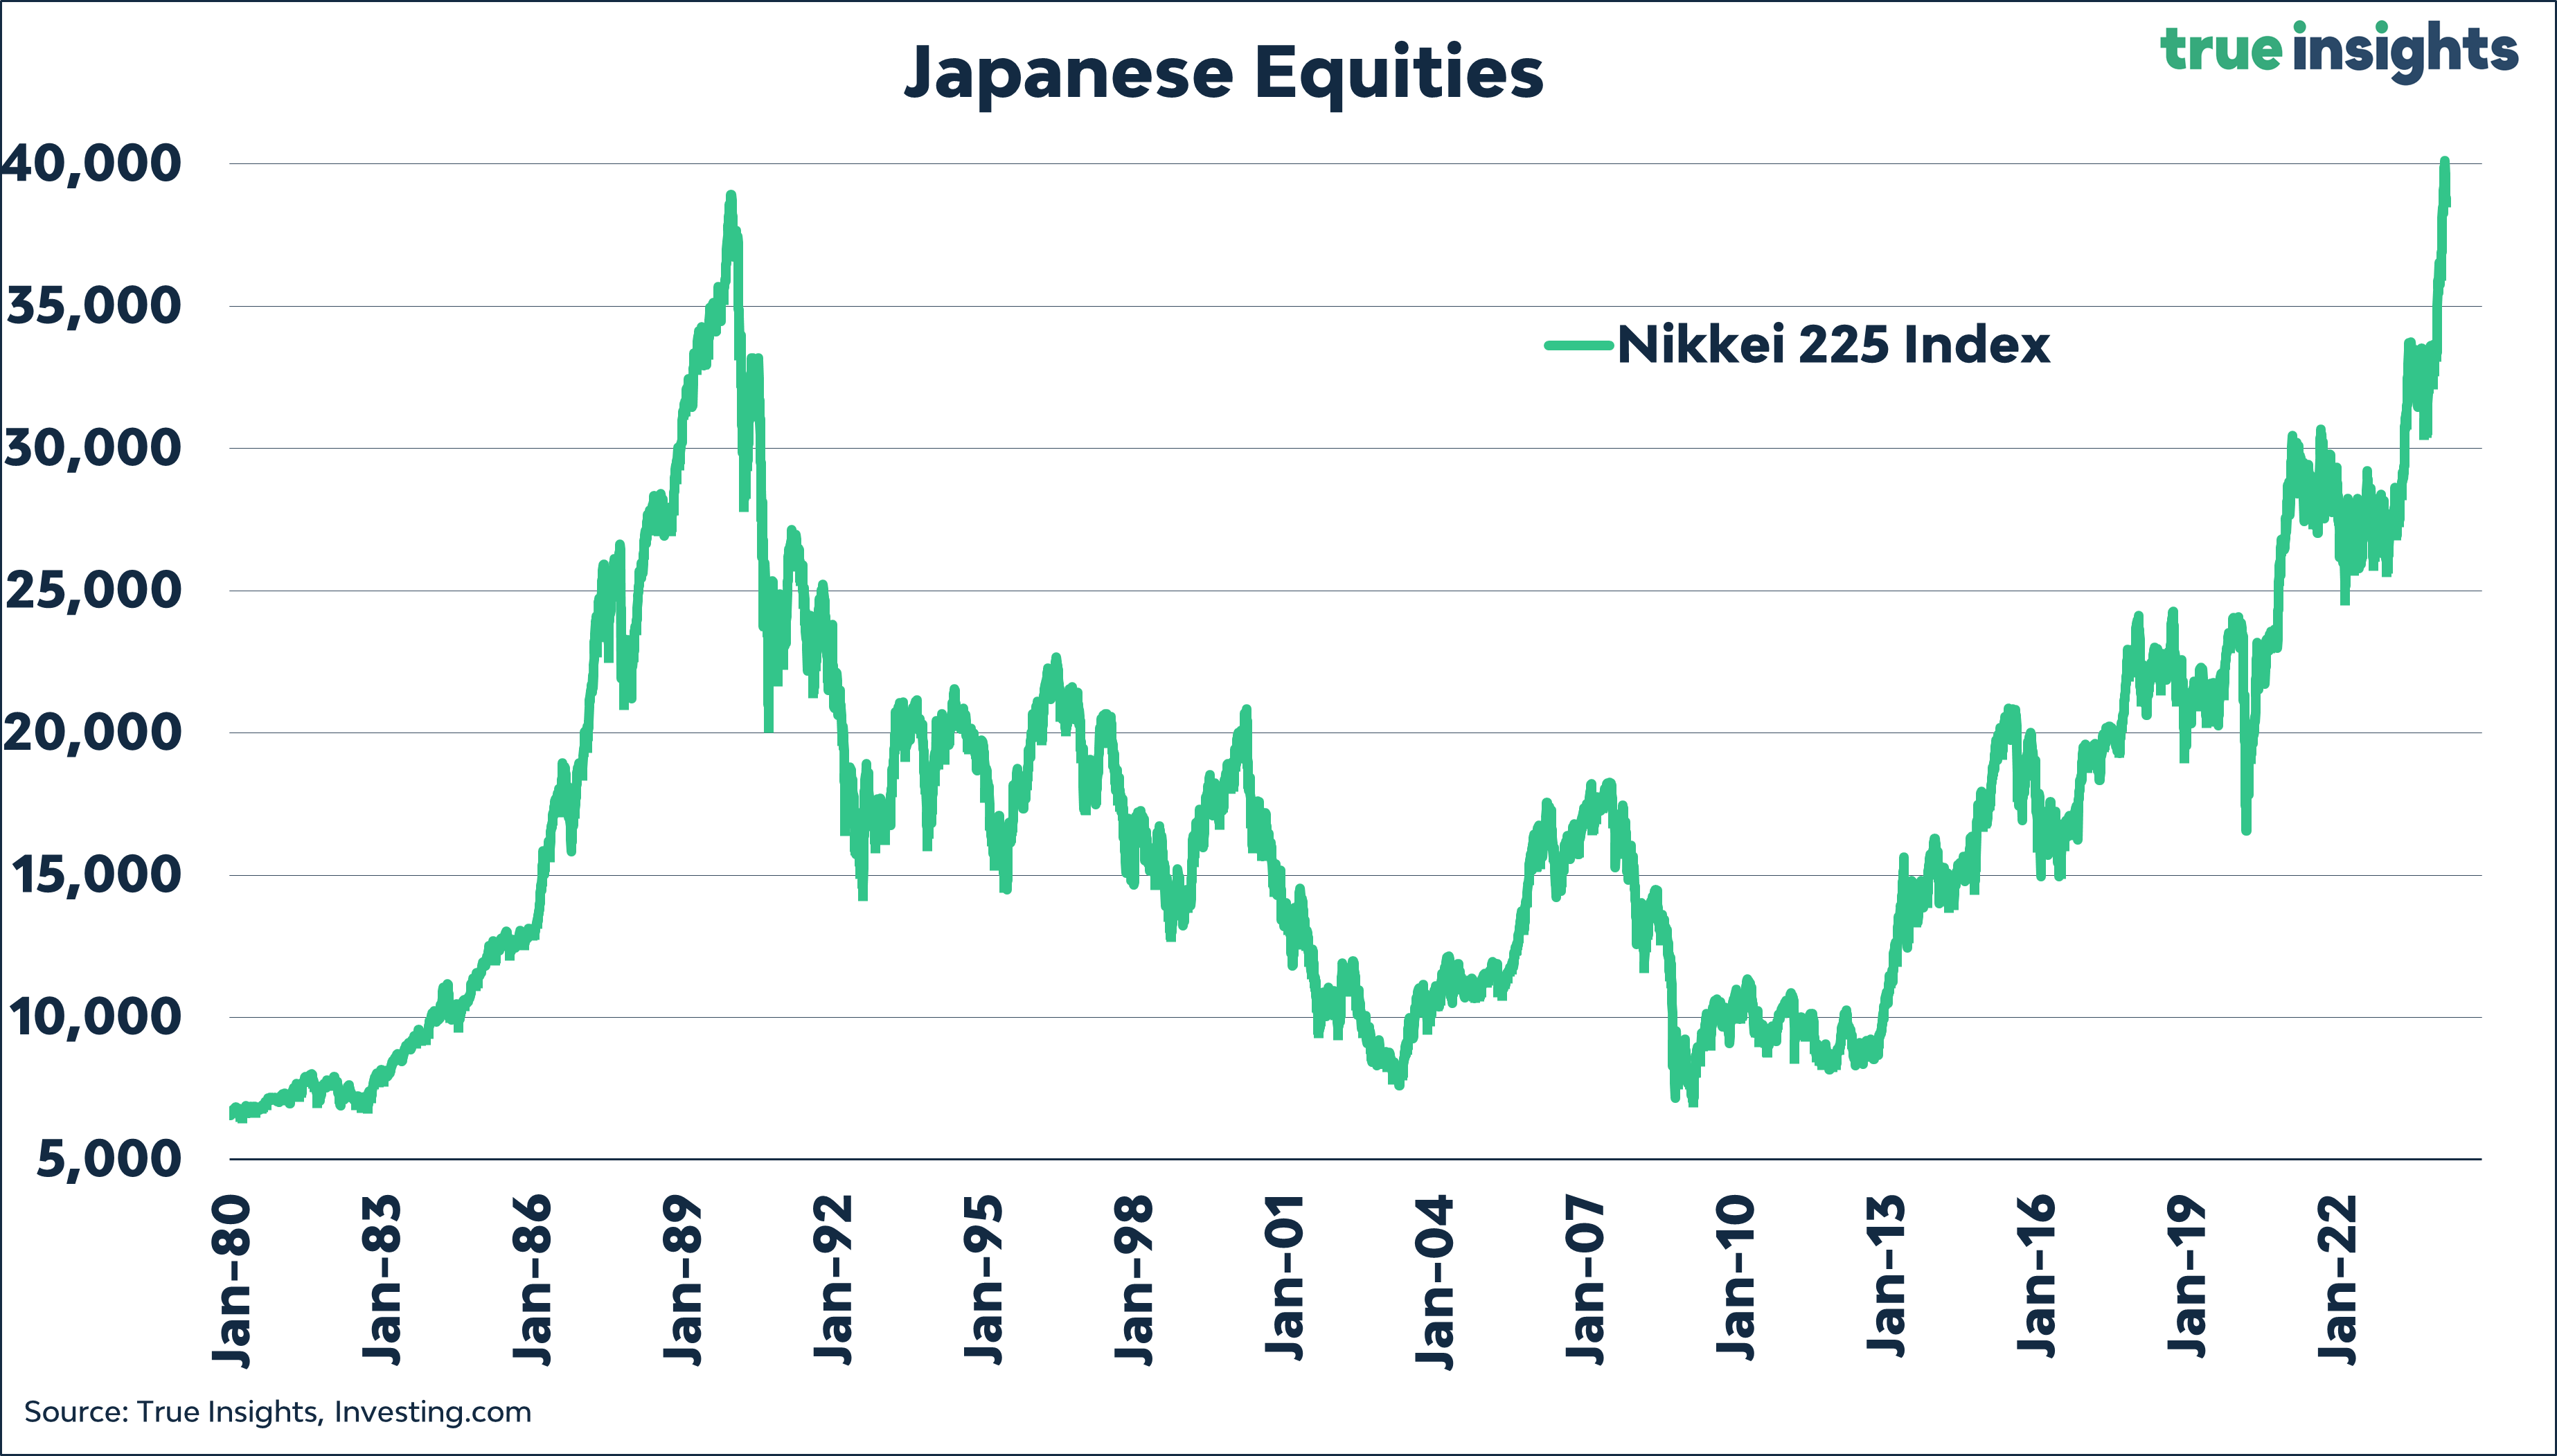
Japan – Will They or Won’t They?
According to reports, the Bank of Japan might finally put an end to its negative interest rate policy (NIRP). A significant factor appears to be a 5.3% wage increase achieved by a group of labor unions, surpassing the initially expected 3.8% increase, the strongest in 30 years.

This surprising development will likely influence the upcoming interest rate decision. A rate hike from -0.10% would primarily serve to exit negative rates, barely narrowing the gap with other central banks, especially as they delay rate cuts due to inflation dynamics.
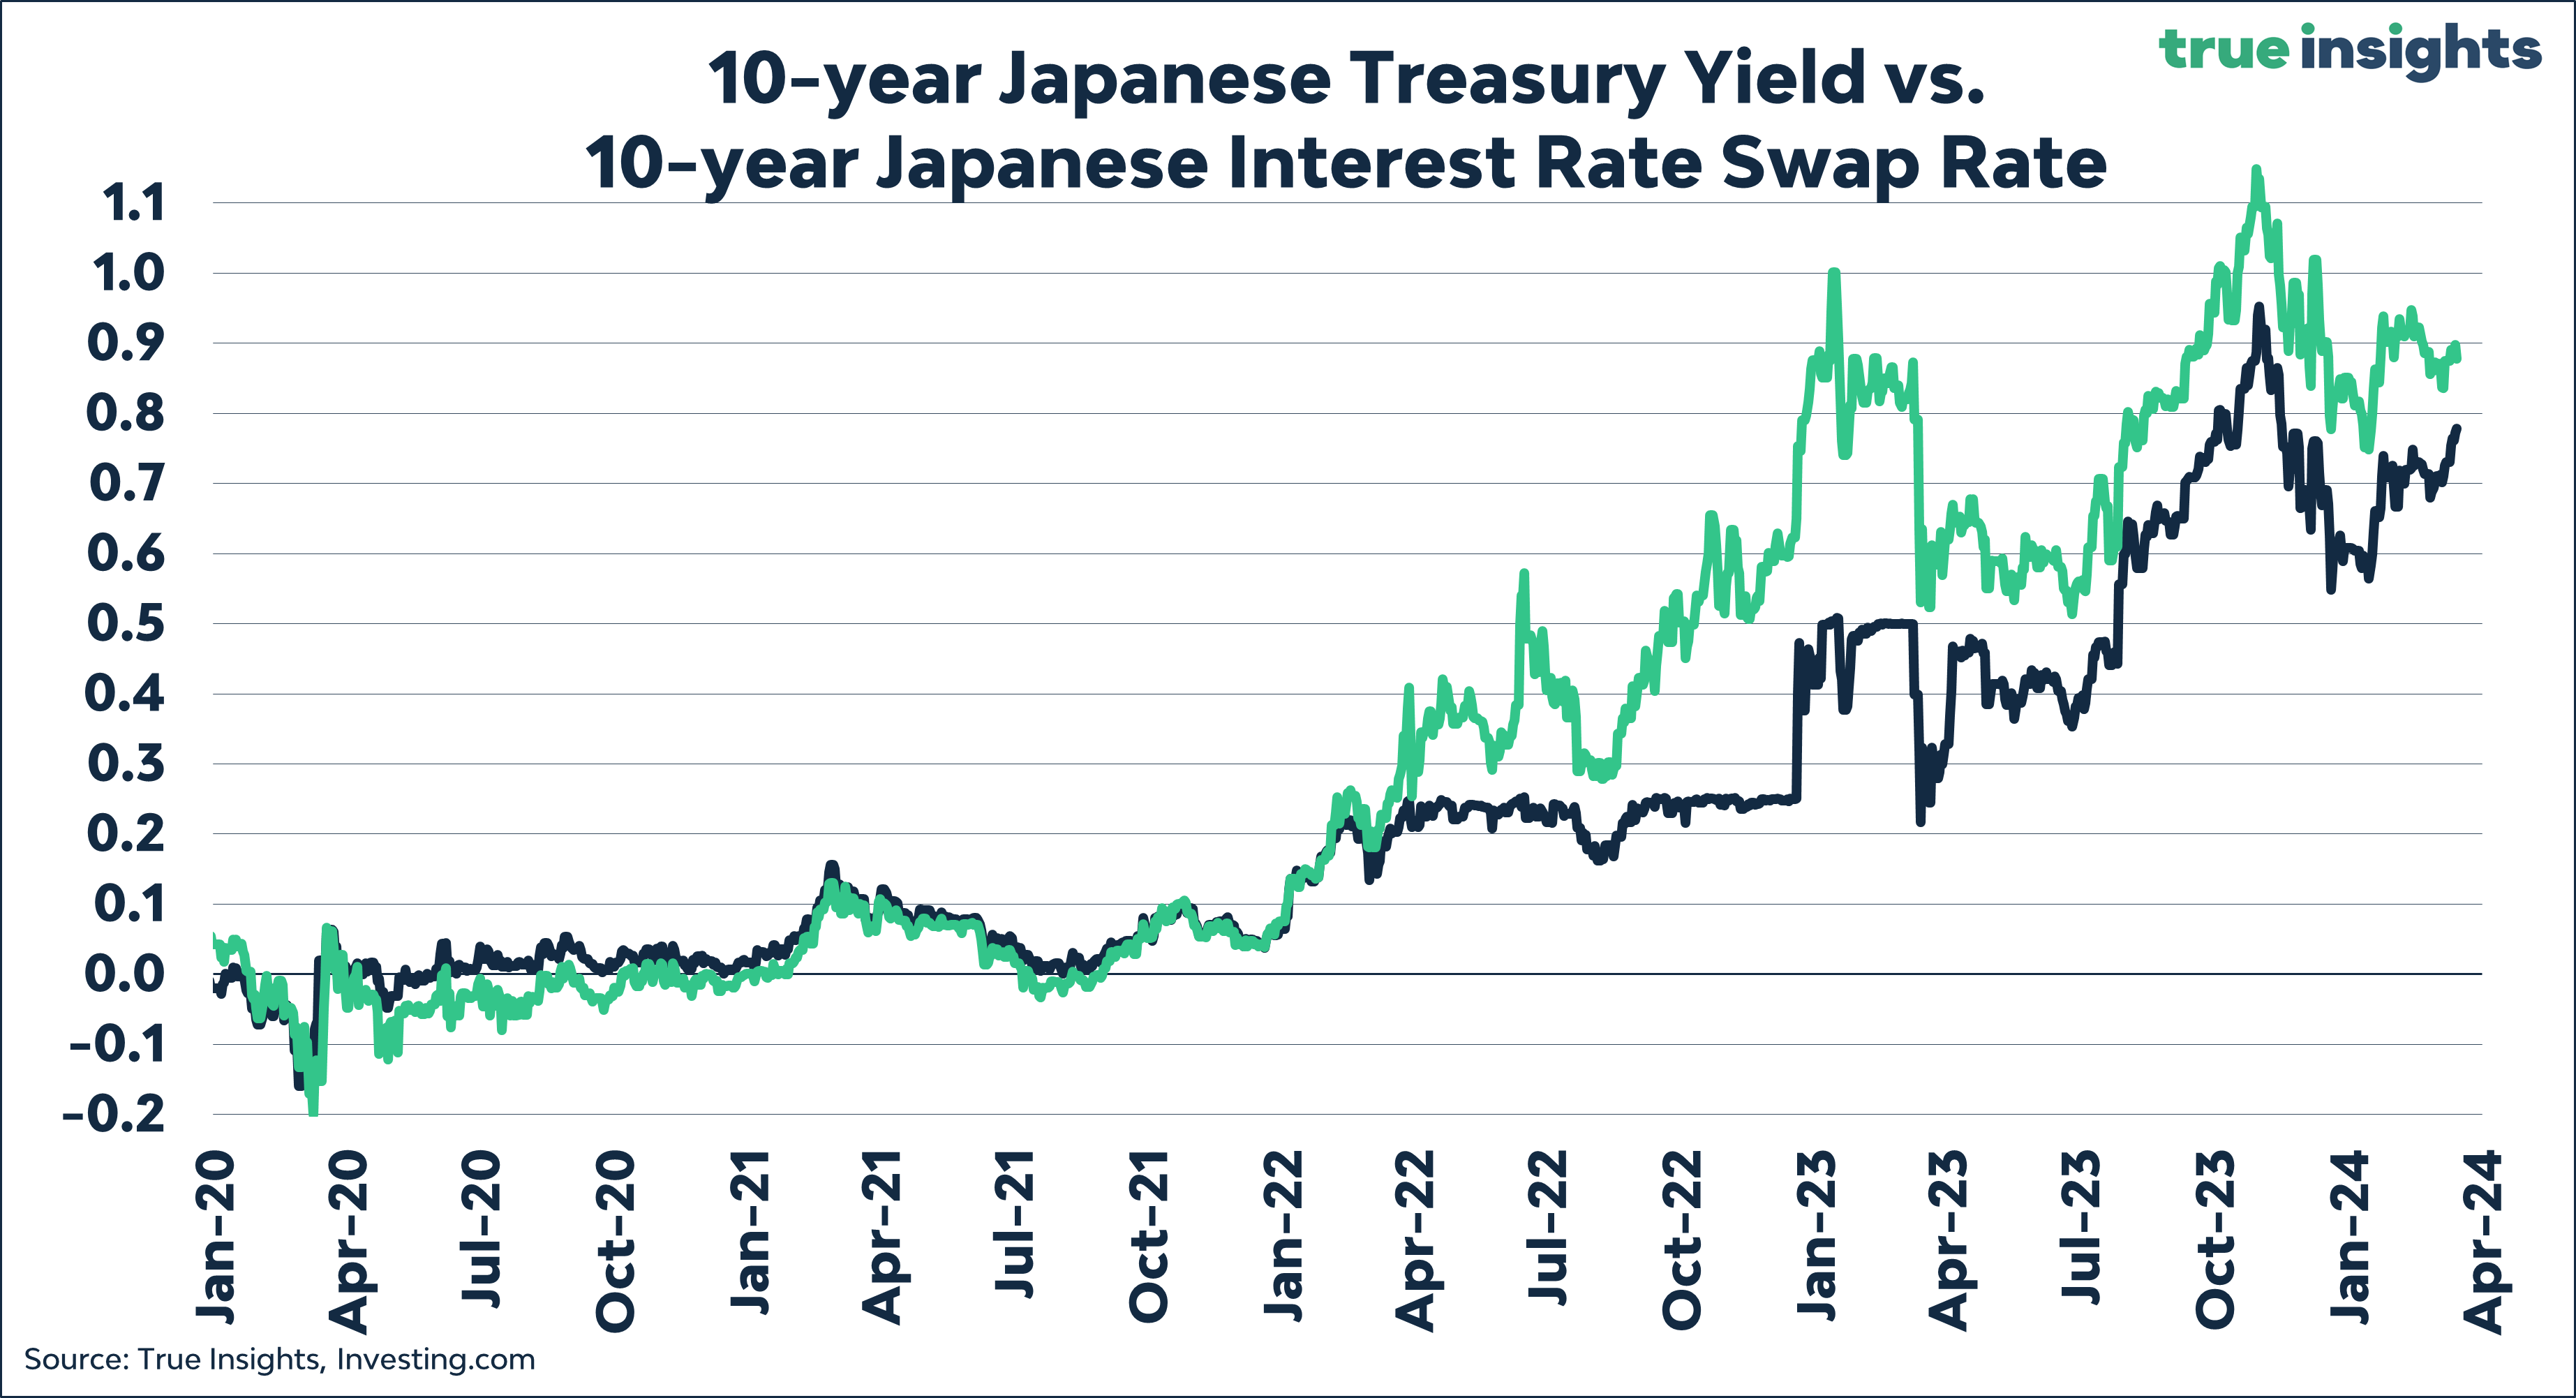
What does this mean for the yen-Nikkei dynamic? Until the Federal Reserve fully commits to preparing the market for rate cuts, the potential for a stronger yen seems limited. Establishing a yen position might only be promising if it’s against another funding currency, such as the Swiss Franc or the Euro, especially with the ECB further along in rate-cut preparations.

Moreover, a rate hike by the Bank of Japan could pressure market sentiment, which is already showing signs of strain. A stronger yen coupled with declining sentiment could lead to lower Japanese stock prices.
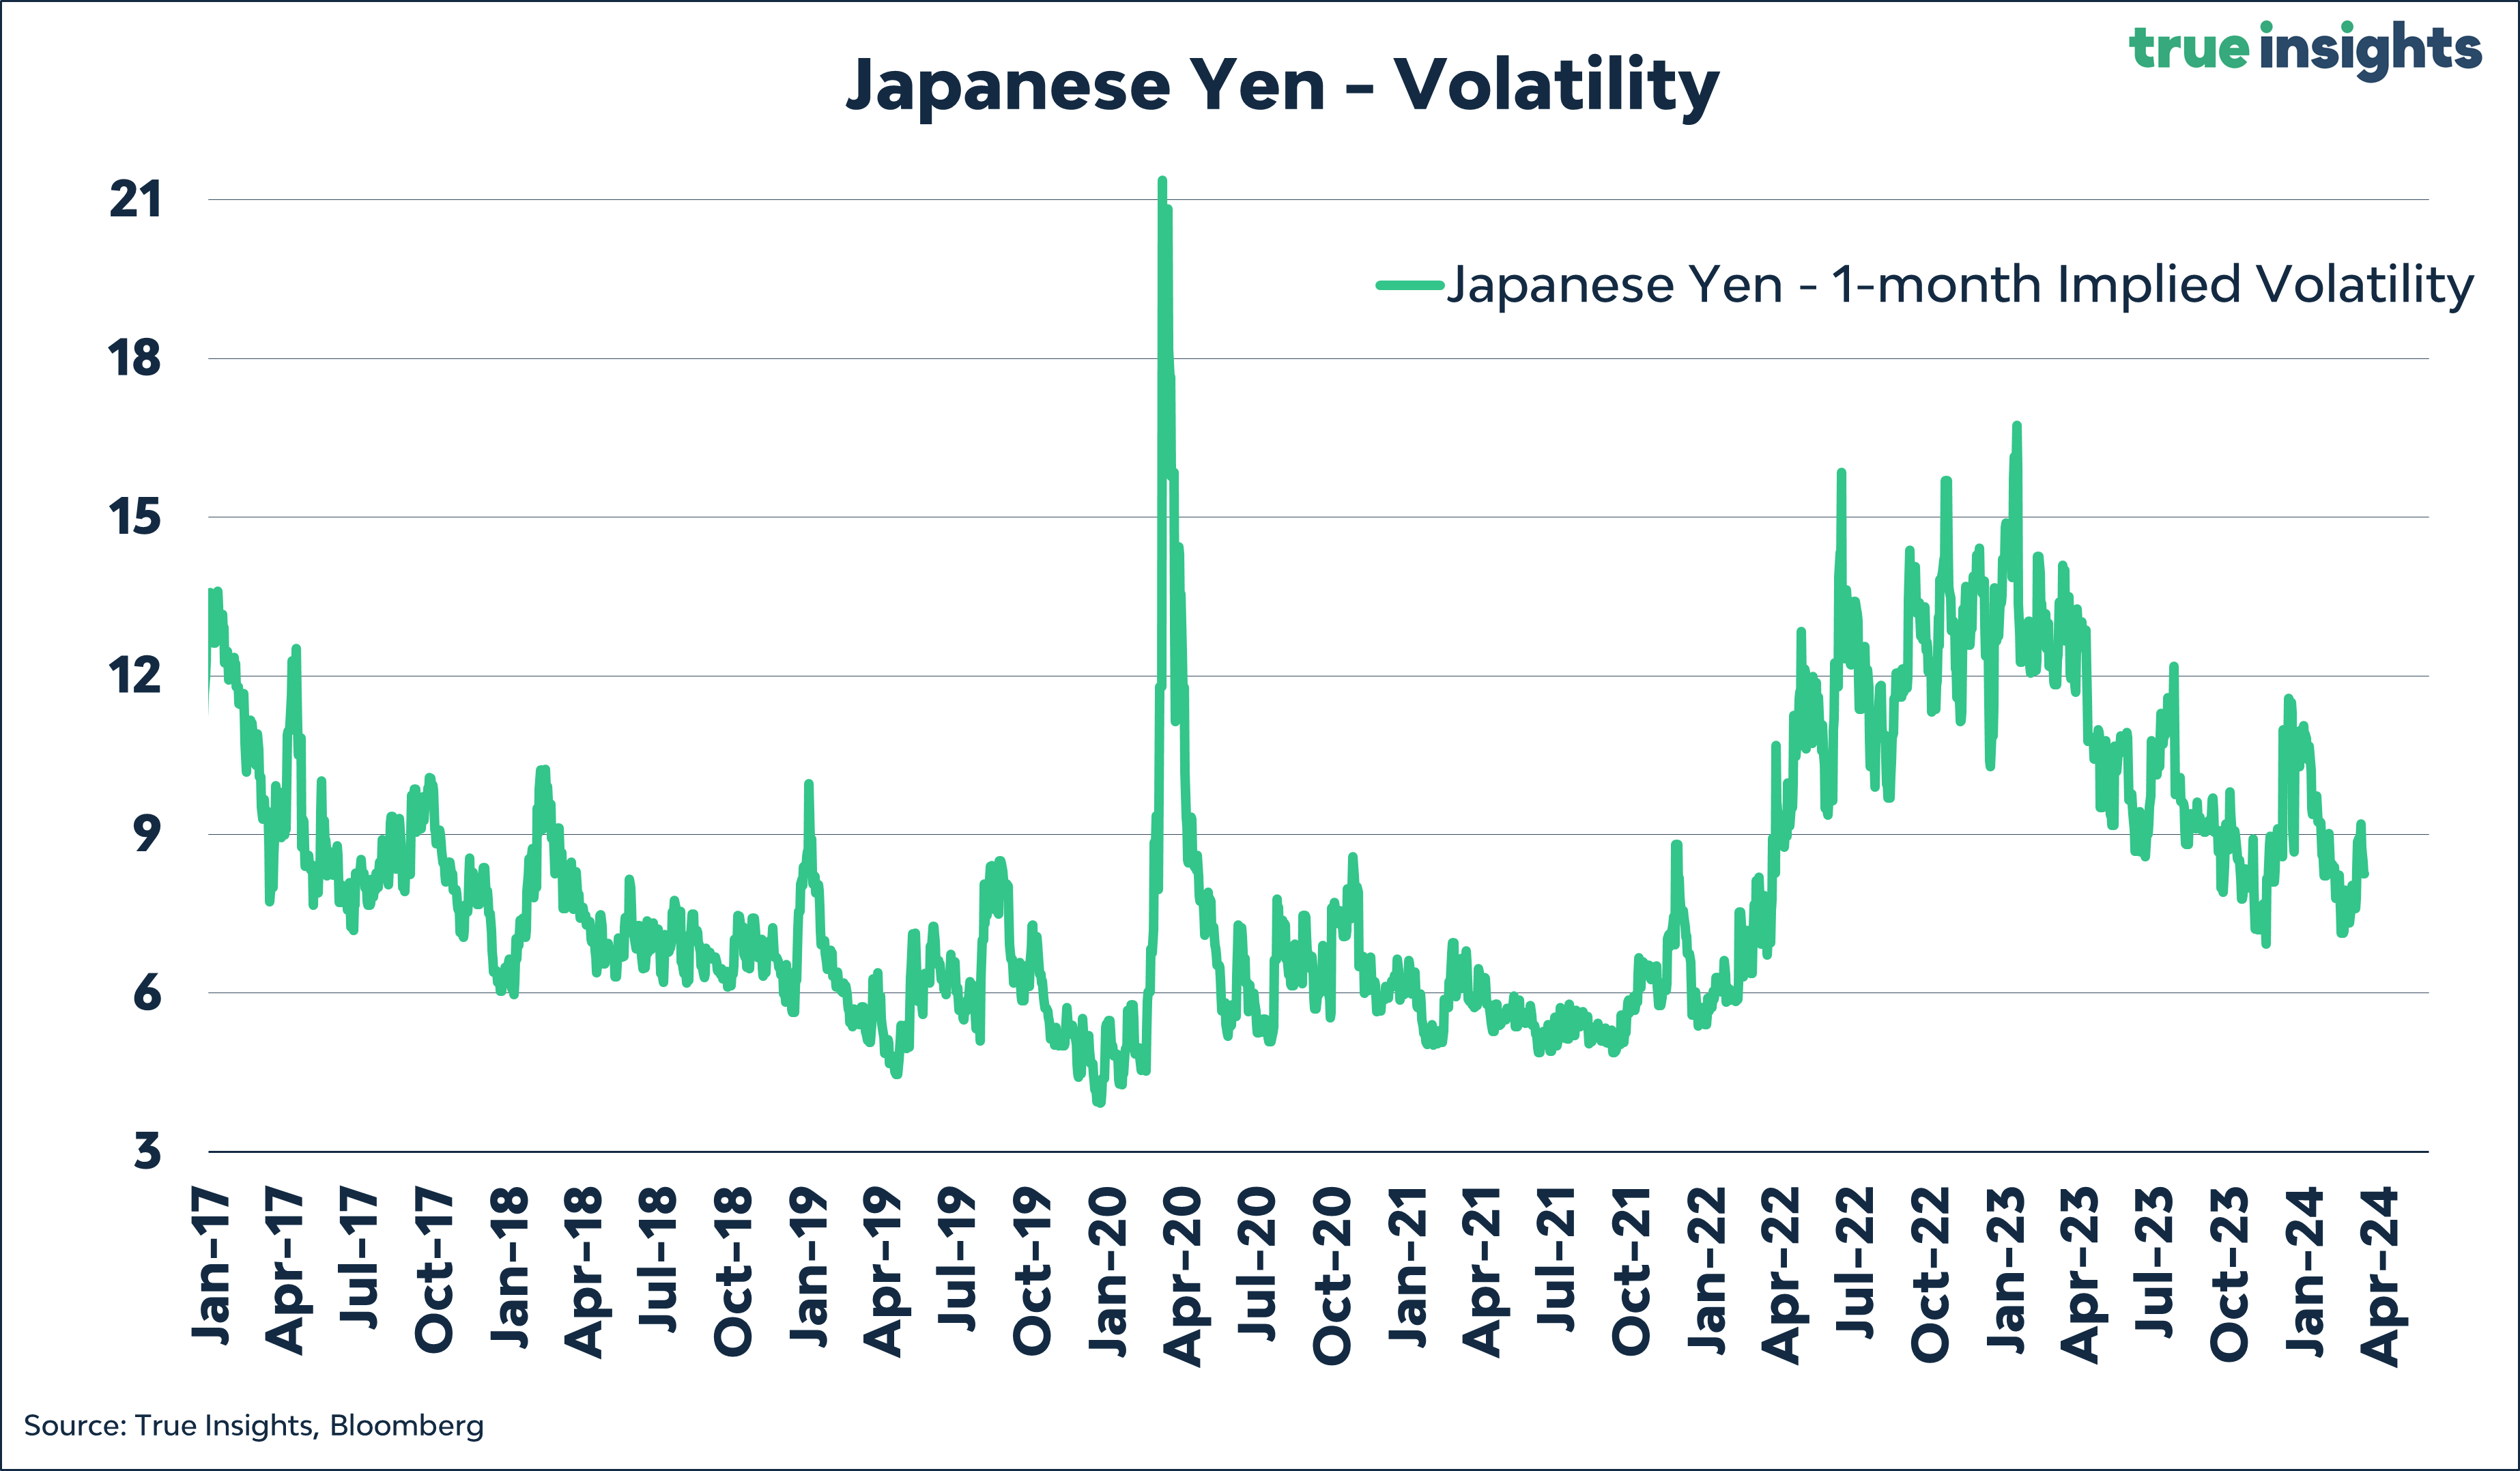
However, it’s worth noting that a significant portion of the rate hike may already be priced in, as yen volatility has barely increased in recent weeks. A non-event should not be ruled out.
Sentiment
A Massive Concentration Chart
The Goldman chart below is one of the most critical charts concerning equity concentration risk. It highlights seven instances of extreme market concentration, measured as the market cap of the largest stock relative to the market cap of the 75th percentile stock and the corresponding drawdowns in US equities.
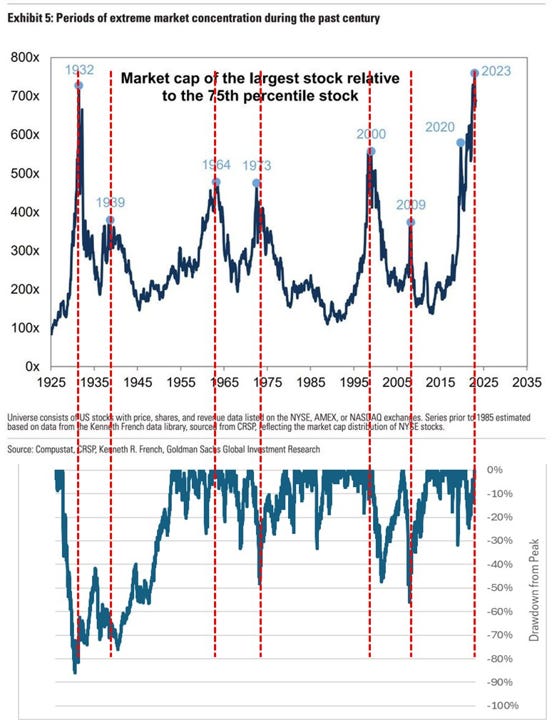
Notably, in four of the past six instances, peak concentrations coincided with a market bottom. Once, the peak aligned with a market peak followed by a significant drawdown (1998), and another time, it preceded a 20% drawdown. It’s overly simplistic to conclude that concentration peaks are detrimental to equities. While possible, it’s far from a certainty.
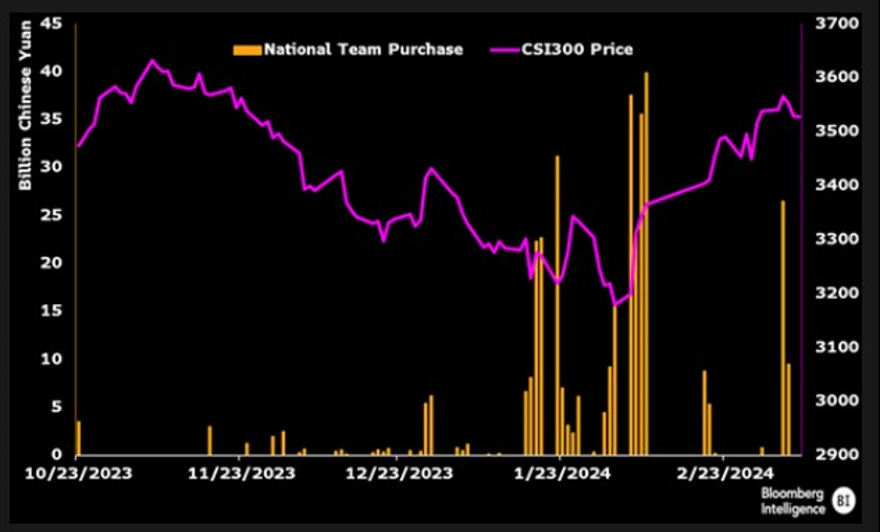
The National Team
In China, the so-called National Team must continue buying to prevent stock prices from falling. It’s still too early for a convincing long position in Chinese equities.
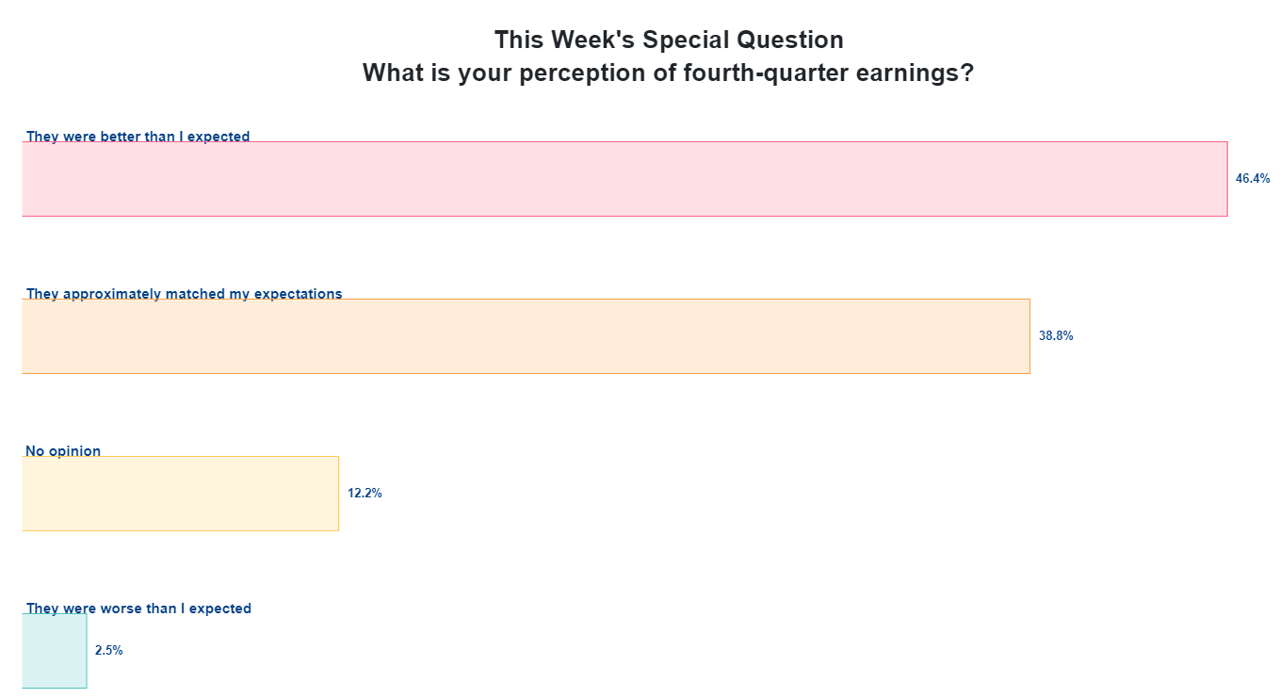
Earnings yeah!
From the AAII Investor Sentiment Survey: What is your perception of fourth-quarter earnings?
Fear & Frenzy
My Fear & Frenzy remains in Frenzy again. A reminder not to get too excited.

ENJOY YOUR WEEKEND!
JEROEN
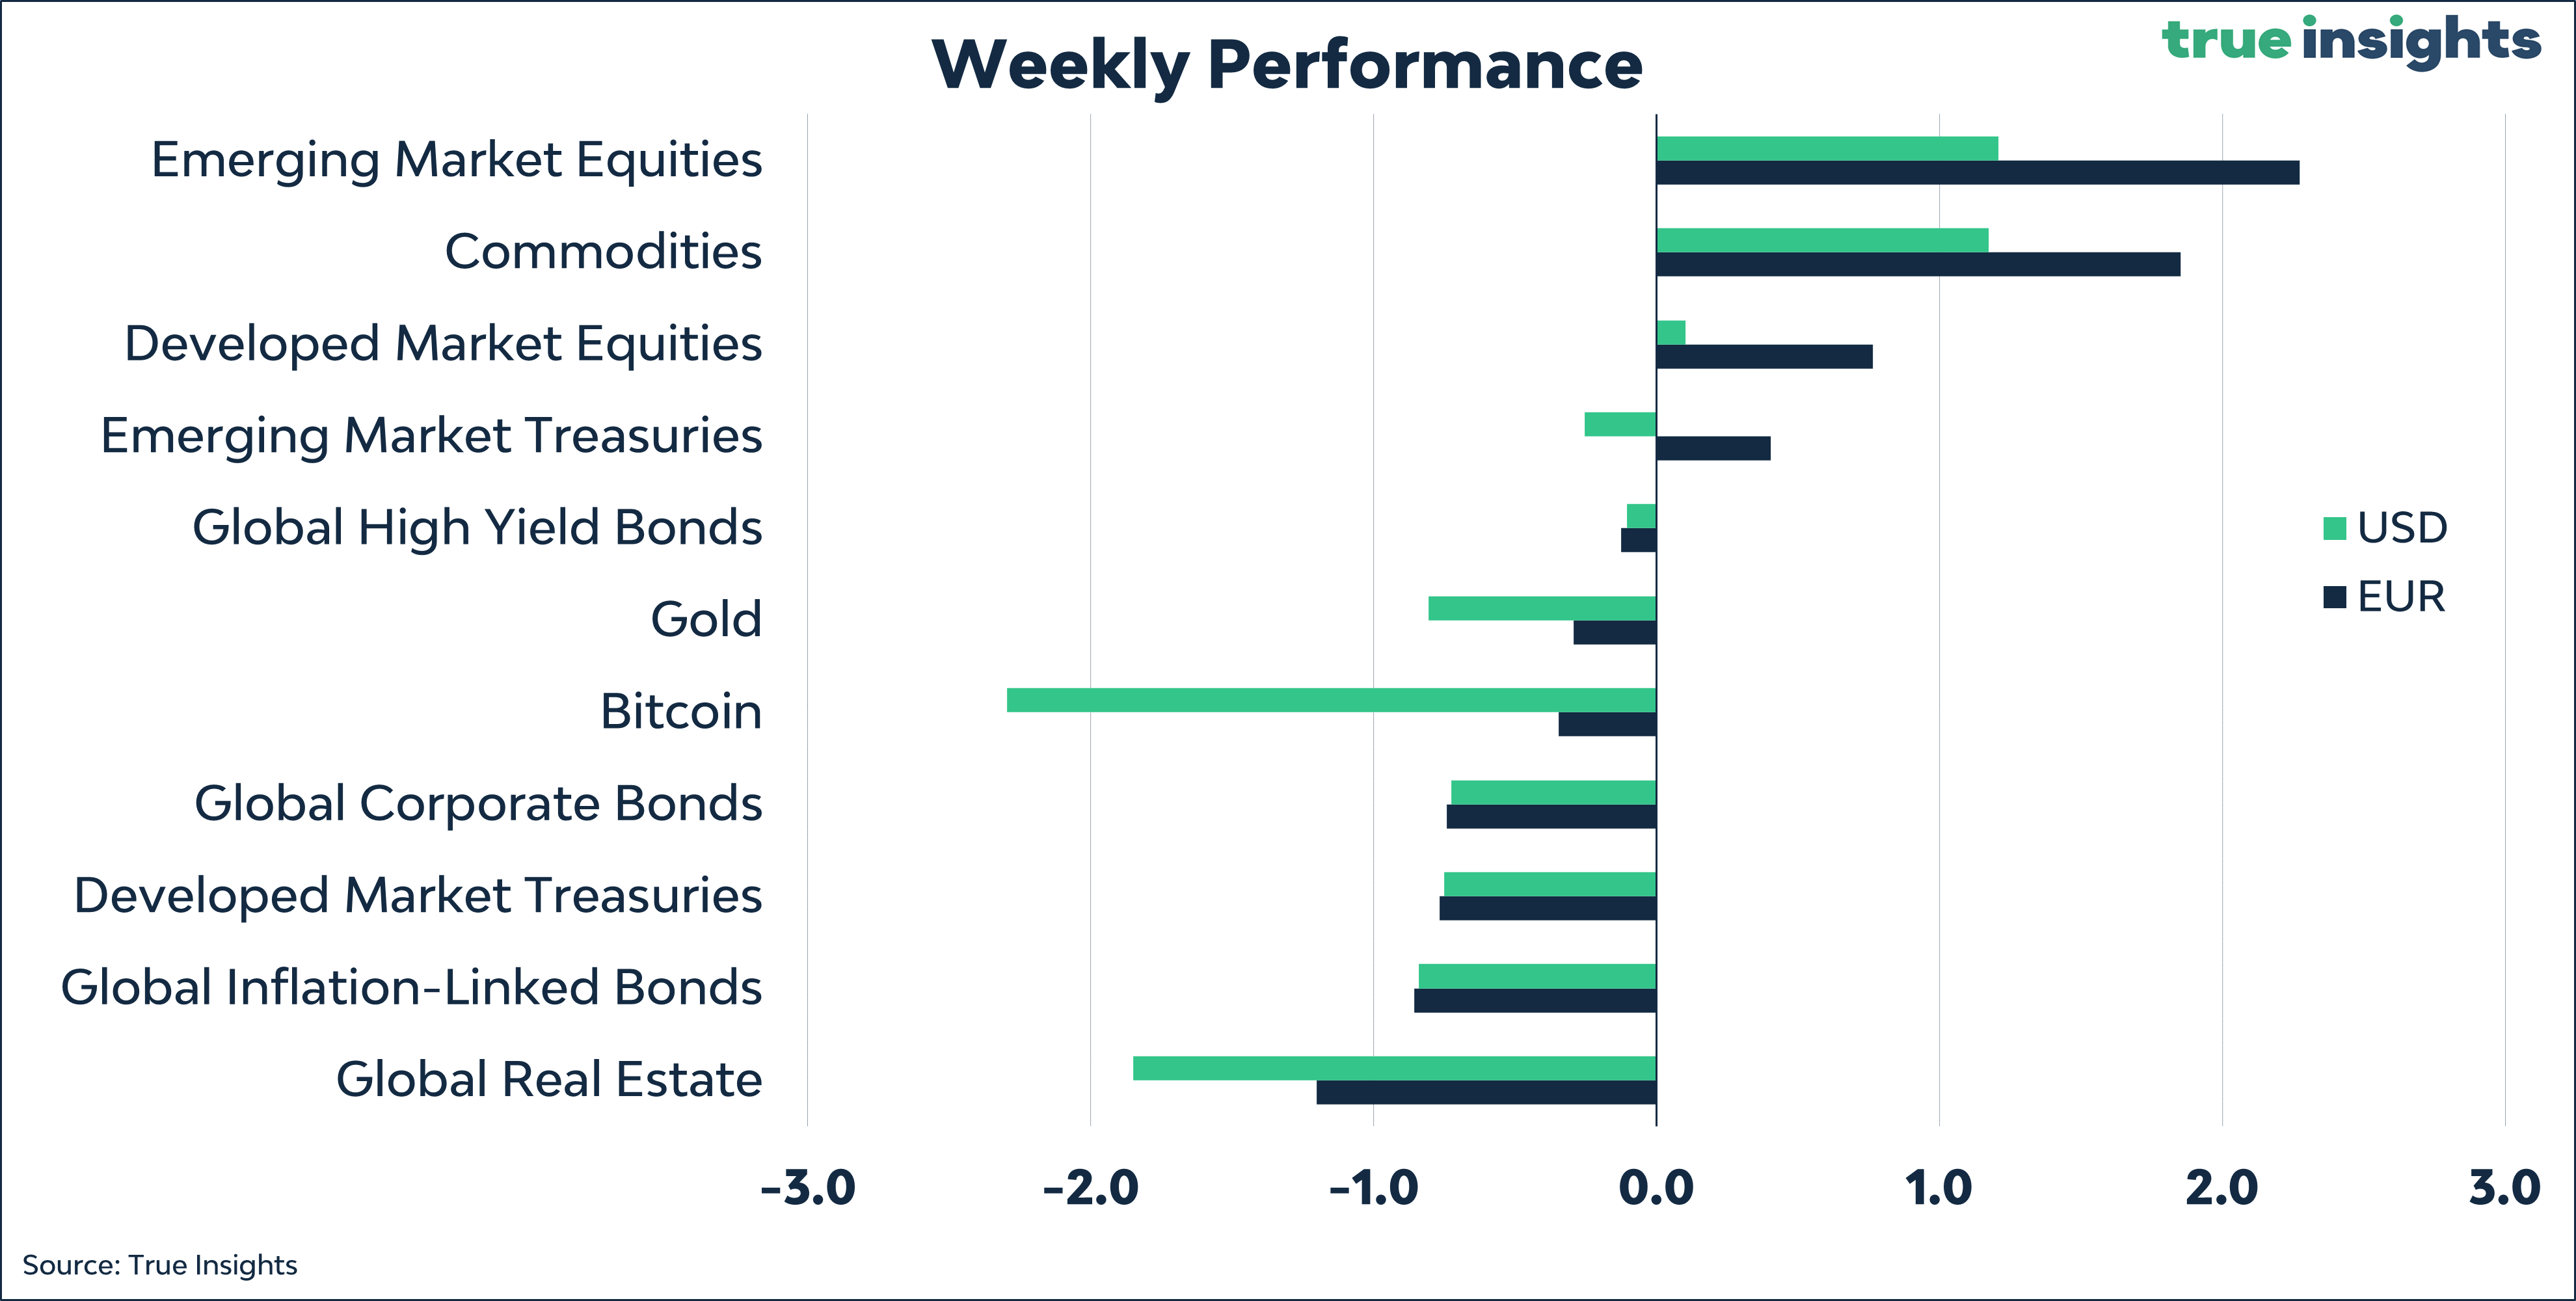
MARKETS
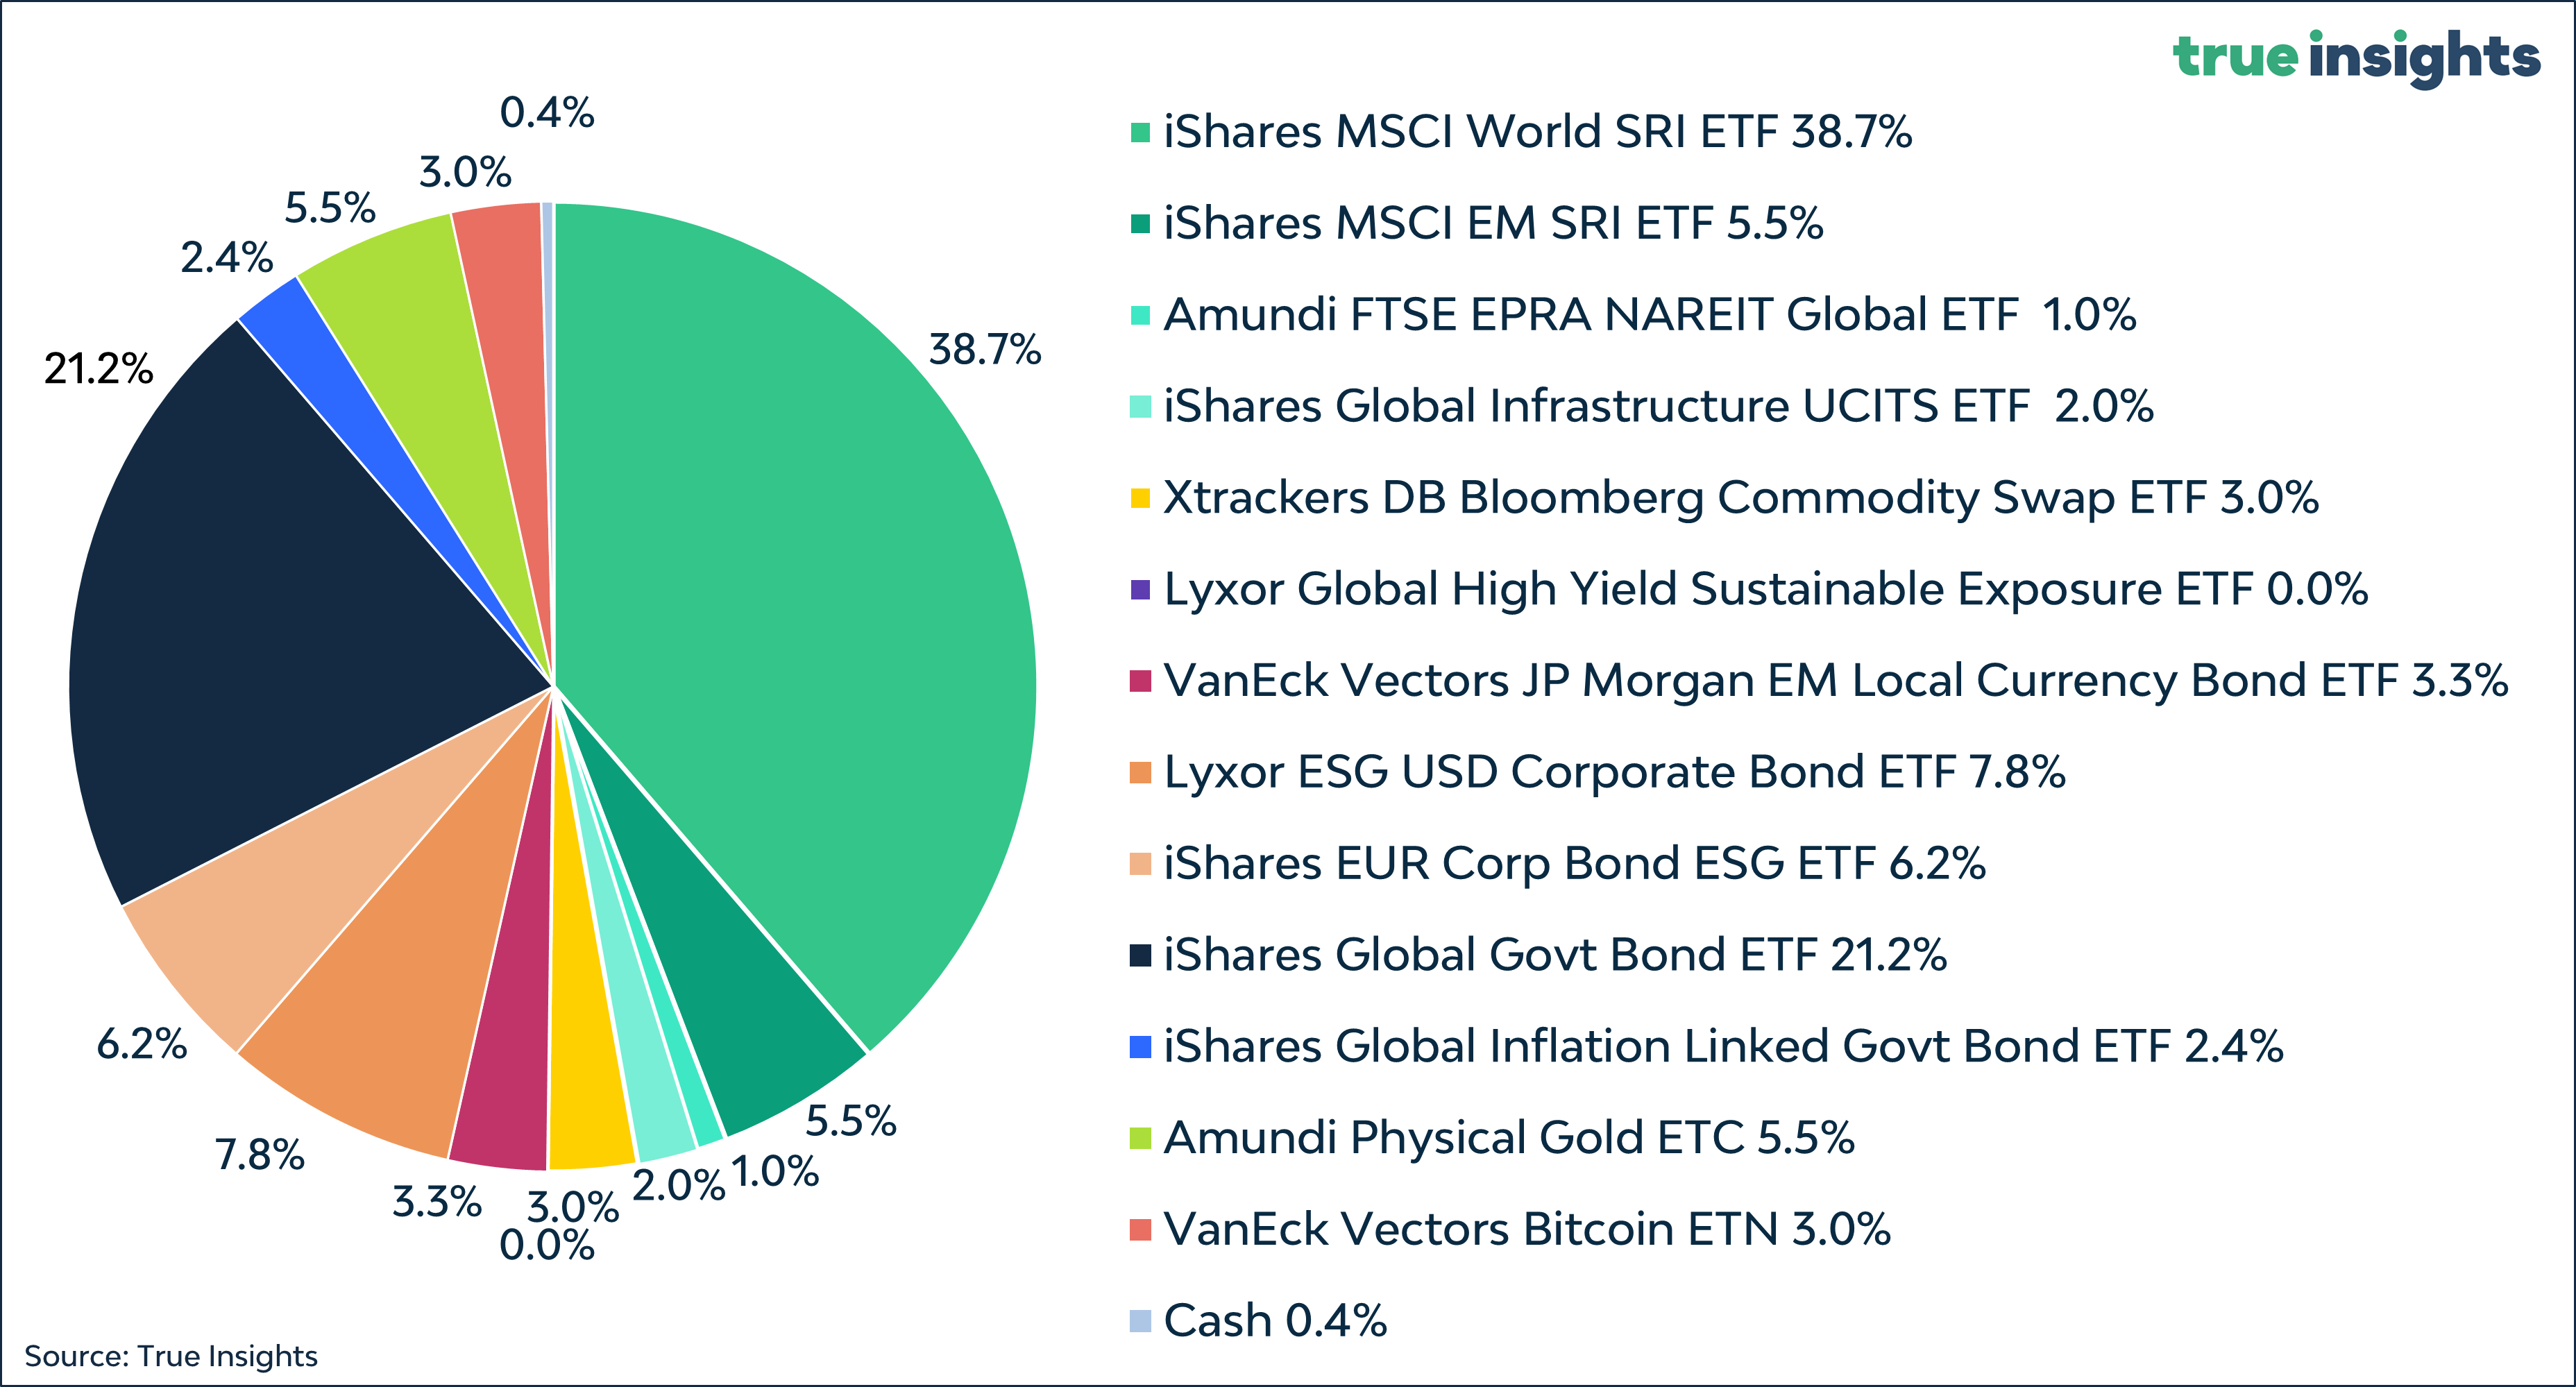
Active Weights
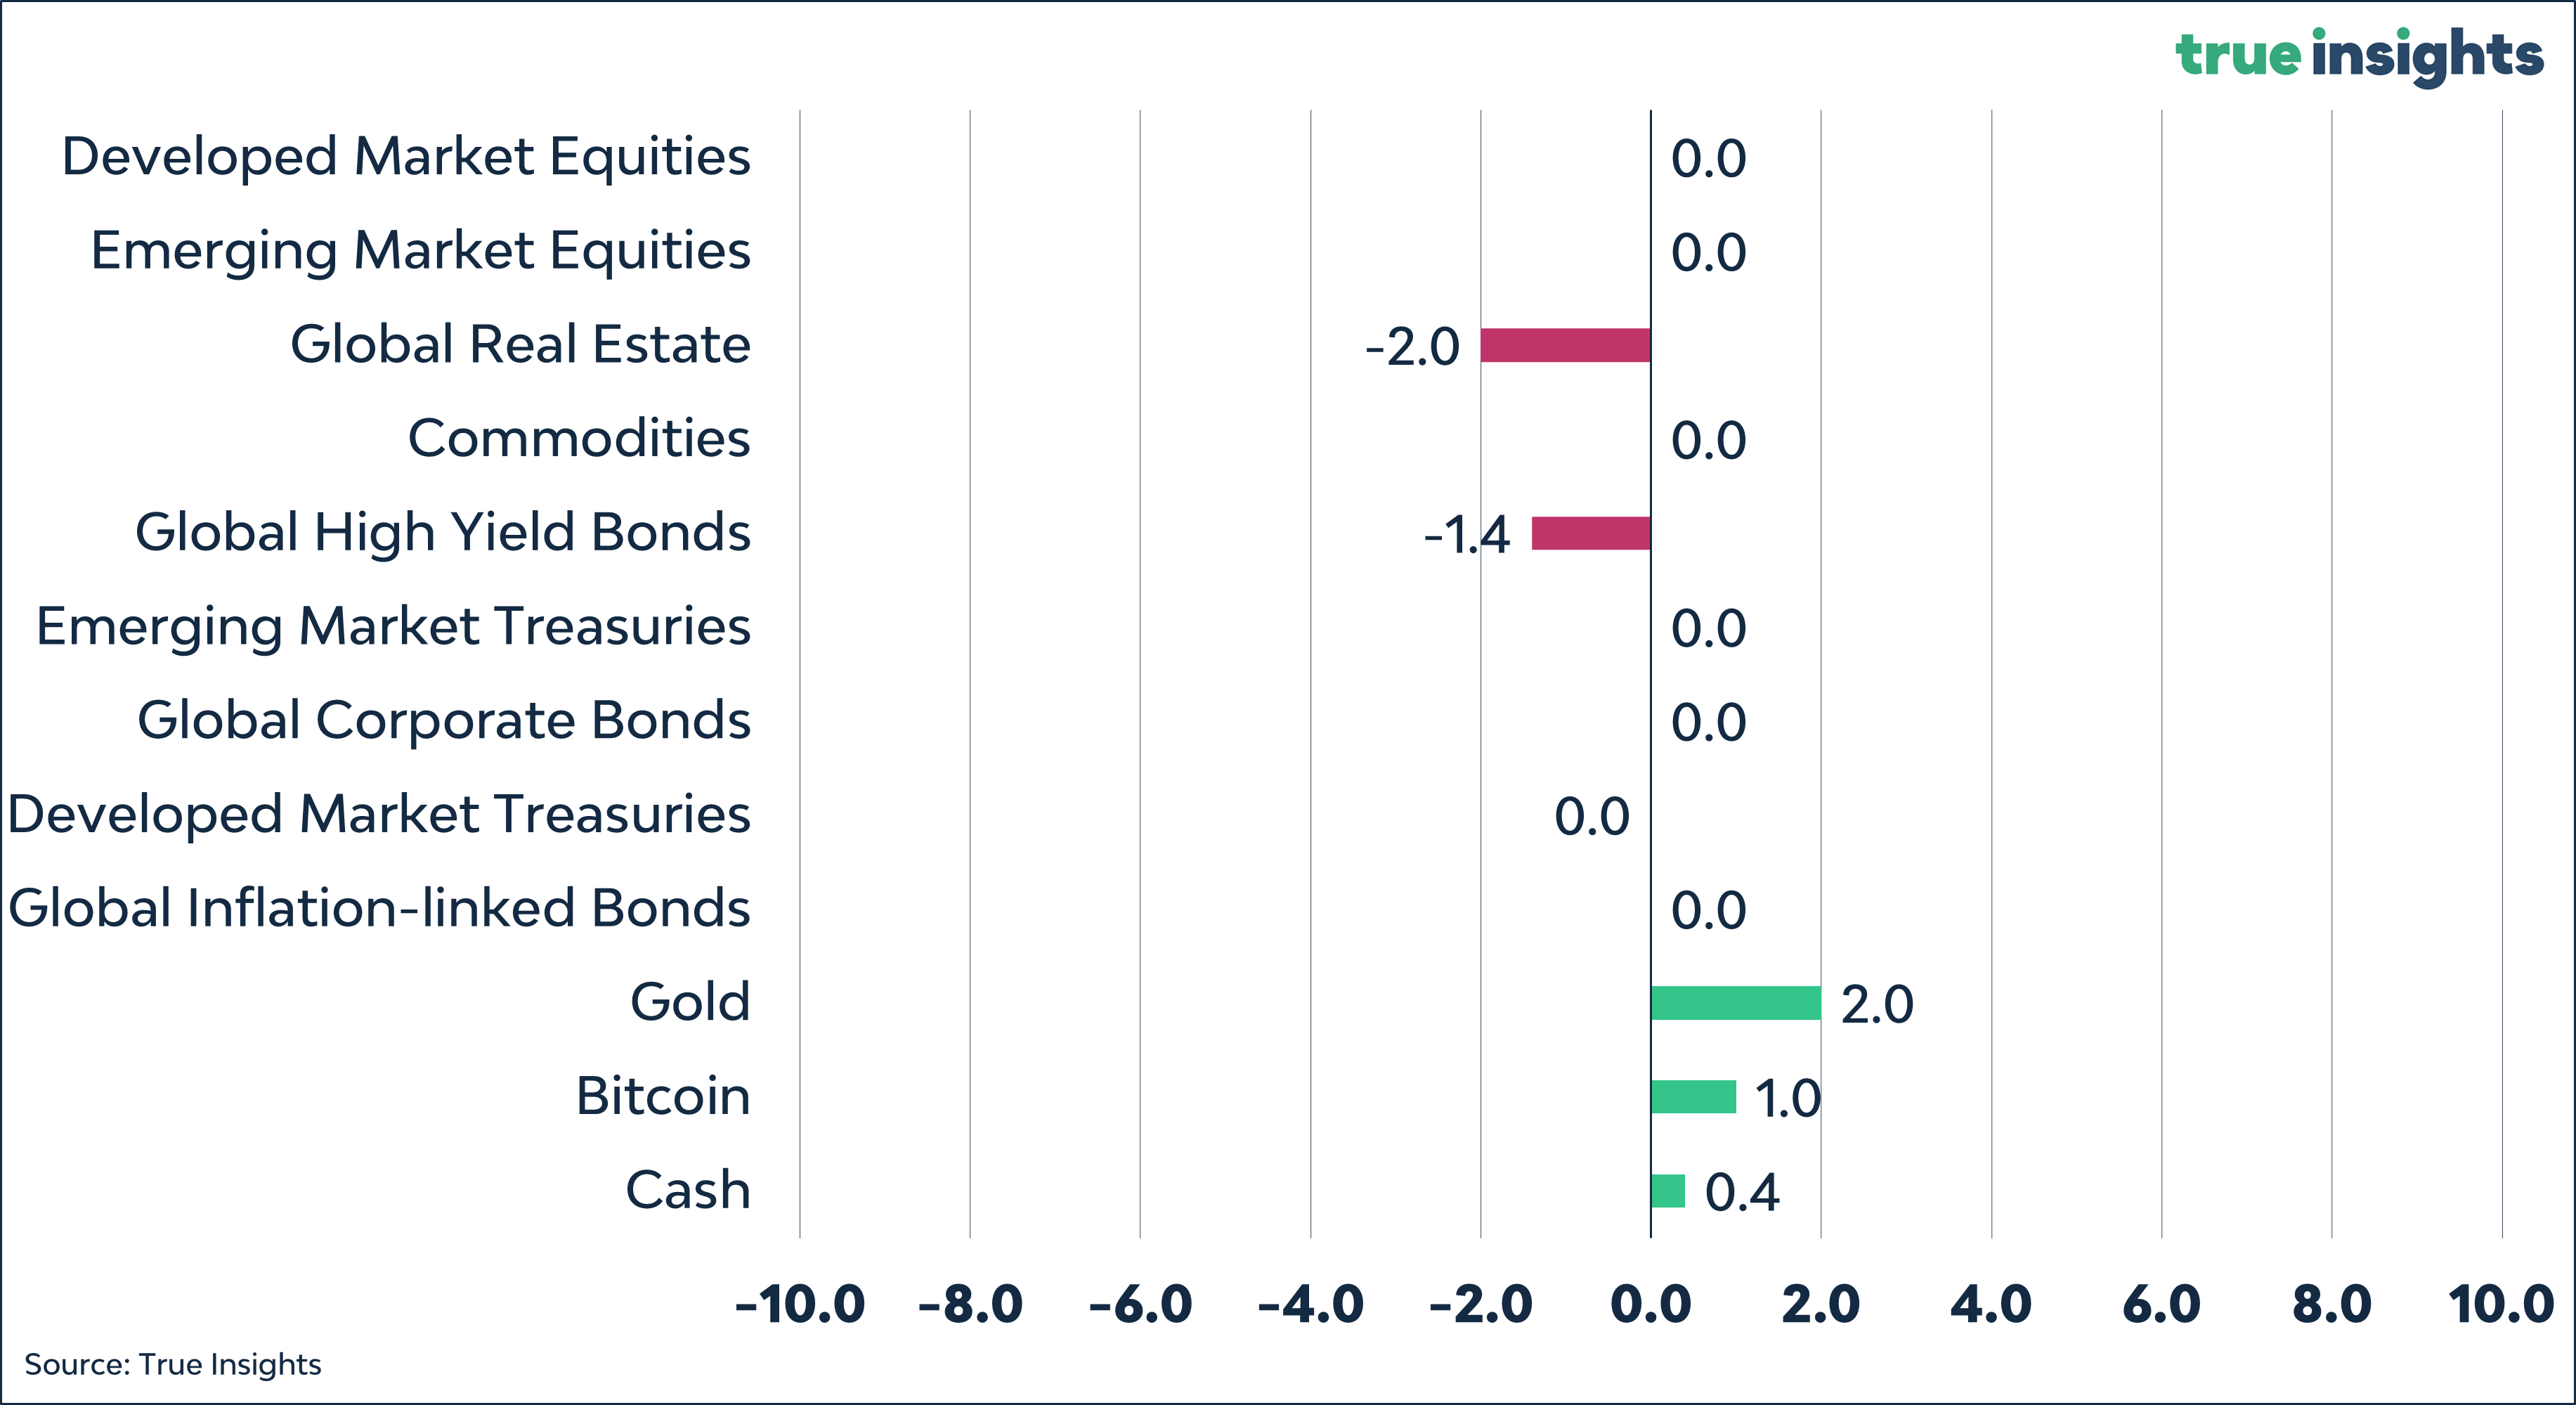
Balanced Portfolio