
The Weekly Market Monitor – Global monetary policy easing has begun!
The Weekly Market Monitor – Global monetary policy easing has begun!
We are on the brink of a new central bank easing cycle, with the odds increasing that we are just at the first innings of the economic cycle.

Welcome to the Weekly Market Monitor, keeping you updated on the week's most important charts and developments in financial markets.
Switzerland sparks the start of a global wave of monetary policy easing. And it’s only March!
Economists and other pundits who claim the ECB and BoE cannot follow Switzerland have got the data wrong!
Federal Reserve Chairman Powell admitted he likes his central bank balance sheet ‘BIG.’ Gold was over the moon by this!
Why are central banks already contemplating rate cuts when inflation levels are significantly above target, and the global economy is at full employment?
I explain why investors should pay more attention to the MOVE Index and less to the VIX Index. It comes down to the answer to the question above.
Have you invested in scarce assets like gold already? Given the current long-term trends in financial markets, gold will eat bonds for breakfast.
Did we have a US recession? The jury remains out, but the odds are rising that this is the case.
Meanwhile, investors are looking a bit too happy, increasing the risk of a short-term pullback in equities markets and the like
And much more.
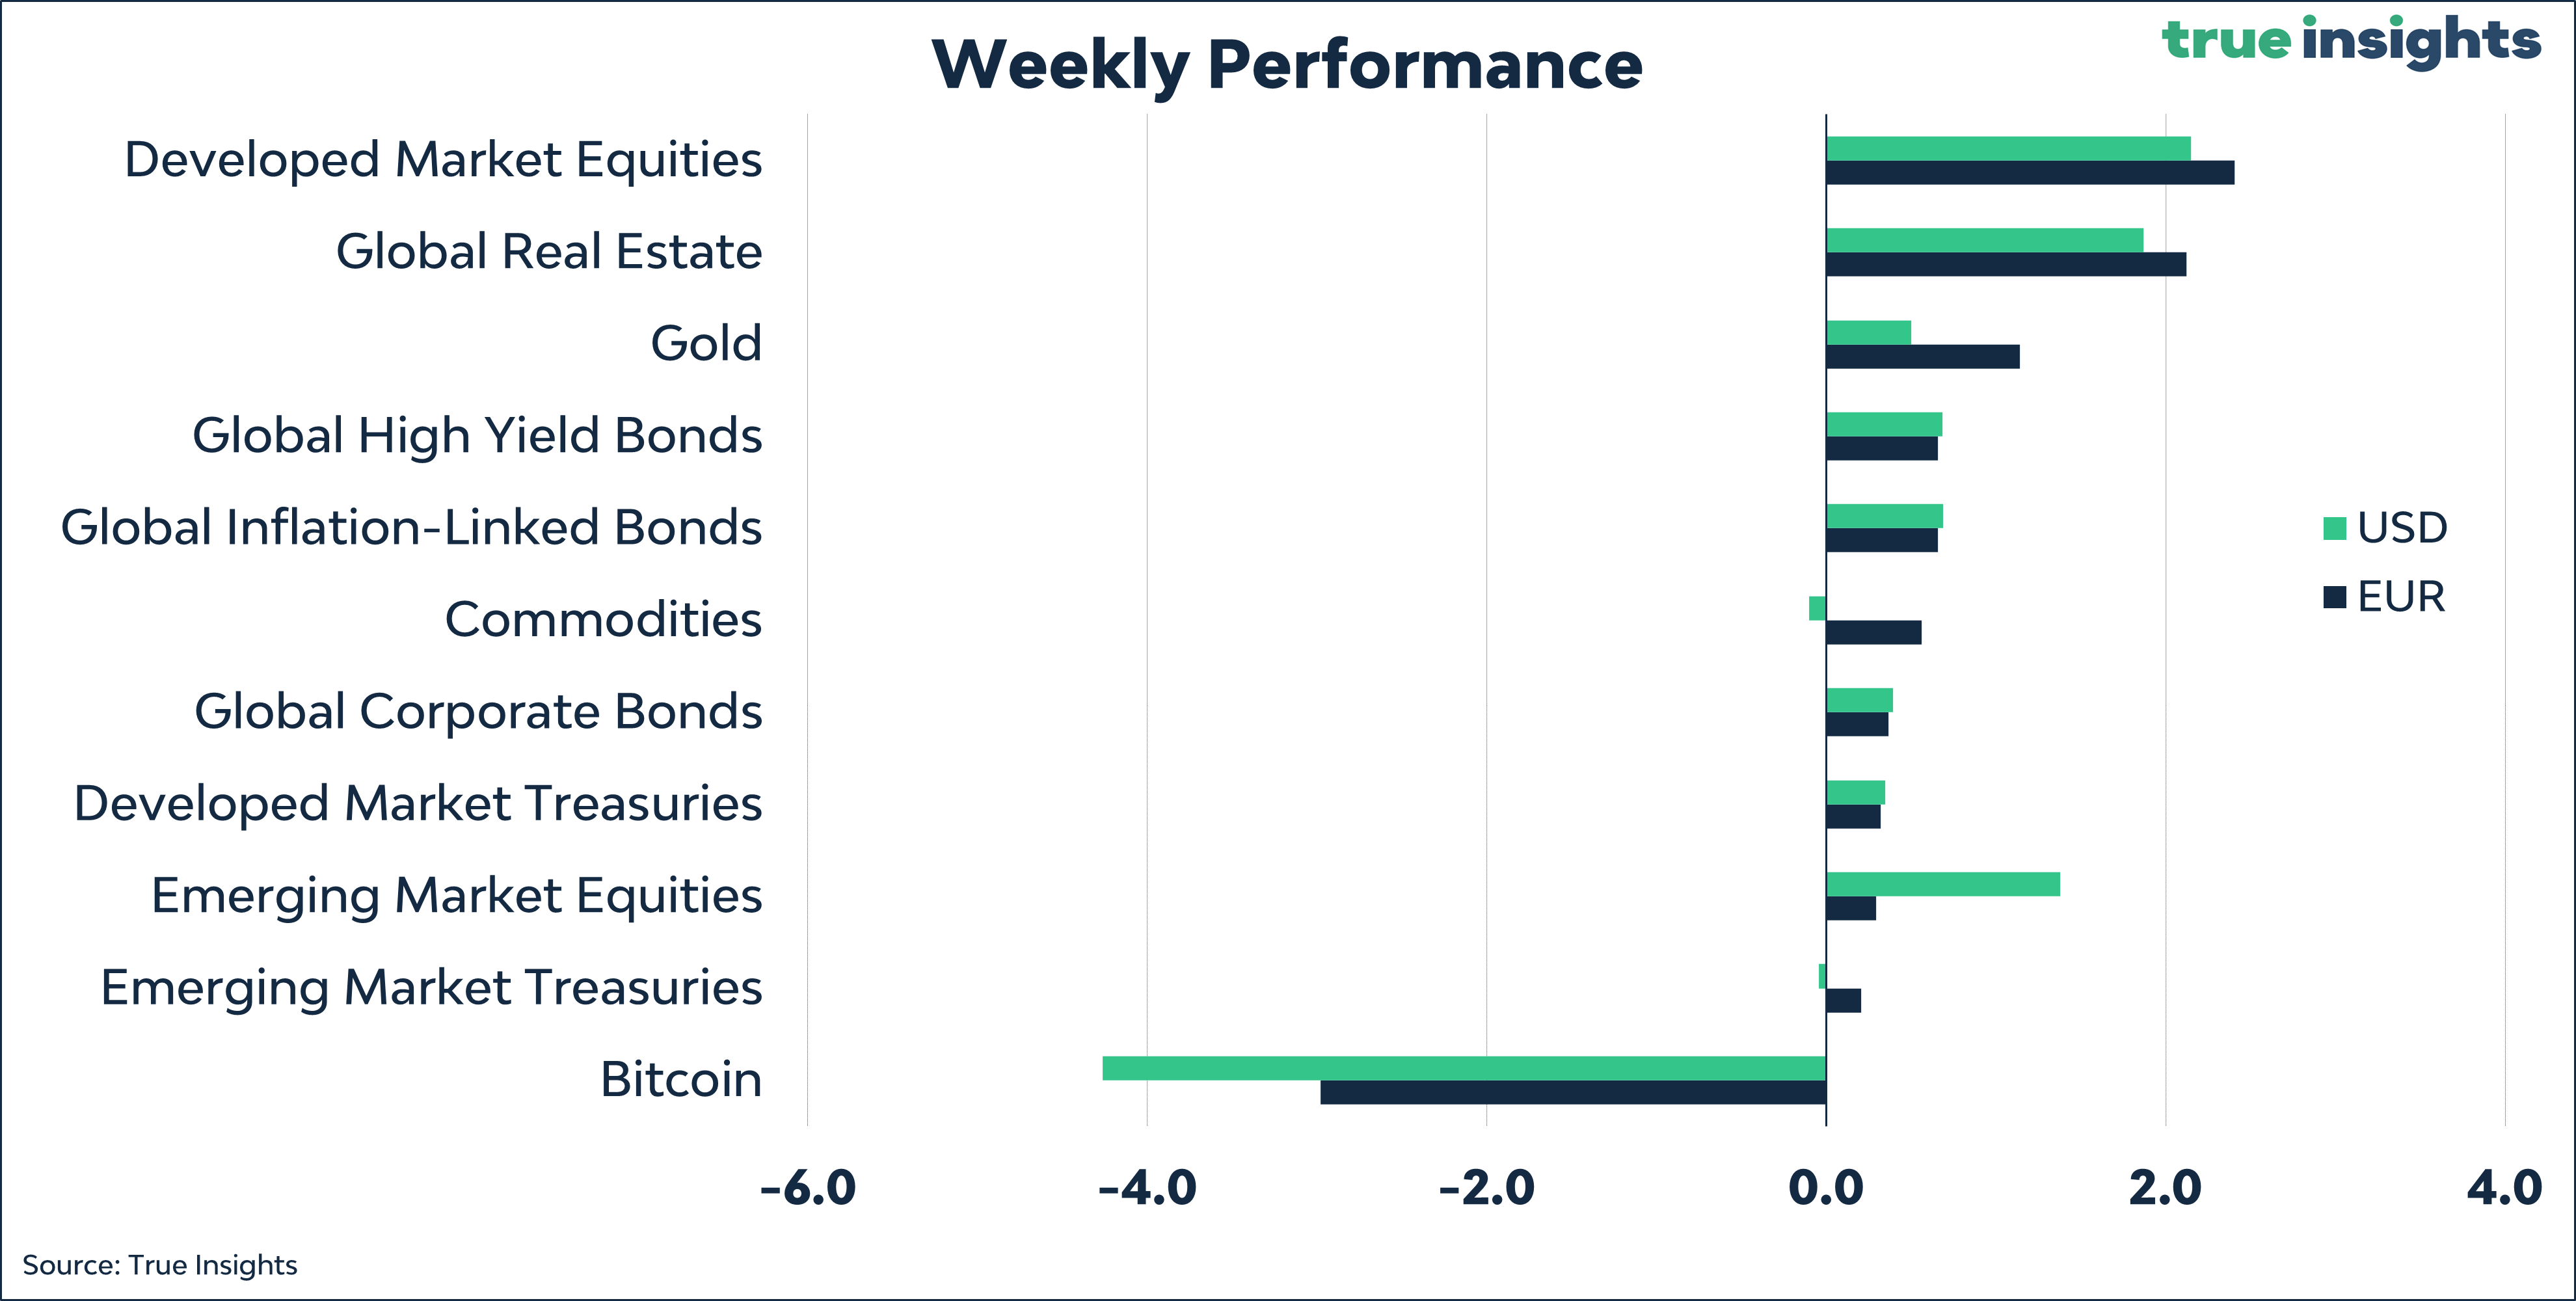
Investments highlighted: Euro, US dollar, Treasuries, S&P 500 Index, VIX Index, Gold, Bitcoin.
First things first! – Switzerland initiates the global synchronized easing cycle

The Swiss National Bank (SNB) has officially kicked off what will soon evolve into a global synchronized phase of monetary easing. Sooner than anticipated, interest rates in Switzerland were lowered from 1.75% to 1.50%. And yes, this brings Swiss interest rates already to extremely low levels.
MACRO
But what about inflation?
Economists quickly reached a flawed consensus. Switzerland can afford to lower interest rates now because inflation is expected to remain well below 2% at least until 2026, making it an exception compared to the Eurozone and the UK.

Wrong! Here’s the SNB’s definition of price stability: ‘The SNB equates price stability with a rise in the Swiss consumer price index (CPI) of less than 2% per annum. Additionally, ‘Deflation, i.e., a sustained decrease in the price level, also breaches the objective of price stability.’ In other words, the SNB is perfectly on target for the coming years, allowing for a reduction in interest rates.
That’s not all. Below is a chart showing the trend of headline inflation in the Eurozone, Switzerland, and the UK. Switzerland consistently exhibits lower inflation than the rest of Europe.

The case for interest rate cuts by the ECB and the Bank of England, where policy rates are significantly higher, becomes even stronger when considering average inflation numbers. Below are those for the periods since 2000 and since 2009.

Switzerland has minimal inflation, which is precisely why the SNB targets a lower inflation rate. The difference between Switzerland and the Eurozone and the UK is substantial. But here’s the kicker: Based on the current inflation figures of 1.2% (Switzerland), 2.6% (Eurozone), and 3.4% (UK), the differences are almost identical to the average inflation difference since 2000 and smaller(!) than the average difference since 2009.
Thus, even though the Bank of England and the ECB might resist for a while, little stands in their way (except for soaring inflation) to ease some of the tightening effects of their policies.
Bank of England
The Bank of England is, in fact, preparing to start cutting rates. In March, the last two hawks opting for another rate hike vanished, marking the first time since September 2021 that no advocate for higher rates remained.

Of course, Governor Bailey gave his standard spiel about it being too soon, but the direction of thought is abundantly clear.

Powell: I like big sheets and cannot lie!
I’ve covered this extensively in my Wednesday post, but Powell & Co. are also eager to cut rates. Therefore, despite unfavorable inflation figures, they’ve kept three rate cuts for this year in the new dot plot. The forecasts for 2025 and 2026 (one less rate cut per year) should be disregarded. No central banker, economist, or investor can look ahead for more than a couple of months. More about the Fed’s interest rate decision here.

But holding on to three rate cuts wasn’t enough for Powell. He further confirmed the Fed’s increasing influence on financial markets by promising them a permanently large Fed balance sheet. As I wrote:
‘Slowing down the reduction of the balance sheet is imminent, though. Powell is wary of facing a short-reserves situation again and aims to transition from abundant liquidity to ample liquidity…While I truly believe that Powell thinks slowing balance sheet compression does not imply a higher terminal level, the likelihood of exactly that outcome is quite high. The Fed increasingly requires flexibility and liquidity to achieve its goals, and Powell made it abundantly clear he likes his balance sheet ‘big.’

Powell’s balance sheet comments caused gold to soar to a new all-time high. By the way, this rhetoric applies as much to the Fed as to the ECB. Excess liquidity is and will remain ample.

Connecting the dots

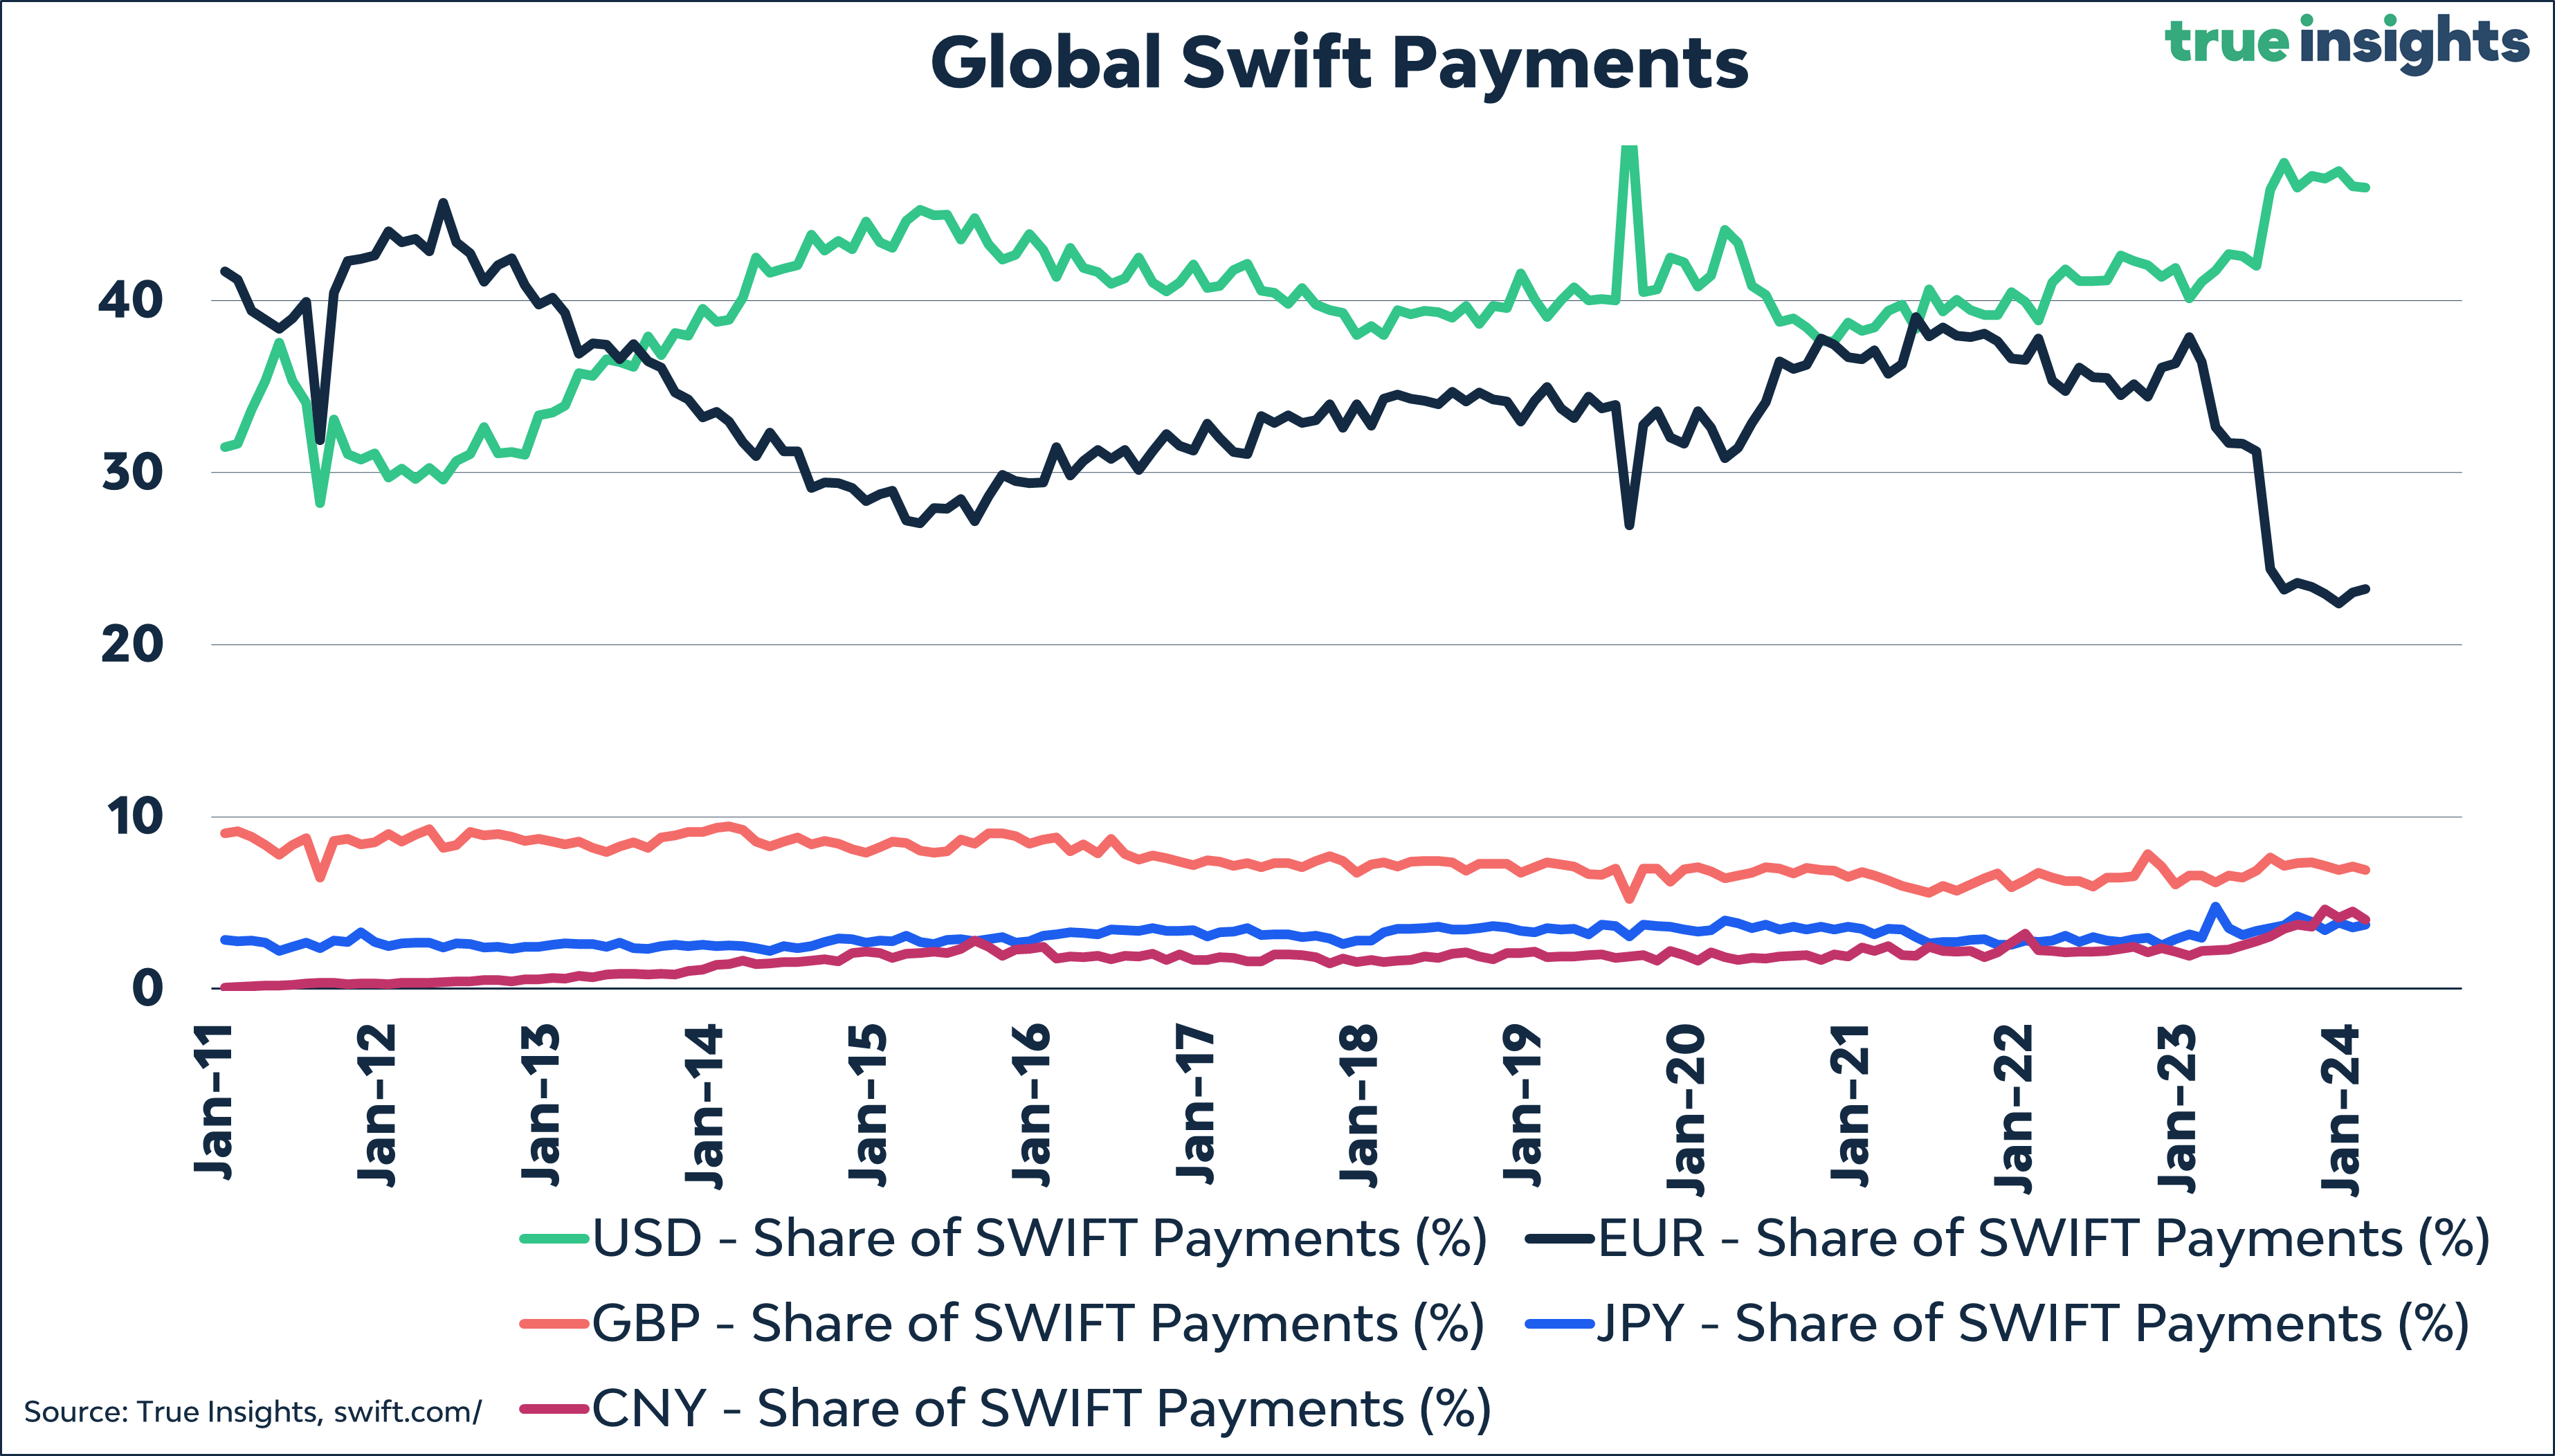
Even though an increasing number of investors doubt their currency, the US dollar is not the problem. The greenback remains the go-to currency for building reserves, holding assets, and conducting financial transactions. However, the US dollar has become a ‘product’ of the policies needed to prevent the ever-expanding debt from leading to a financial system implosion.
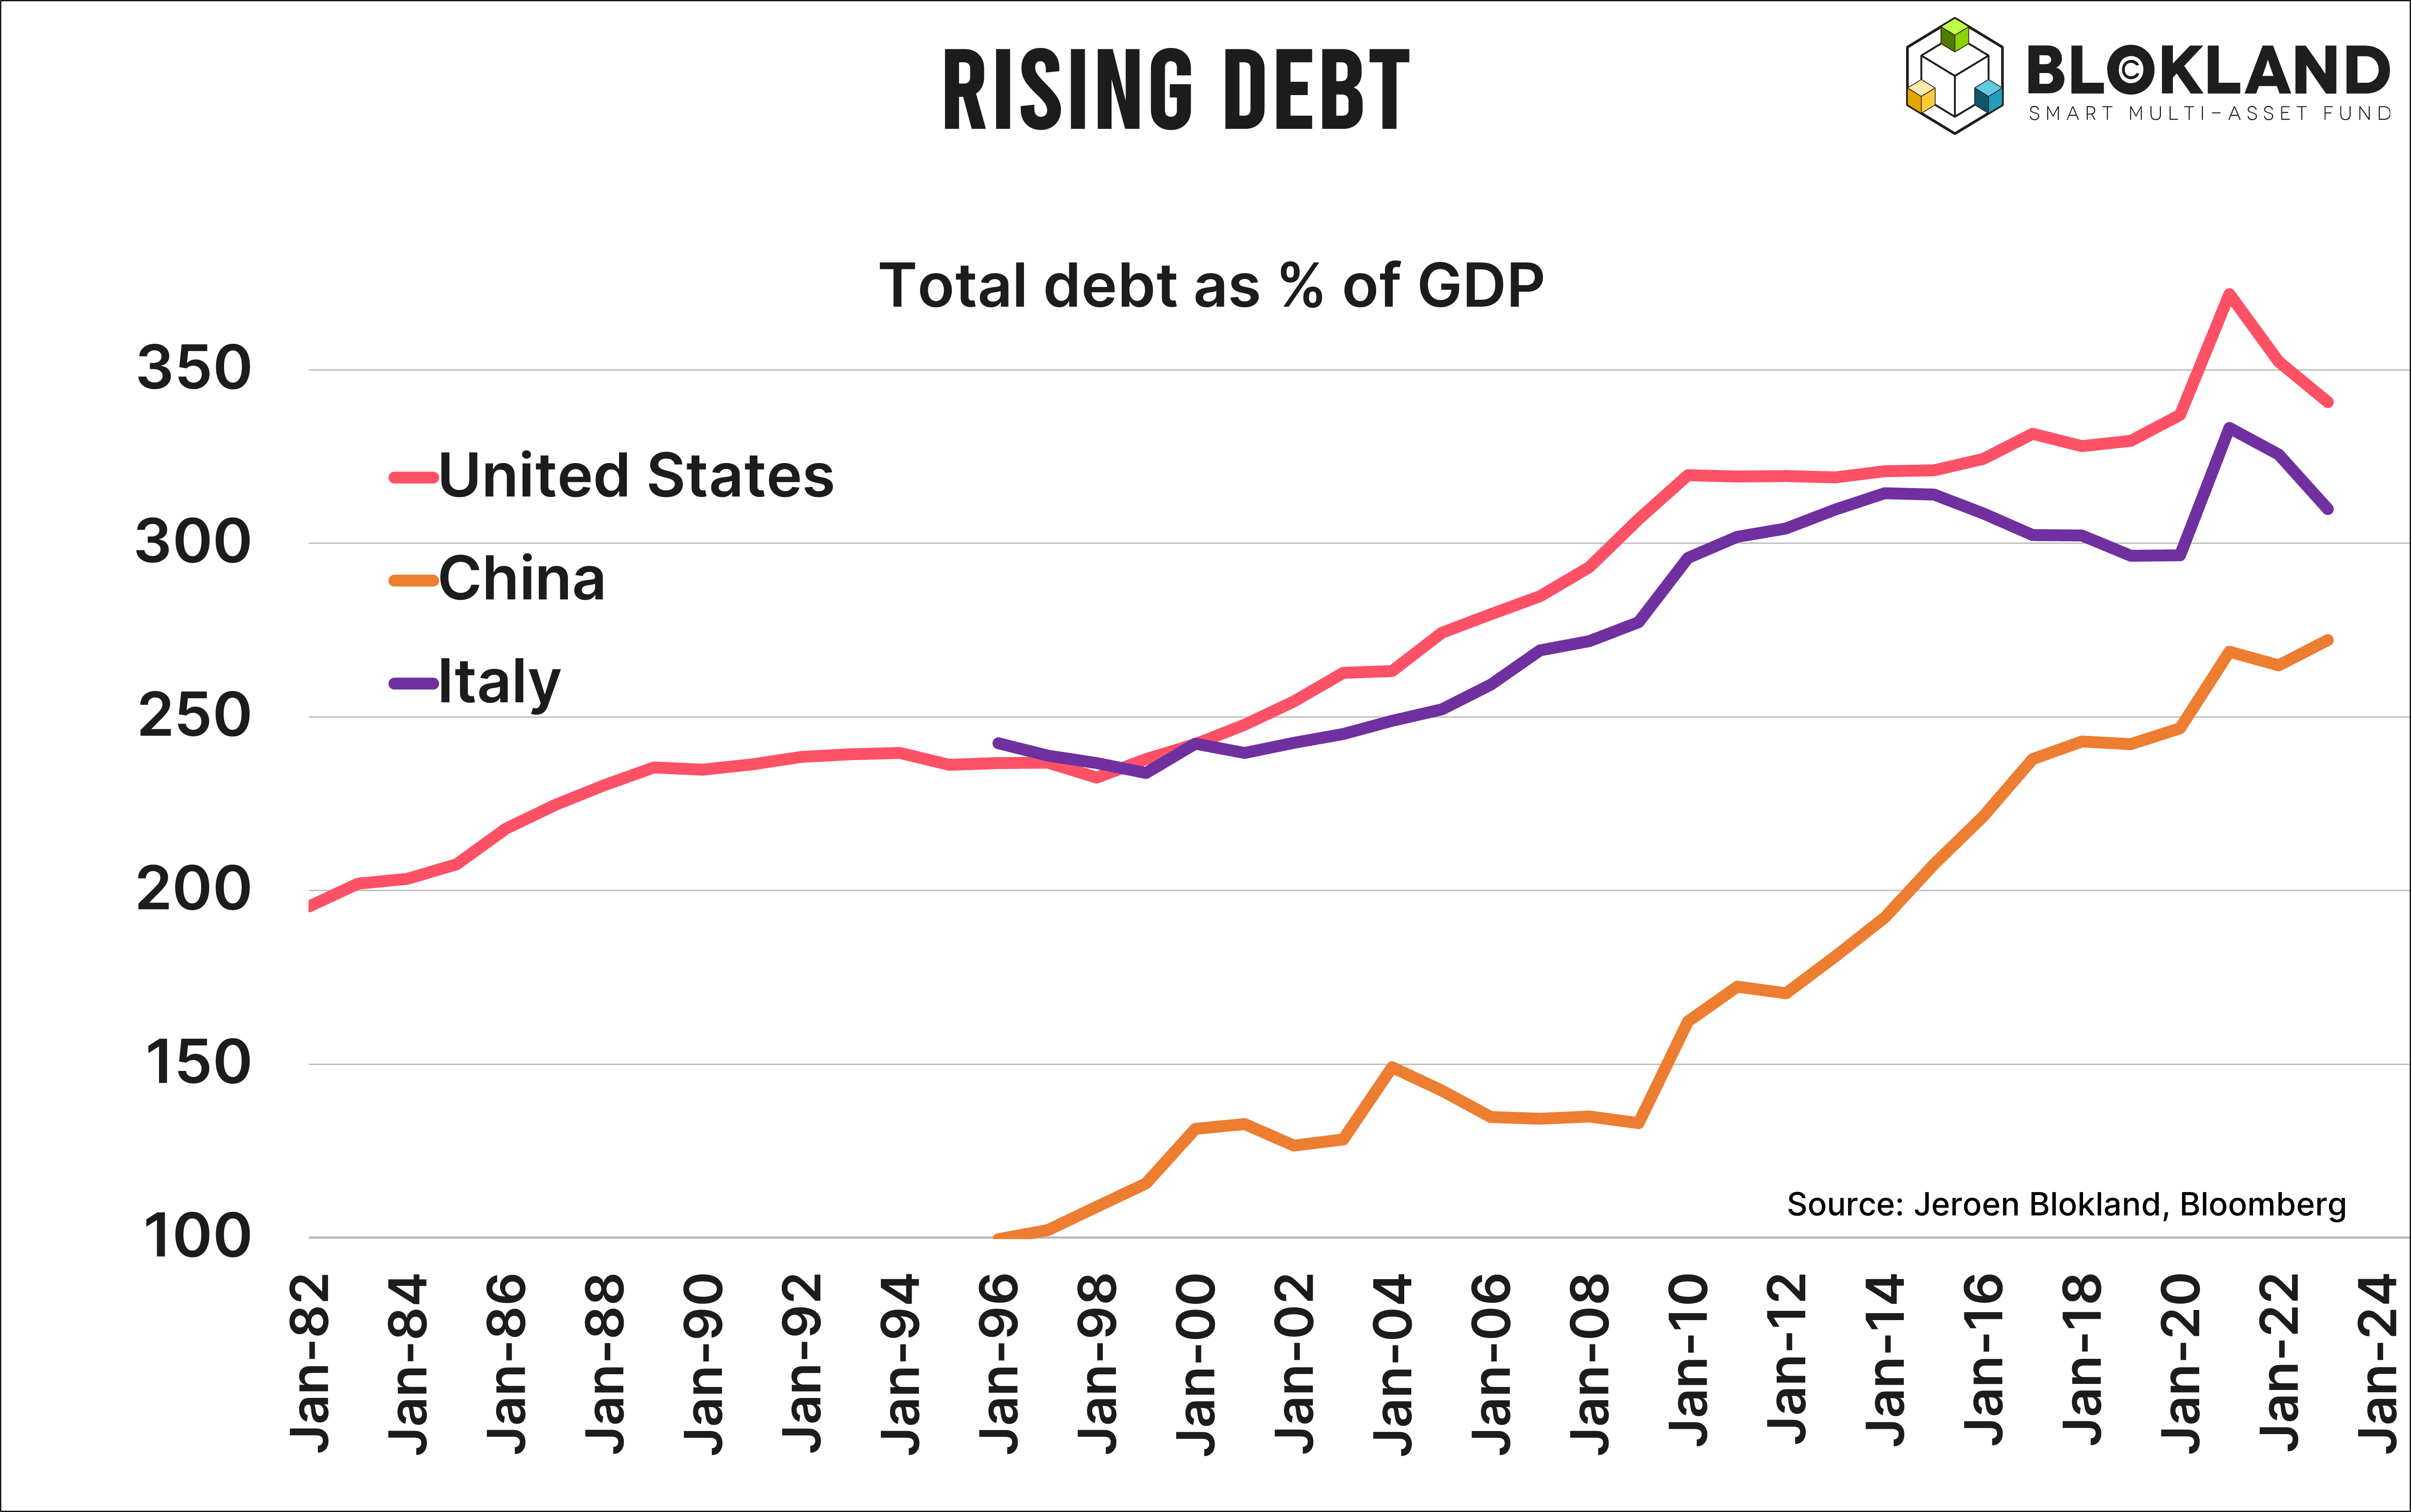
Why else would the Fed (and other central banks) already aim to lower interest rates amidst full employment and inflation still above the target? Also, bear in mind that this inflation target is likely to be diluted. With the argument that current interest rates are significantly restrictive – and they are, with a total debt-to-GDP ratio above 300% – rates will start decreasing even with inflation levels just under 3% or perhaps even higher.
MOVE over VIX
This leads me directly to the next point. Investors would do well to pay attention to the MOVE index alongside the VIX – which is often used solely as the leading indicator of market fear. The decoupling of the MOVE and VIX Indexes over the past few years is no coincidence, considering the massive debt, central bank policies, and the increasing pressure on the collateral value of (US) Treasuries.
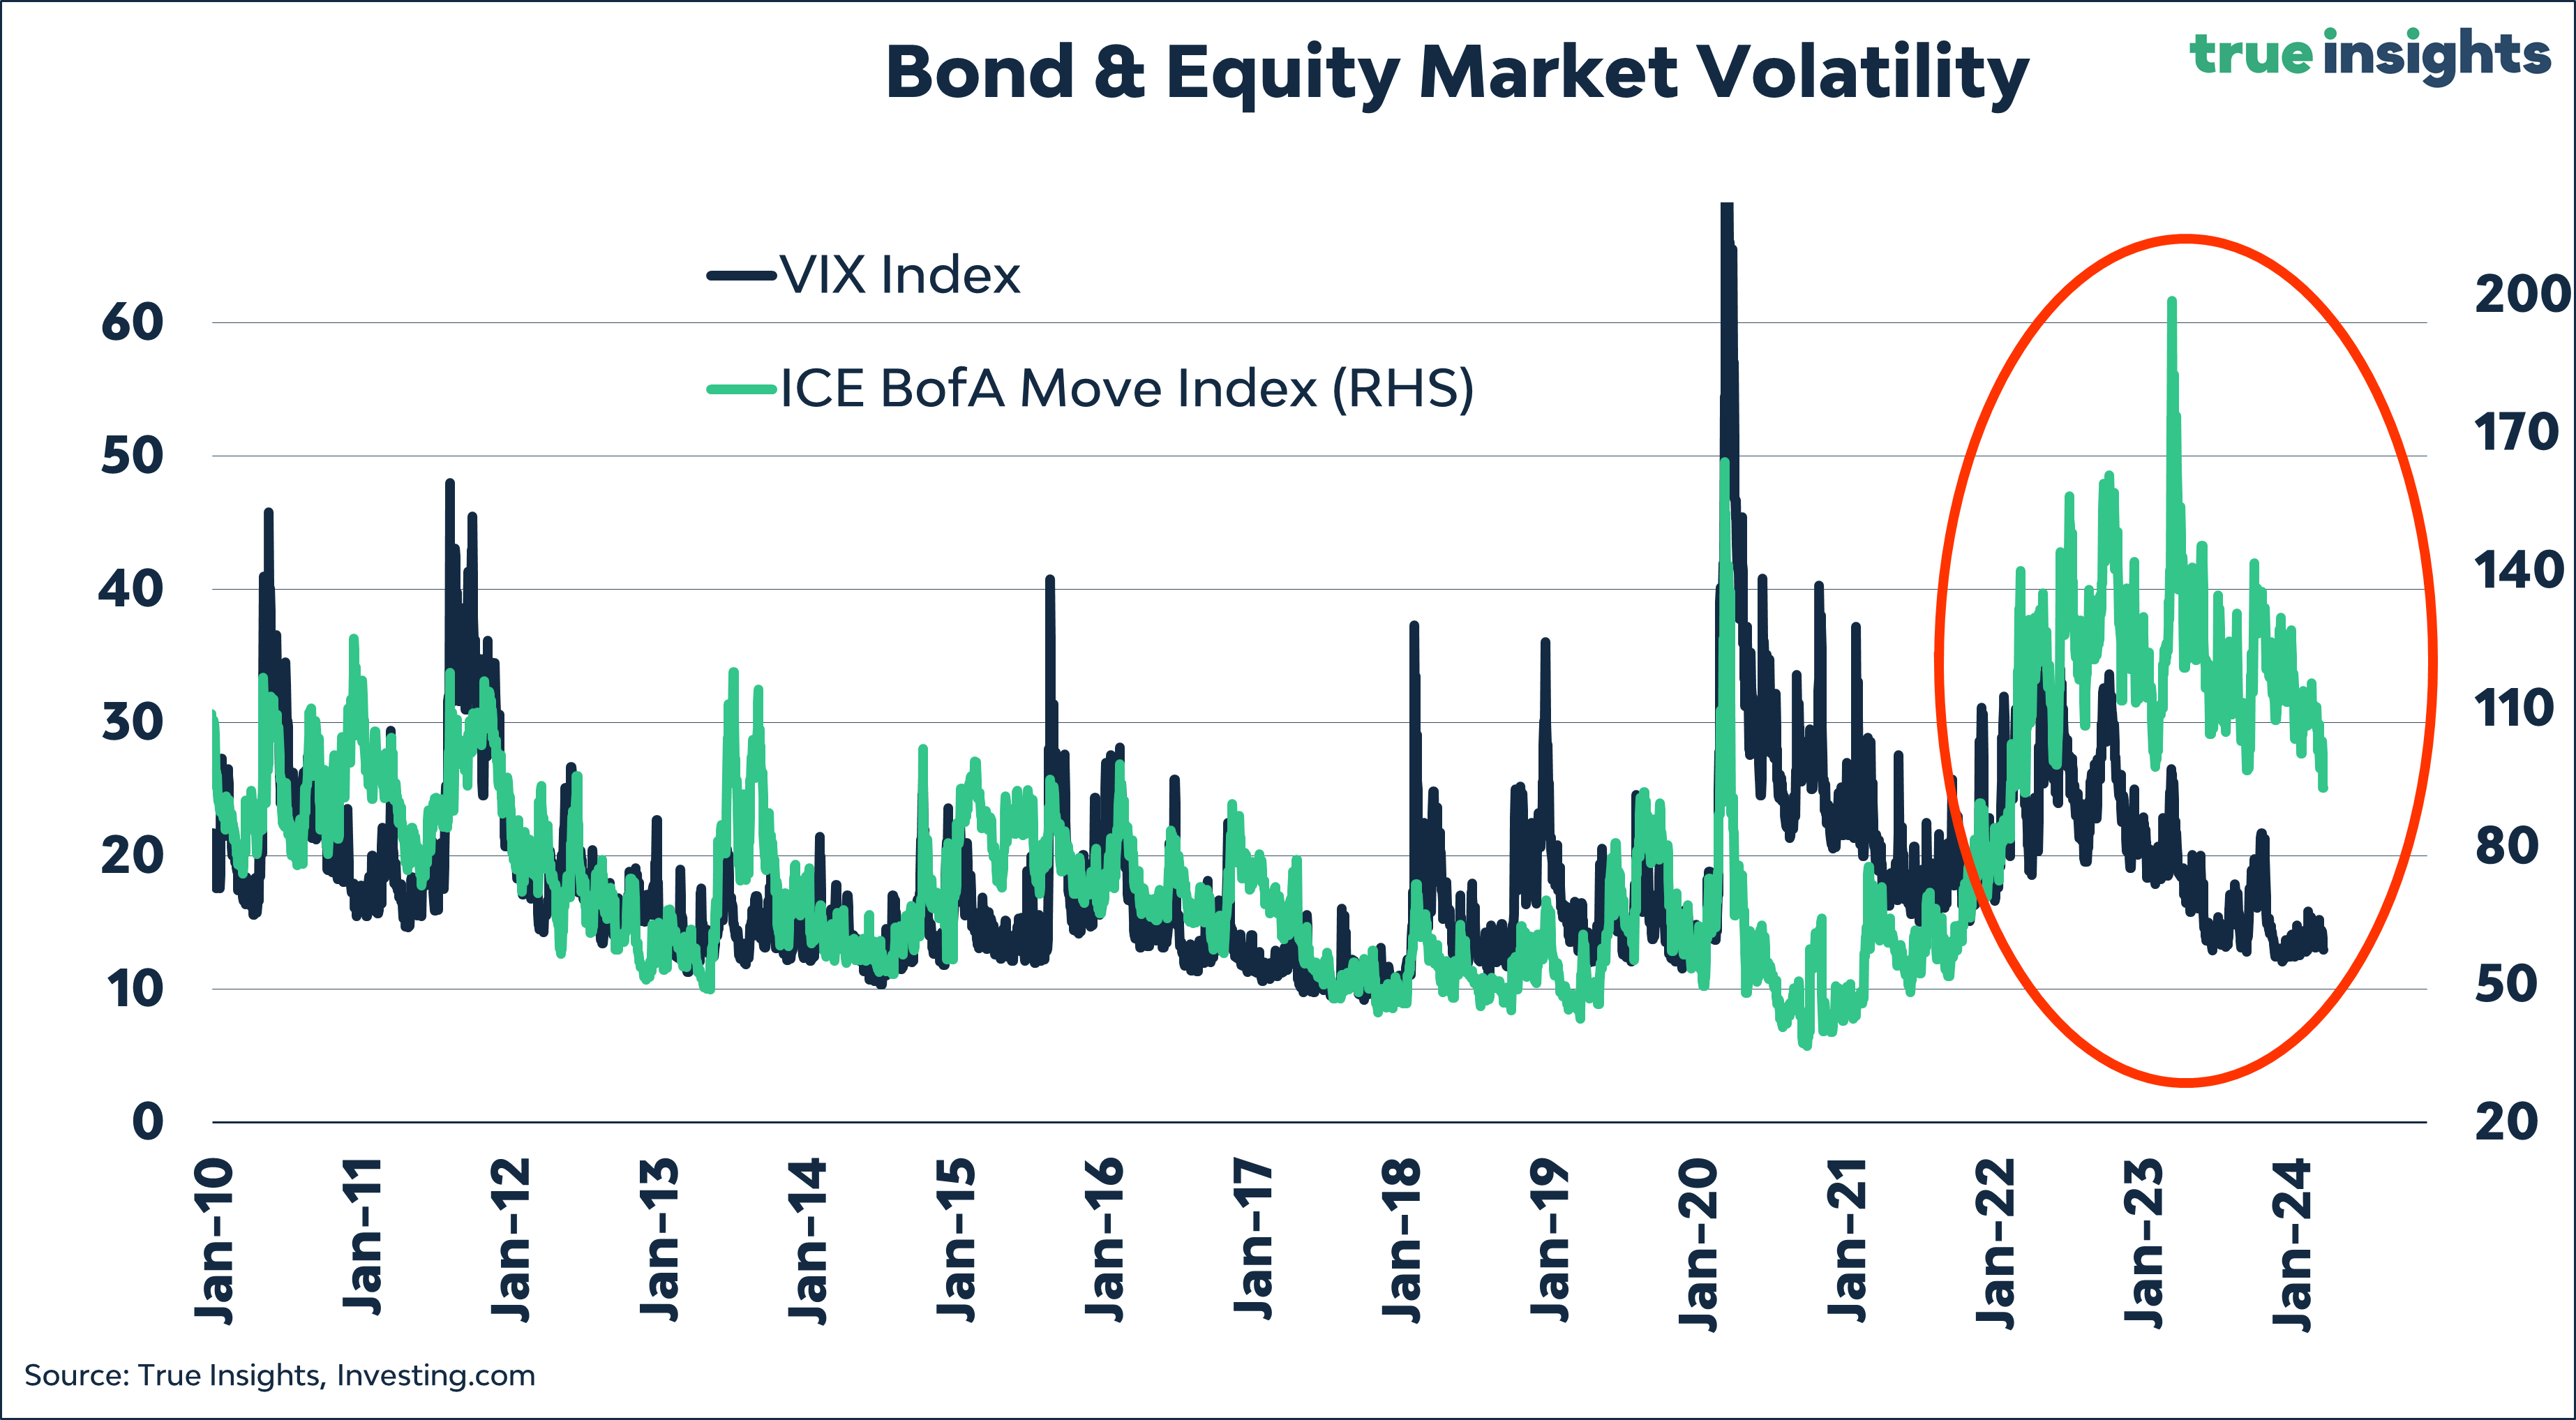
Just look at how much riskier bonds have become regarding realized volatility. Stocks are now less than three times as volatile as bonds, whereas they used to be, on average, five times as much.

A New Regime
I have repeatedly highlighted this structurally higher bond volatility, especially in the long term (short term, interest rate cuts may reduce volatility as they increase nominal returns) to advocate for reducing the weight of (government) bonds. Long-term interest rates simply cannot remain high without putting immediate pressure on the financial system and the global economy.
Watch that Gold – Bond Performance Chart
It’s also no coincidence that the gold price reached a new all-time high during the Powell press conference. Gold is winning the race as a store of value and an insurance premium outside the debt and central bank-dominated financial system, against increasingly thin cash flows and greater volatility from bonds. The chart below confirms this.

Once again, bonds may (briefly) shine if interest rates drop sharply, but they are less attractive in the long term.
And What About Japan?
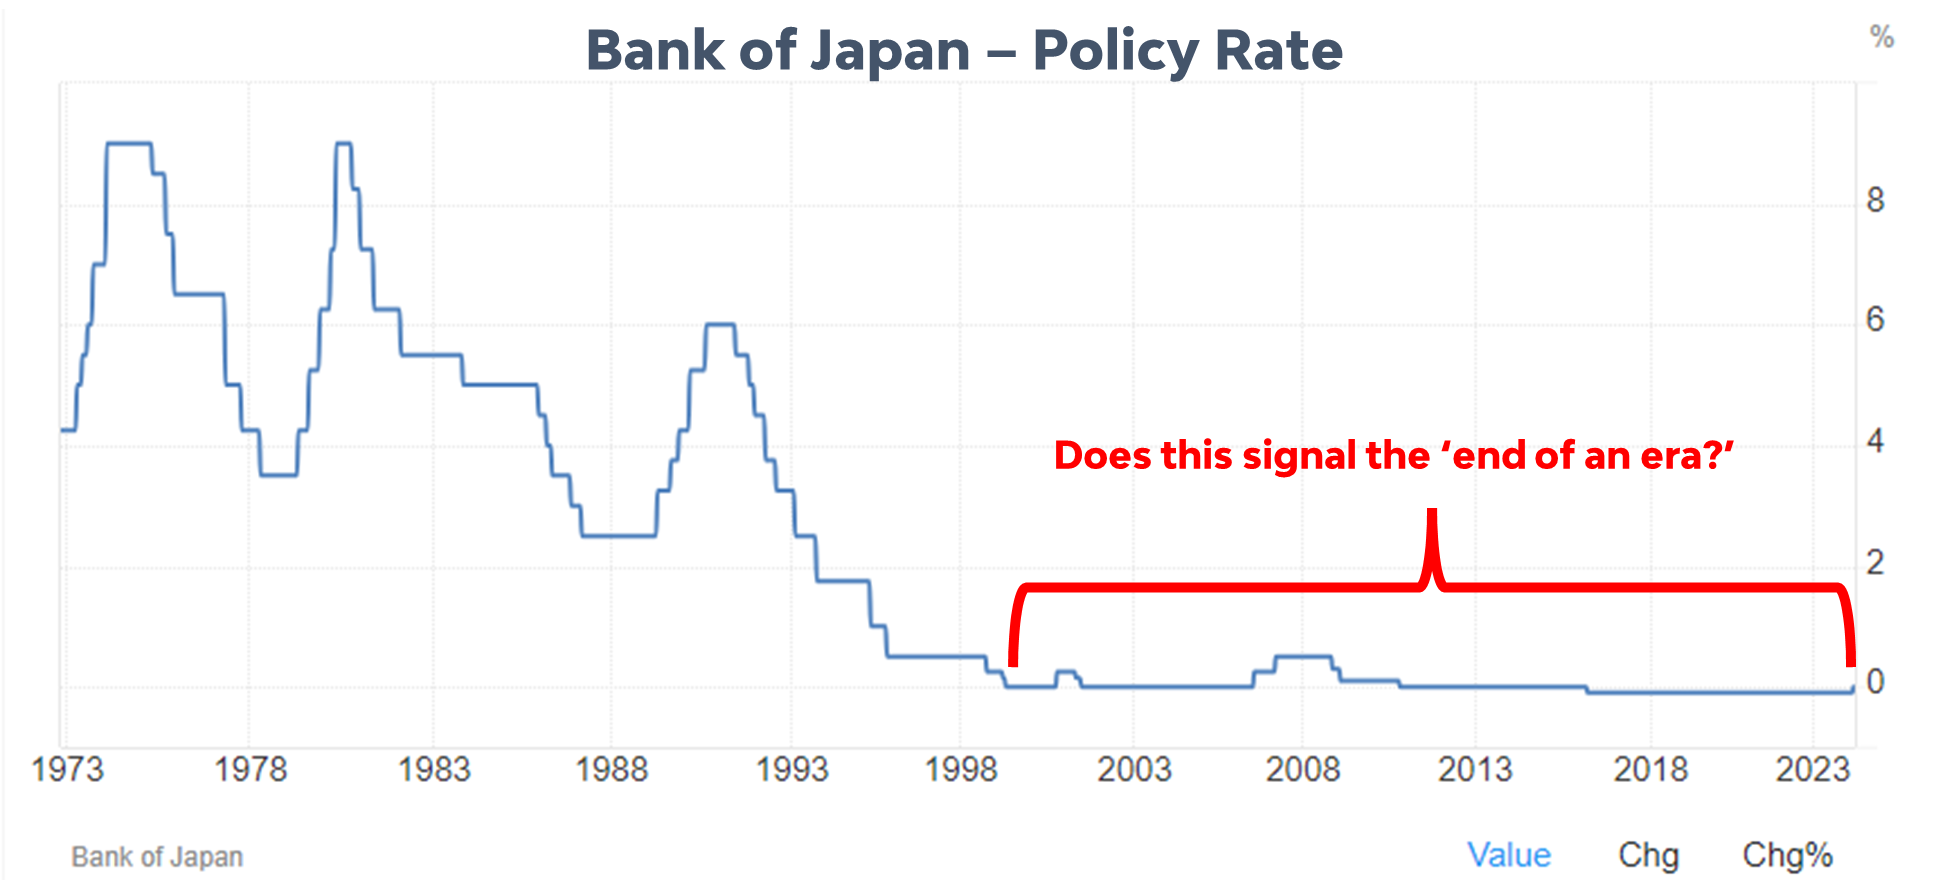
As I explained earlier this week, the Bank of Japan’s interest rate hike is not the ‘end of an era.’ It’s rather a step towards ending negative interest rates, which typically cause many problems. As I wrote: ‘It’s not justifiable to conclude that we’re entering a different central bank regime, especially from the perspective of the Bank of Japan. The chart below from Trading Economics (with my added red arrow and text) clearly illustrates Japan’s 25-year stint in the same regime: ultra-low policy rates, with the recent addition of negative rates. The Bank of Japan holds nearly half of all outstanding Japanese government debt. Ueda during the Bank of Japan press conference: ‘No specific idea on what to do with the balance sheet now.’

More on the Bank of Japan’s decision here.
Conclusion: Adapt to the New Paradigm
This week’s central bank action summarized:
One major central bank (SNB) initiated what will soon be a global synchronized monetary easing cycle.
The largest and most crucial central bank (Federal Reserve) is sticking to three rate cuts this year despite higher-than-expected inflation and full employment.
The Chairman of the world’s largest central bank confirmed the need for a massive balance sheet to meet the financial system’s liquidity and reserve requirements.
The disappearance of the last rate hike hawks (Bank of England)

And one rate hike (Bank of Japan) to zero after eight years of Negative Interest Rate Policy with zero incentive to shrink a balance sheet that holds nearly 50% of all the nation’s outstanding debt.
Implications: If you haven’t already, allocate part of your portfolio to alternative investments, preferably scarce ones. Consider gold and Bitcoin, but real estate and commodities also provide additional diversification. The central banks’ policies, led by the SNB’s first rate cut, unequivocally confirm that central banks are here to sustain the unsustainable debt-driven economy as long as possible.
Other Macro News
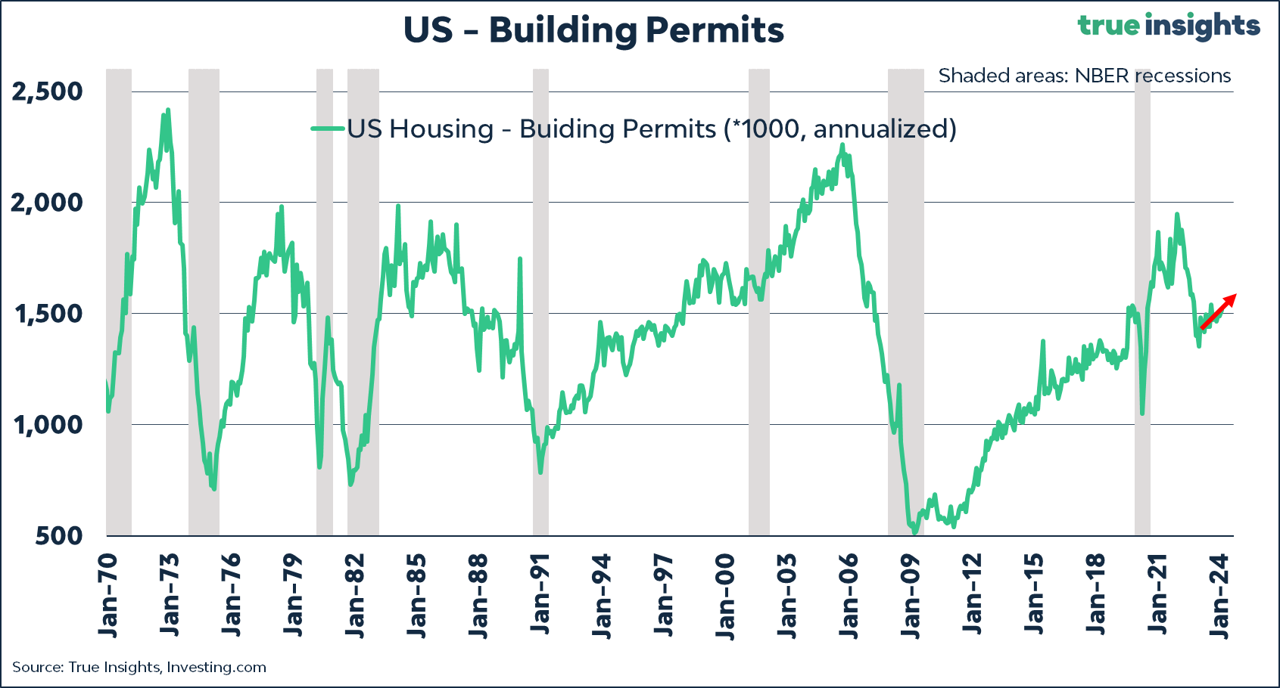
Building Permits
US building permits, a key recession indicator, are 12% off their low. While existing home sales are important for prices, building permits (and housing starts) are a better measure of economic activity.
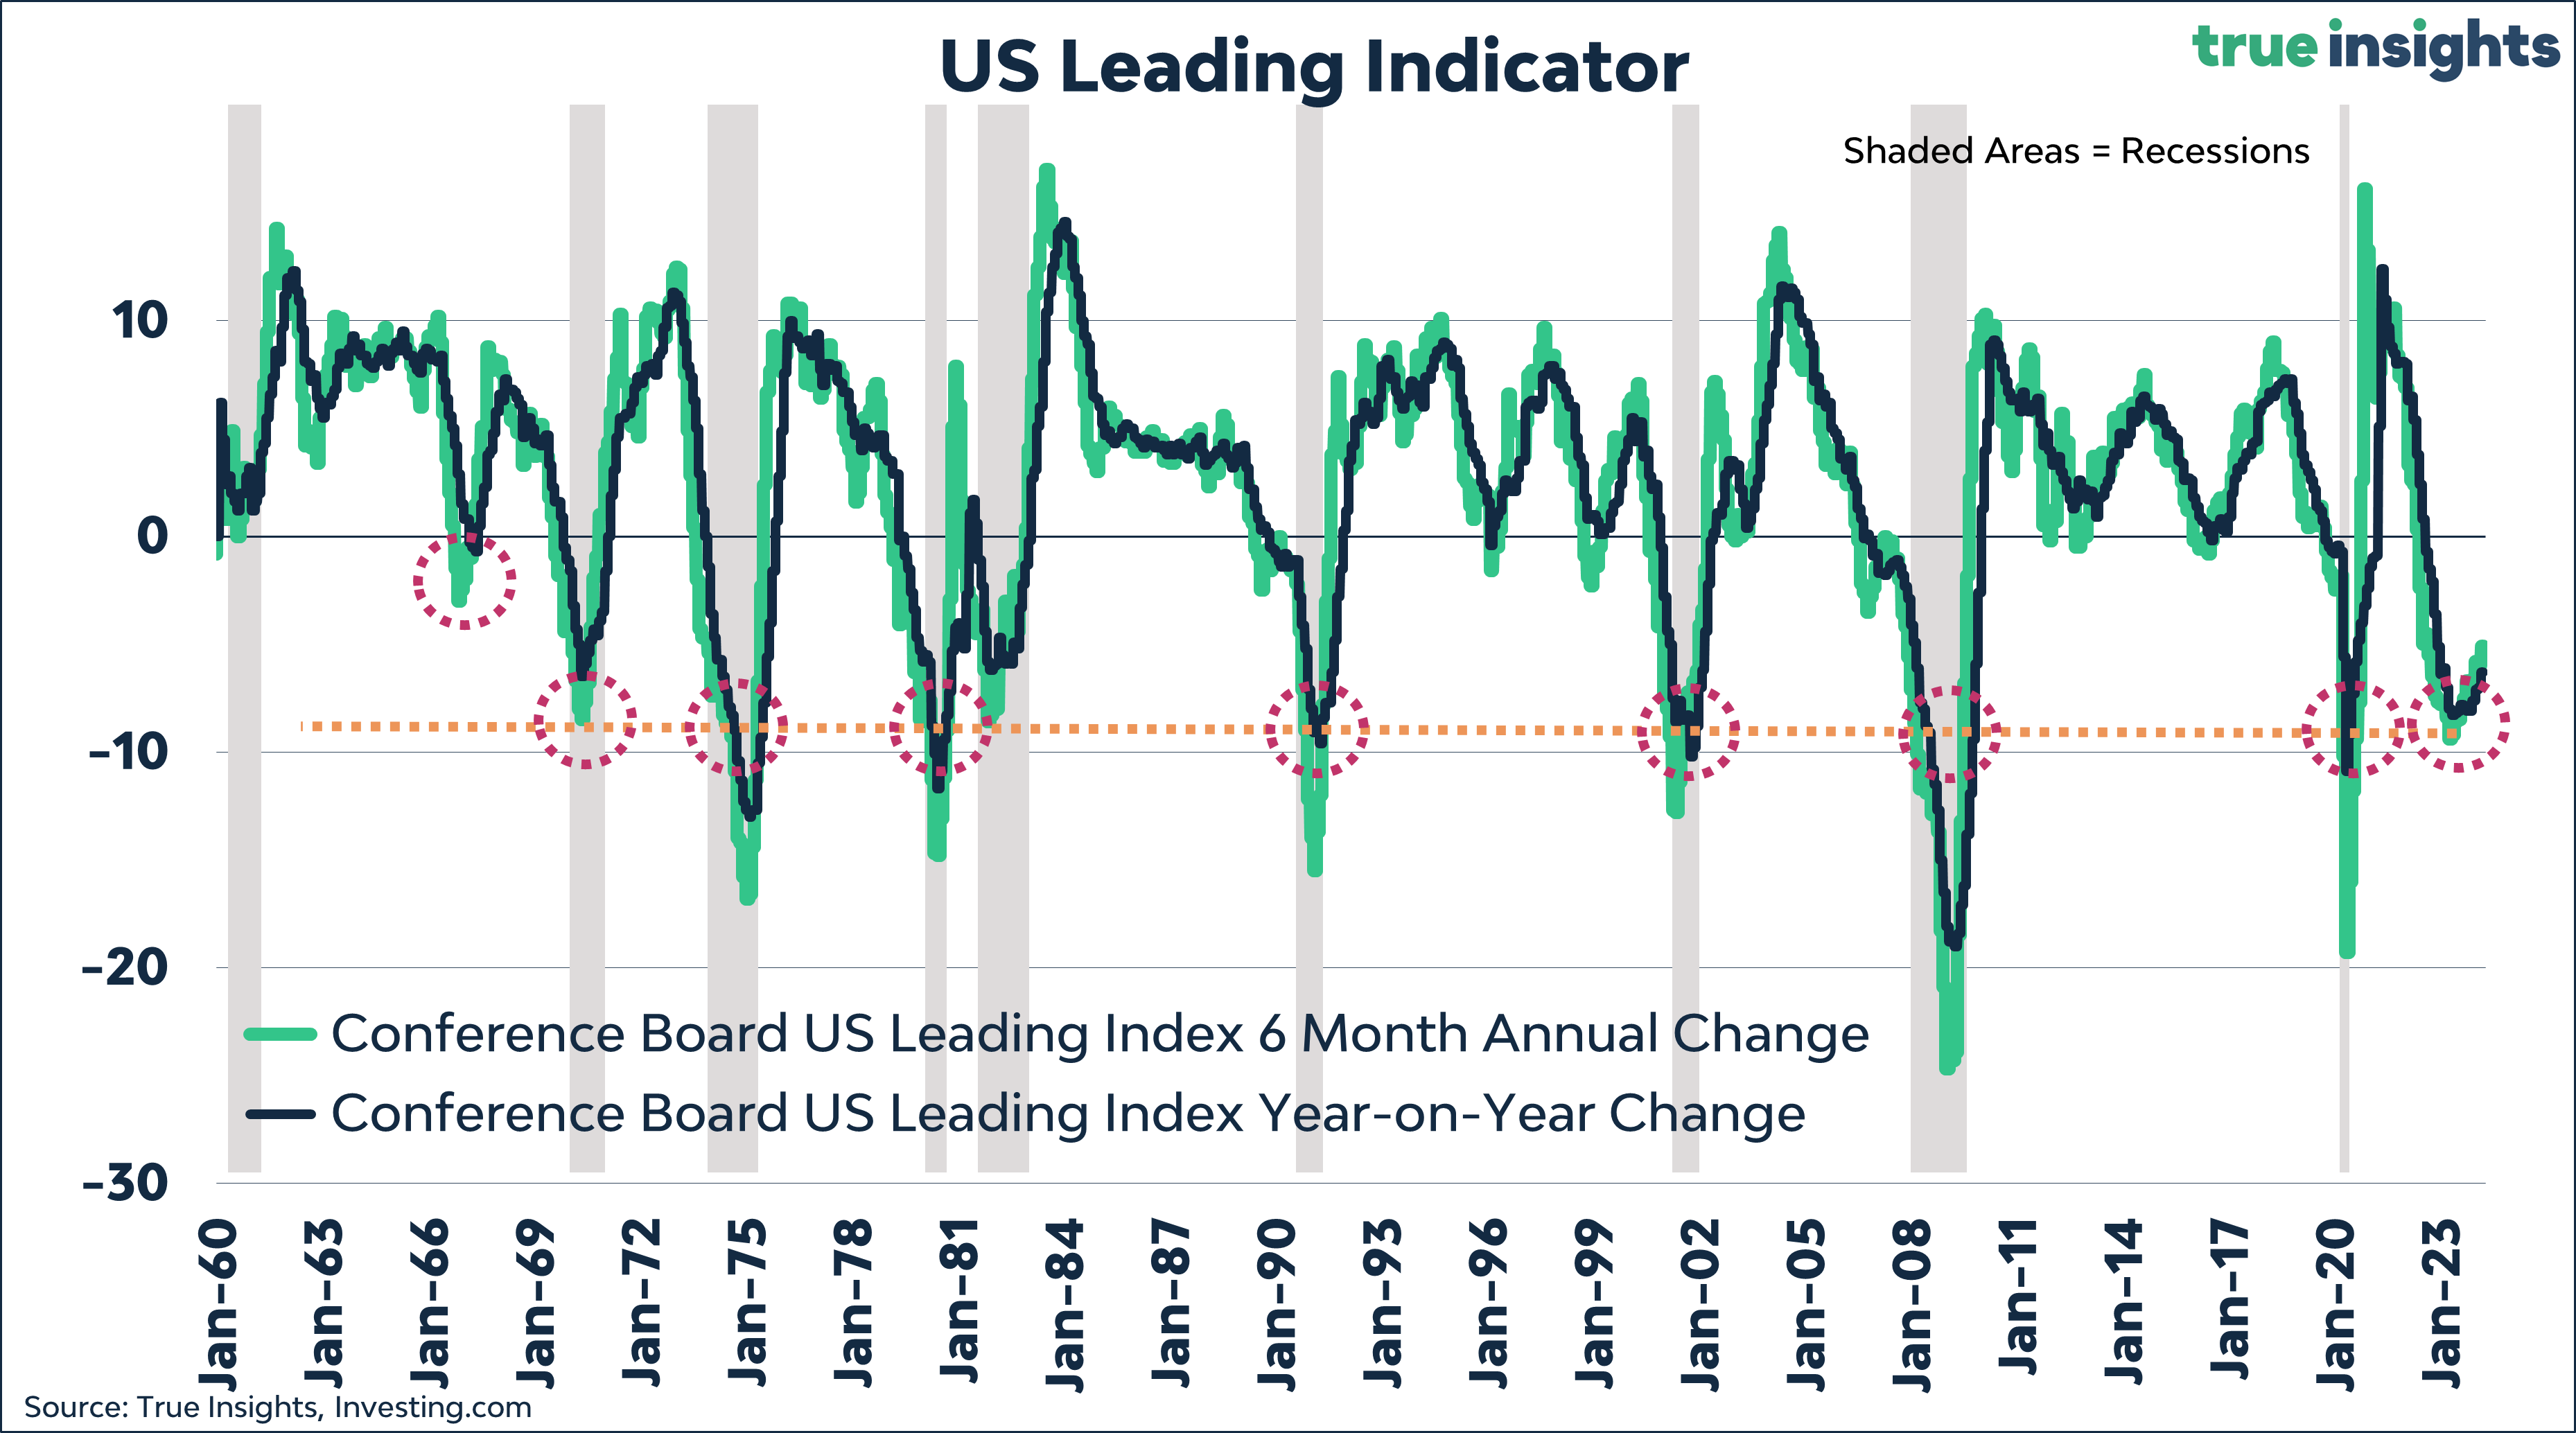
Leading Indicator – Beyond the Recession?
The US Leading Indicator rose for the first time in two years(!) in February.
Looking at the 6- and 12-month changes, this remains a questionable case, leaving room for debate on whether we have experienced a mild recession.
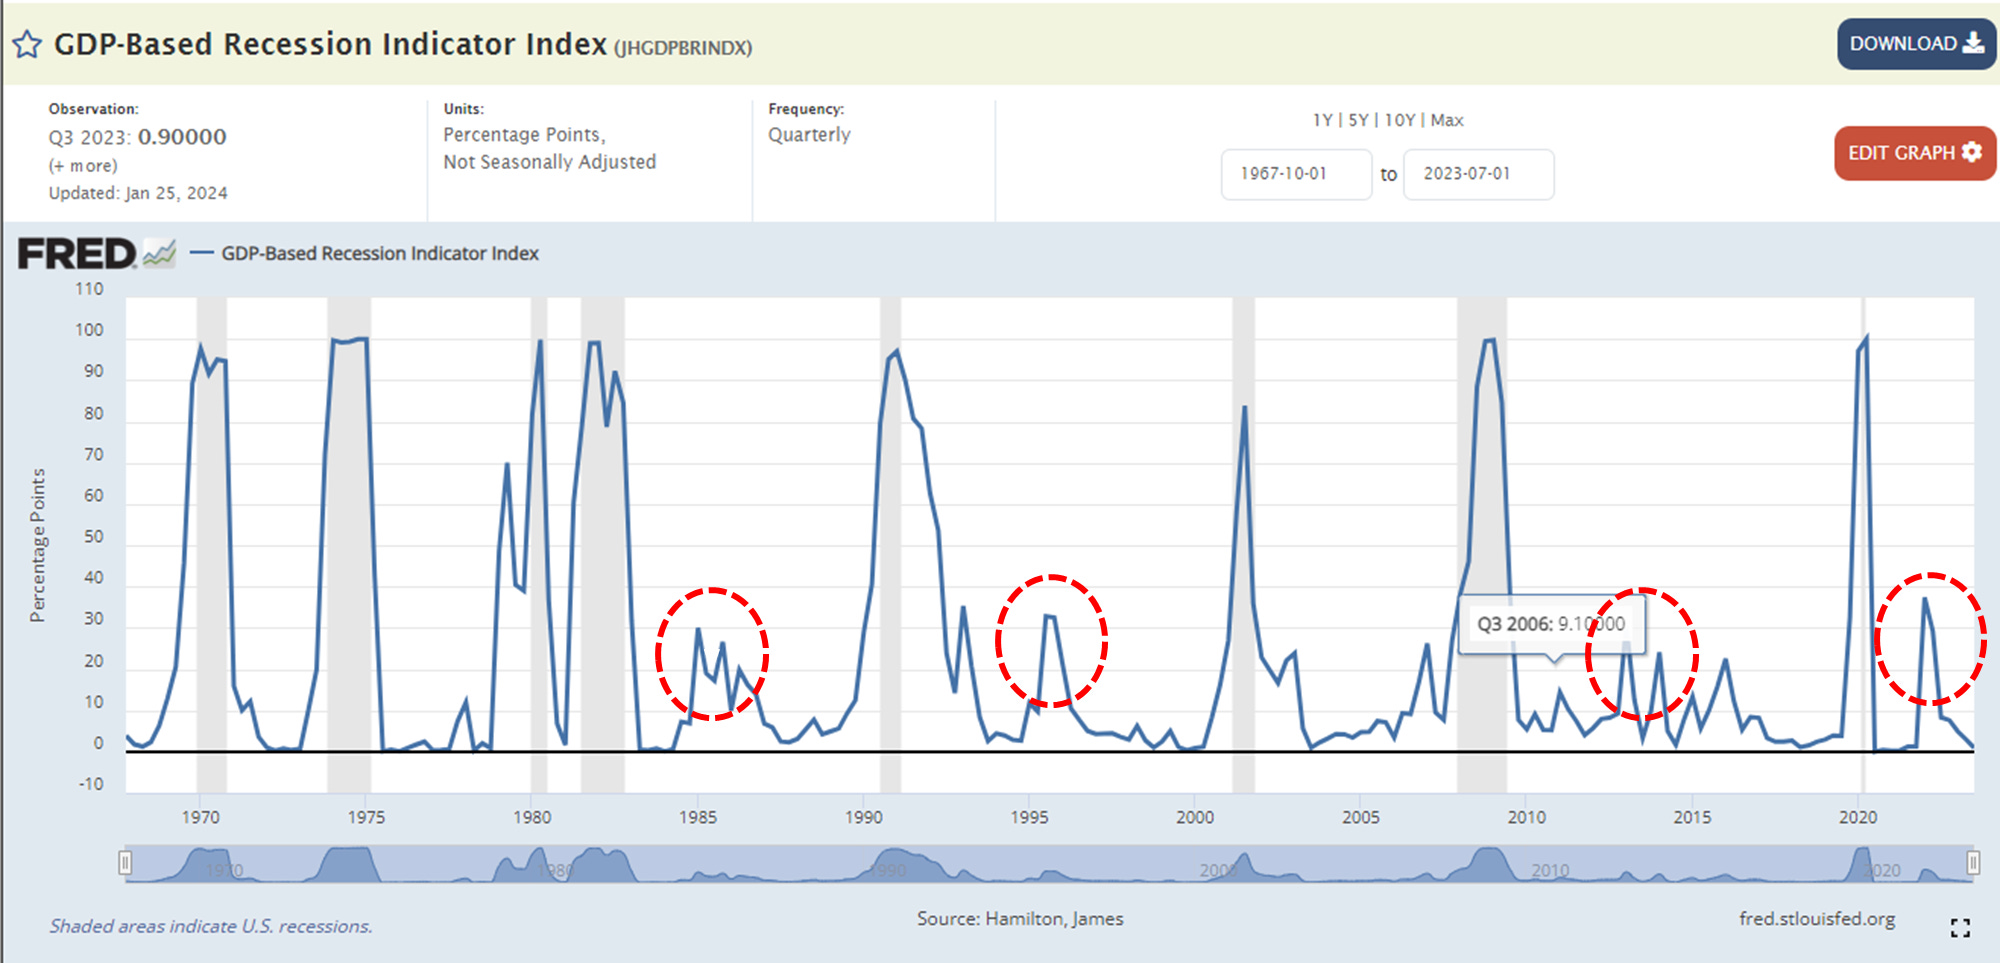
Recession Indicator – No Recession?
Here’s an example suggesting there might not have been or will be a recession at all.
Yield Curve: This Time is Different?
And then there’s the most famous recession forecaster. The Yield Curve is now the longest inverted without a recession occurring.
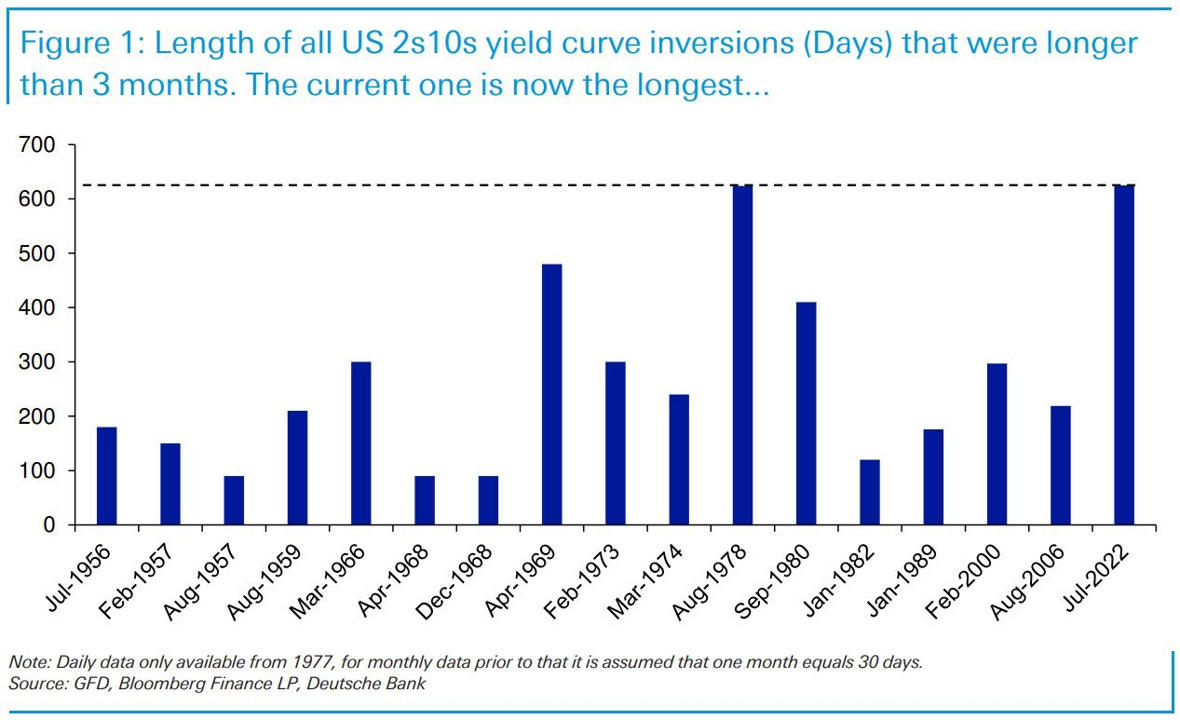
The caveat is that in the past, the recession only came after the yield curve uninverted.
Could This Be a New Cycle?
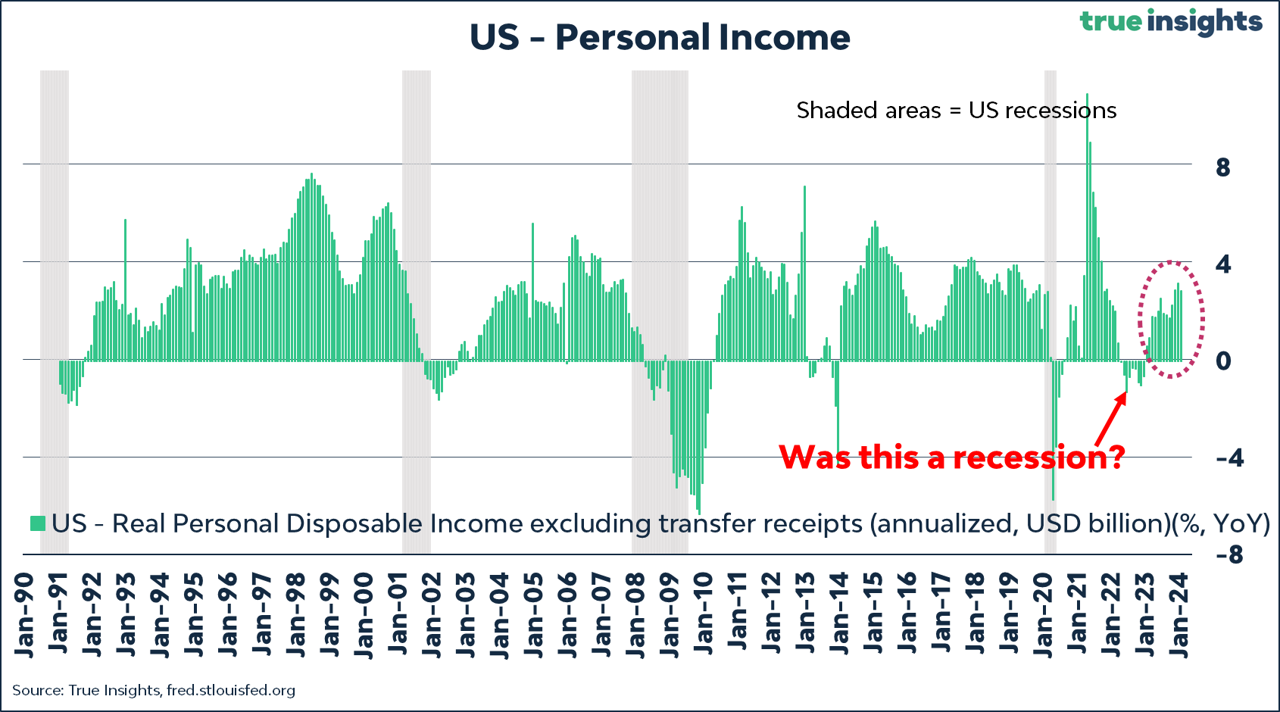
Adding the charts above to the numerous macro indicators suggesting the US recession has already occurred (2022, two quarters of negative GDP growth, a residential housing investment bust, a decline in real disposable income, etc.), and we may well be in the first innings of a new economic cycle propelled by another wave of (central bank) liquidity.
What if I’m wrong? If we do get a recession (the yield curve and labor market still allow for one), expect central banks to launch a massive easing cycle. If they’re ready to cut rates when the US economy is booming, and inflation is still too high, imagine what they will do in a recession.
Sentiment
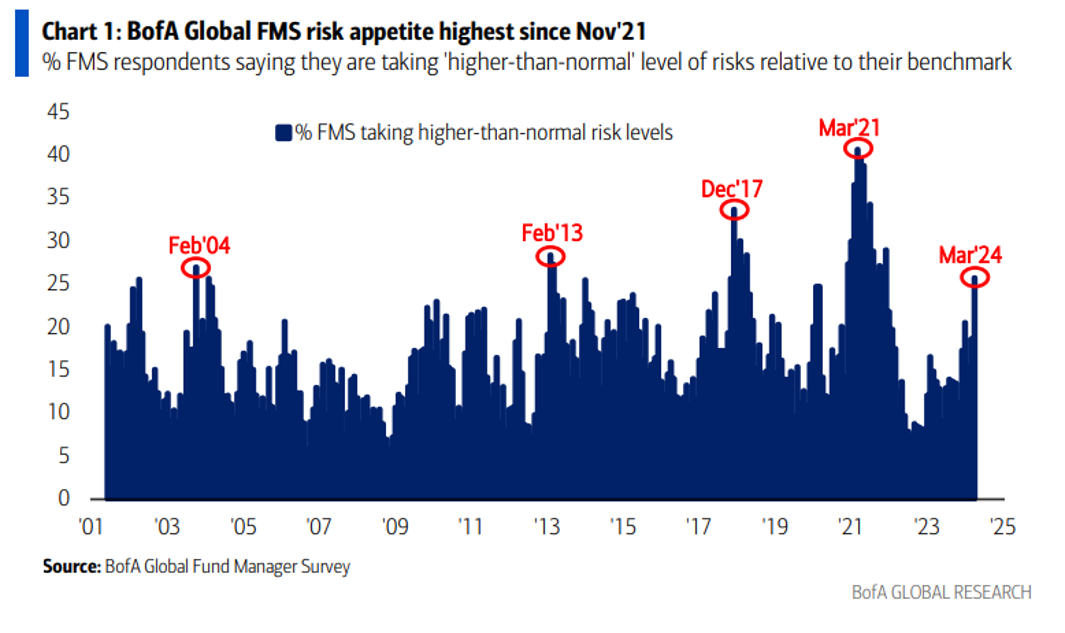
The economy is not the market. And a hiccup on the way up is bound to happen, especially when investors are overly enthusiastic.
The risk appetite of global fund managers is at its highest since November 2021.
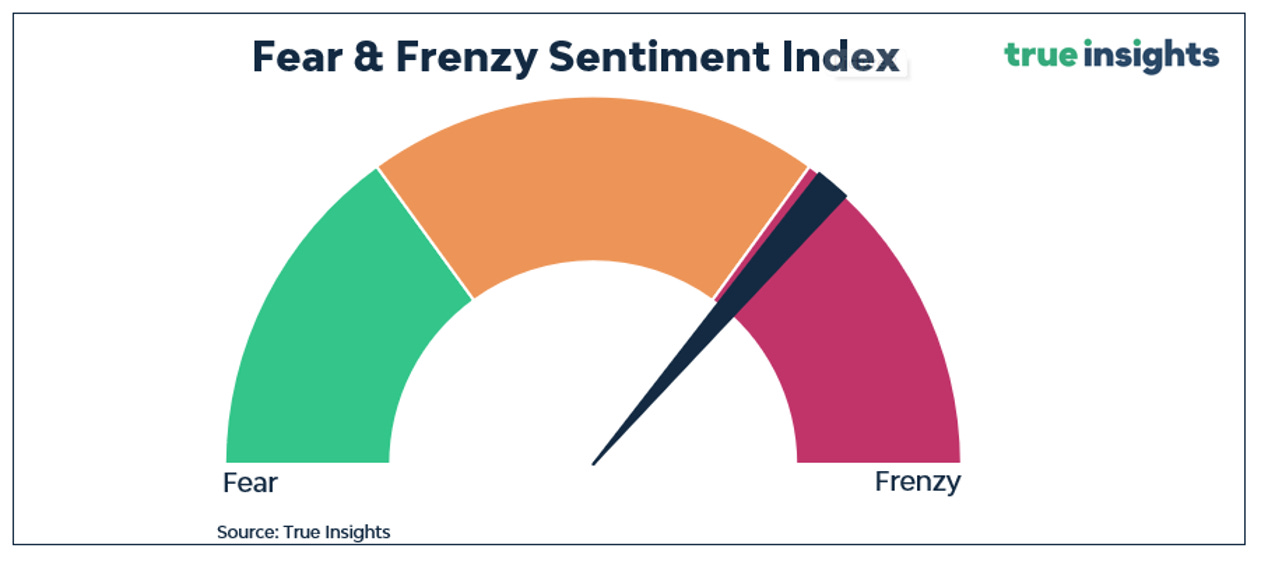
Fear & Frenzy
My Fear & Frenzy indicator has been in Frenzy mode for weeks, so the likelihood of a pullback remains elevated.
ENJOY YOUR WEEKEND!
JEROEN
MARKETS
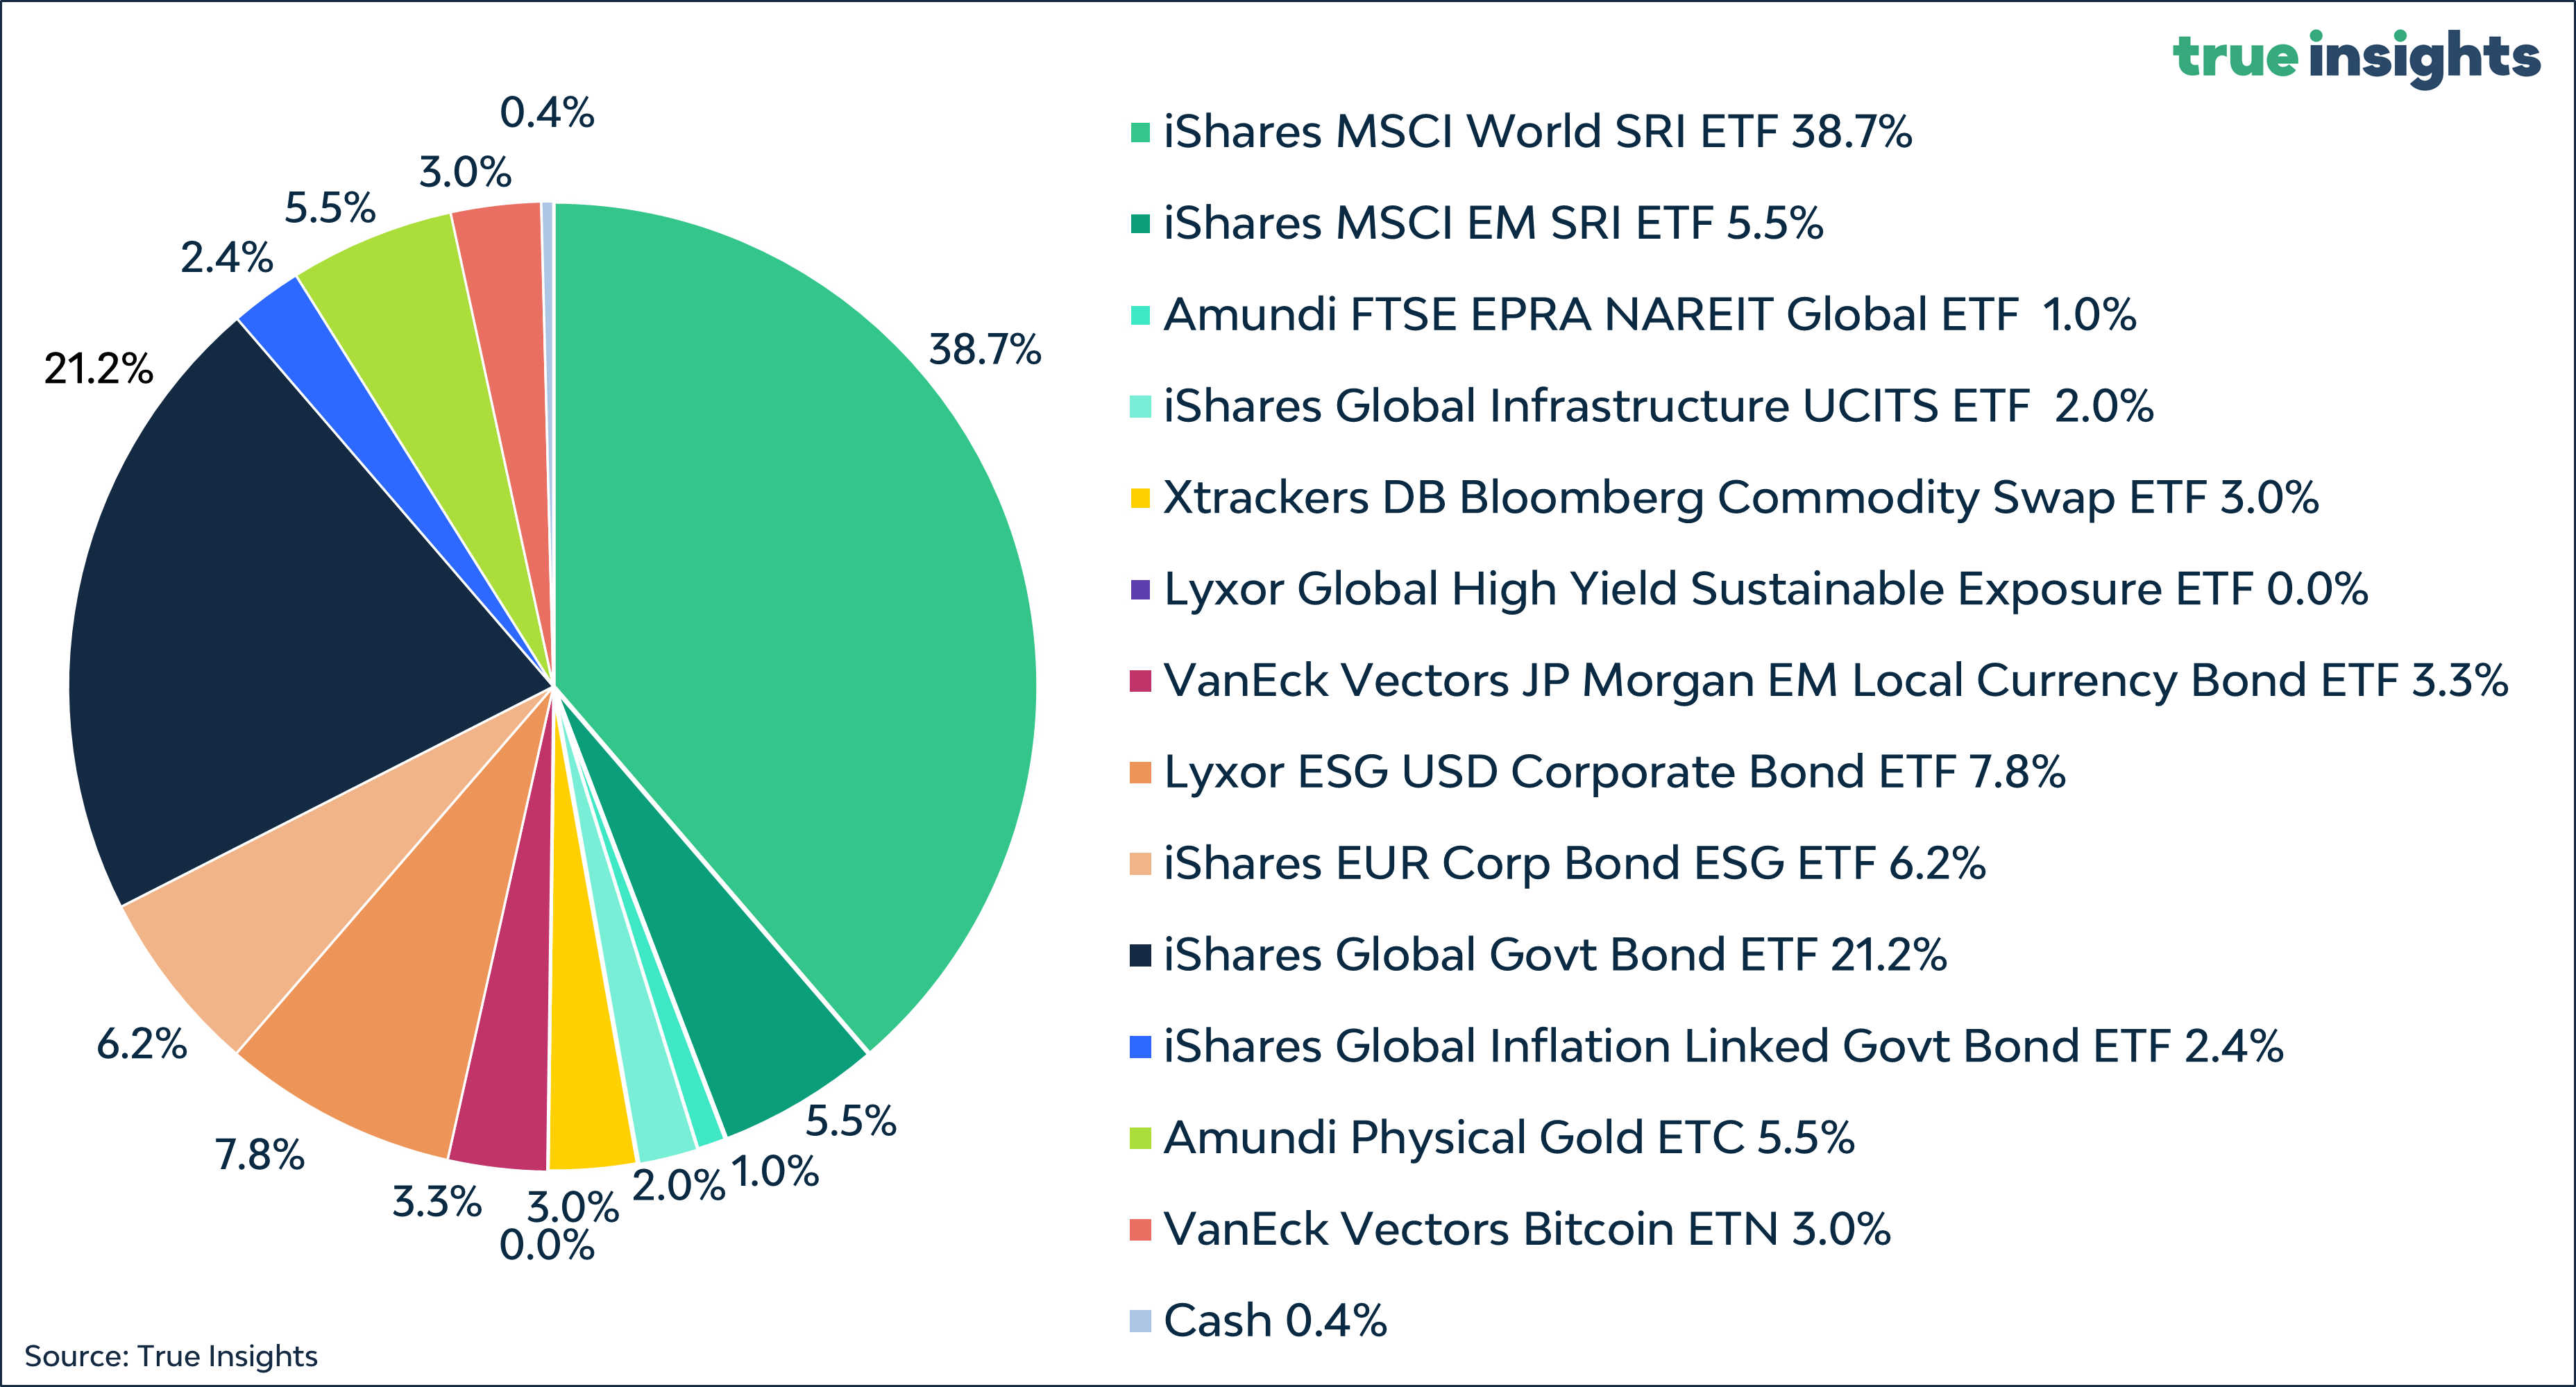
Active Weights
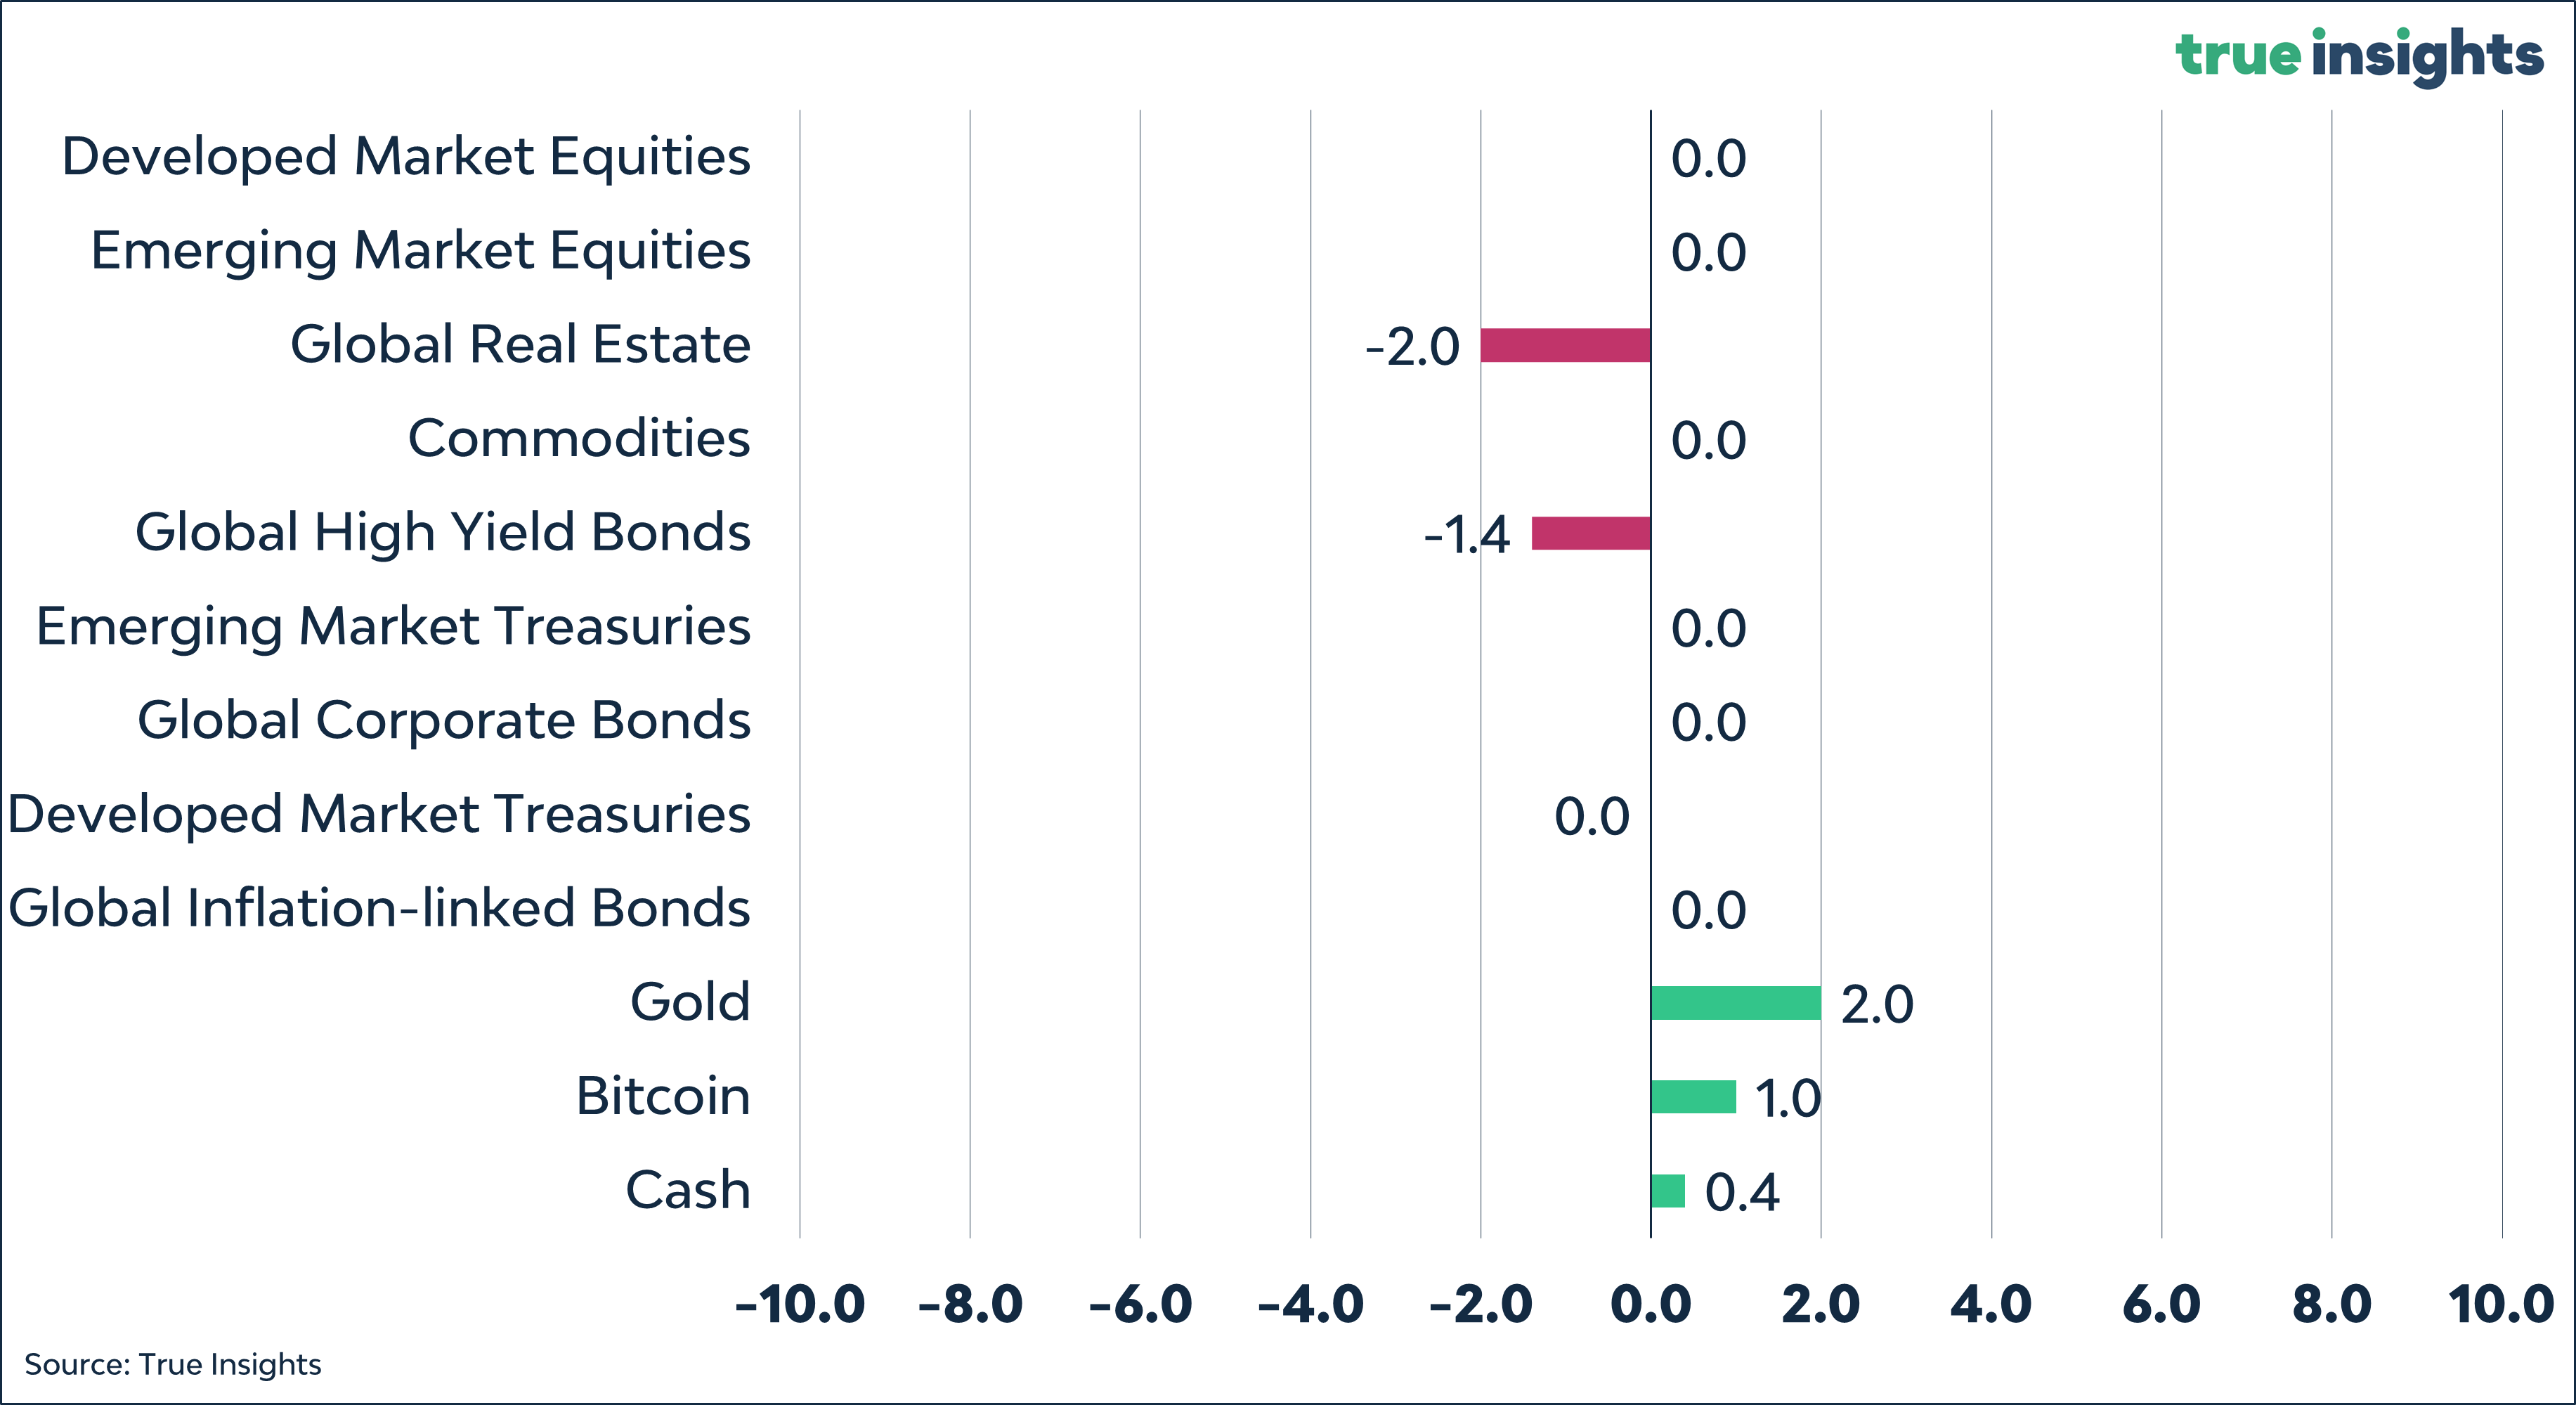
Balanced Portfolio